Linear Regression Analysis | Linear Regression in Python | Machine Learning Algorithms | Simplilearn
24 likes8,116 views

The document discusses profit estimation for companies through the application of machine learning and linear regression, emphasizing the correlation between research and development spending and profitability. It outlines various methodologies, including multiple linear regression, for accurately predicting outcomes based on independent and dependent variables. Additionally, key takeaways highlight the successful training of a model to estimate profit, demonstrating the effectiveness of linear regression in practical scenarios.


Linear Regression Analysis | Linear Regression in Python | Machine Learning Algorithms | Simplilearn
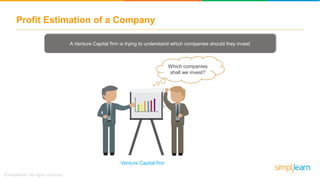
- 2. Profit Estimation of a Company Which companies shall we invest? Venture Capital firm A Venture Capital firm is trying to understand which companies should they invest
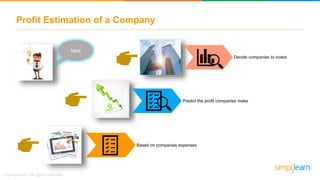
- 3. Profit Estimation of a Company Idea Based on companies expenses Predict the profit companies make Decide companies to invest
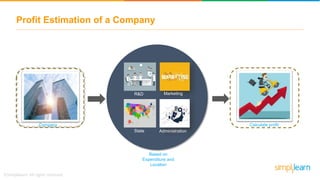
- 4. Profit Estimation of a Company Administration Marketing State R&D Based on Expenditure and Location Company Calculate profit
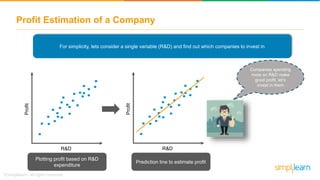
- 5. Profit Estimation of a Company For simplicity, lets consider a single variable (R&D) and find out which companies to invest in R&D Profit R&D Profit Companies spending more on R&D make good profit, let’s invest in them Plotting profit based on R&D expenditure Prediction line to estimate profit
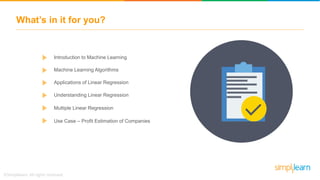
- 6. What’s in it for you? Machine Learning Algorithms Understanding Linear Regression Introduction to Machine Learning Applications of Linear Regression Multiple Linear Regression Use Case – Profit Estimation of Companies
- 7. Introduction to Machine Learning
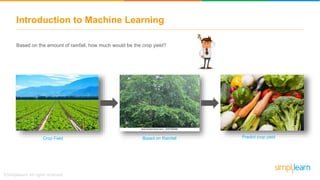
- 8. Introduction to Machine Learning Based on the amount of rainfall, how much would be the crop yield? Crop Field Predict crop yieldBased on Rainfall
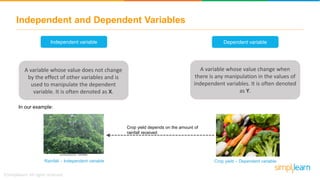
- 9. Independent and Dependent Variables Independent variable Dependent variable A variable whose value does not change by the effect of other variables and is used to manipulate the dependent variable. It is often denoted as X. A variable whose value change when there is any manipulation in the values of independent variables. It is often denoted as Y. Crop yield depends on the amount of rainfall received Rainfall – Independent variable Crop yield – Dependent variable In our example:
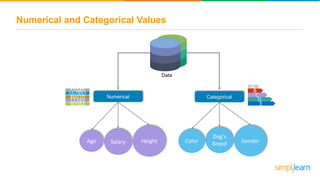
- 10. Numerical and Categorical Values Data SalaryAge Height Gender Dog’s BreedColor 12345 167891 46920 12345 90984 Numerical Categorical A C D E B
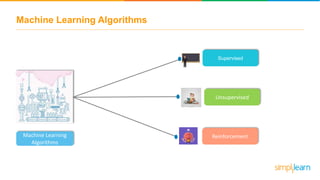
- 11. Machine Learning Algorithms Machine Learning Algorithms Supervised Unsupervised Reinforcement
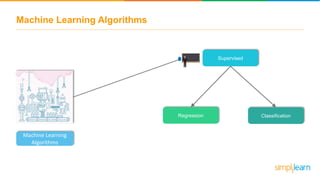
- 12. Machine Learning Algorithms Machine Learning Algorithms Supervised ClassificationRegression
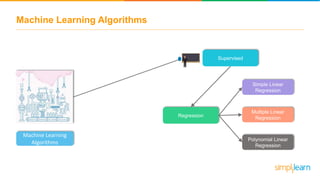
- 13. Machine Learning Algorithms Machine Learning Algorithms Supervised Regression Simple Linear Regression Polynomial Linear Regression Multiple Linear Regression
- 14. Applications of Linear Regression
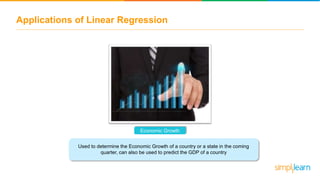
- 15. Applications of Linear Regression Economic Growth Used to determine the Economic Growth of a country or a state in the coming quarter, can also be used to predict the GDP of a country
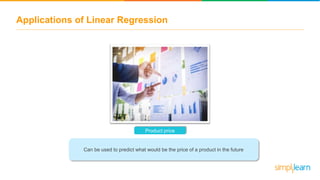
- 16. Applications of Linear Regression Product price Can be used to predict what would be the price of a product in the future
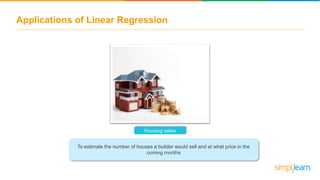
- 17. Applications of Linear Regression Housing sales To estimate the number of houses a builder would sell and at what price in the coming months
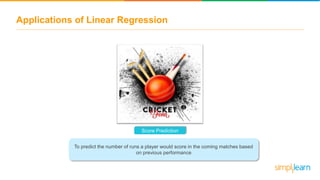
- 18. Applications of Linear Regression Score Prediction To predict the number of runs a player would score in the coming matches based on previous performance
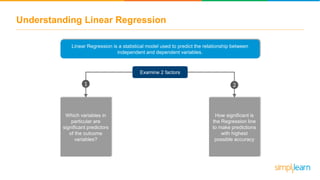
- 20. Understanding Linear Regression Linear Regression is a statistical model used to predict the relationship between independent and dependent variables. Examine 2 factors Which variables in particular are significant predictors of the outcome variables? 1 How significant is the Regression line to make predictions with highest possible accuracy 2
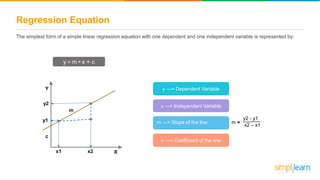
- 21. Regression Equation The simplest form of a simple linear regression equation with one dependent and one independent variable is represented by: y = m x + c* y ---> Dependent Variable x ---> Independent Variable c ---> Coefficient of the line y2 - y1 x2 – x1 m =m ---> Slope of the line Y X c m y2 y1 x2x1
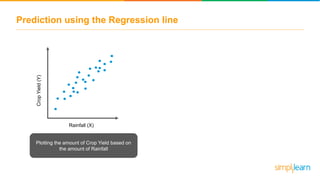
- 22. Prediction using the Regression line Rainfall (X) CropYield(Y) Plotting the amount of Crop Yield based on the amount of Rainfall
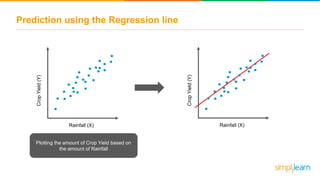
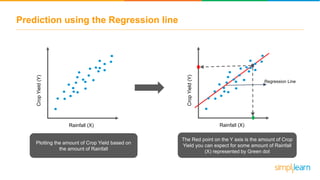
- 23. Prediction using the Regression line Rainfall (X) CropYield(Y) Plotting the amount of Crop Yield based on the amount of Rainfall Rainfall (X) CropYield(Y)
- 24. Prediction using the Regression line The Red point on the Y axis is the amount of Crop Yield you can expect for some amount of Rainfall (X) represented by Green dot Rainfall (X) CropYield(Y) Plotting the amount of Crop Yield based on the amount of Rainfall Rainfall (X) CropYield(Y) Regression Line
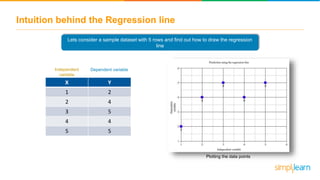
- 25. Intuition behind the Regression line Lets consider a sample dataset with 5 rows and find out how to draw the regression line X Y 1 2 2 4 3 5 4 4 5 5 Independent variable Dependent variable Plotting the data points
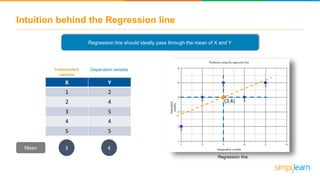
- 26. Intuition behind the Regression line Calculate the mean of X and Y and plot the values X Y 1 2 2 4 3 5 4 4 5 5 Independent variable Dependent variable Plotting the mean of X and Y Mean 3 4
- 27. Intuition behind the Regression line Regression line should ideally pass through the mean of X and Y X Y 1 2 2 4 3 5 4 4 5 5 Independent variable Dependent variable Regression line Mean 3 4 (3,4)
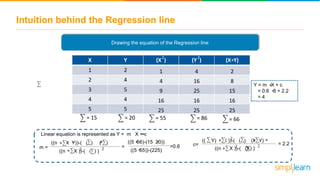
- 28. Intuition behind the Regression line Drawing the equation of the Regression line _ _ _ X Y (X ) (Y ) (X Y) 1 2 1 4 2 2 4 4 16 8 3 5 9 25 15 4 4 16 16 16 5 5 25 25 25 = 66 Linear equation is represented as Y = m X + c =m = * Y = m X + c = 0.6 3 + 2.2 = 4 * 2 2 = 55 = 86 * = 15 = 20 c= * ((n (X Y))-( (X) (Y))*** ((n (X ))-( (X) )* 2 2 ((5 66)-(15 20))* * ((5 55))-(225)* =0.6 (( (Y) (X ))-( (X) (X Y)* 2 * * ((n (X ))-( (X) )* 2 2 = 2.2
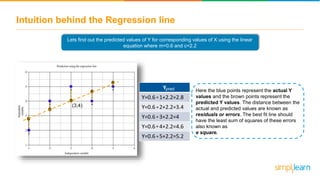
- 29. Intuition behind the Regression line Lets find out the predicted values of Y for corresponding values of X using the linear equation where m=0.6 and c=2.2 Here the blue points represent the actual Y values and the brown points represent the predicted Y values. The distance between the actual and predicted values are known as residuals or errors. The best fit line should have the least sum of squares of these errors also known as e square. (3,4) Y Y=0.6 1+2.2=2.8 Y=0.6 2+2.2=3.4 Y=0.6 3+2.2=4 Y=0.6 4+2.2=4.6 Y=0.6 5+2.2=5.2 pred * * * * *
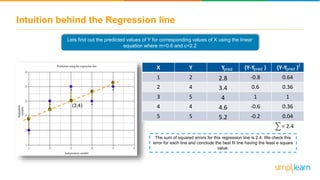
- 30. Intuition behind the Regression line Lets find out the predicted values of Y for corresponding values of X using the linear equation where m=0.6 and c=2.2 (3,4) _ _ X Y Y (Y-Y ) (Y-Y ) 1 2 2.8 -0.8 0.64 2 4 3.4 0.6 0.36 3 5 4 1 1 4 4 4.6 -0.6 0.36 5 5 5.2 -0.2 0.04 = 2.4 pred pred pred 2 The sum of squared errors for this regression line is 2.4. We check this error for each line and conclude the best fit line having the least e square value.
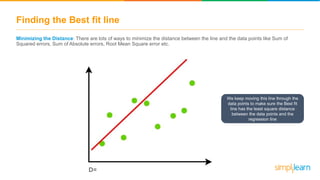
- 31. Finding the Best fit line Minimizing the Distance: There are lots of ways to minimize the distance between the line and the data points like Sum of Squared errors, Sum of Absolute errors, Root Mean Square error etc. We keep moving this line through the data points to make sure the Best fit line has the least square distance between the data points and the regression line
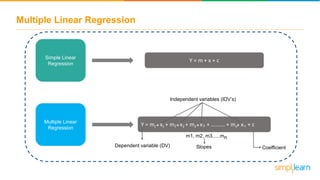
- 33. Multiple Linear Regression Simple Linear Regression Multiple Linear Regression Y = m x + c* 2 * Y = m x + m x + m x + ………. + m x + c*1 1 * 2 3 3*2 n n* Independent variables (IDV’s) Dependent variable (DV) Coefficient nm1, m2, m3…..m Slopes
- 34. Implementation of Linear Regression
- 35. Use case implementation of Linear Regression Let’s understand how Multiple Linear Regression works by implementing it in Python
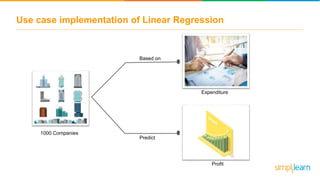
- 36. Use case implementation of Linear Regression 1000 Companies Profit Expenditure Based on Predict
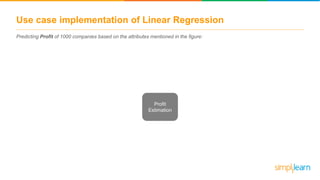
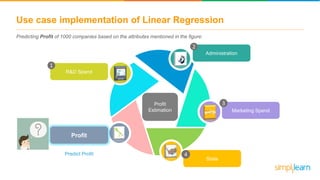
- 37. Use case implementation of Linear Regression Predicting Profit of 1000 companies based on the attributes mentioned in the figure: Profit Estimation
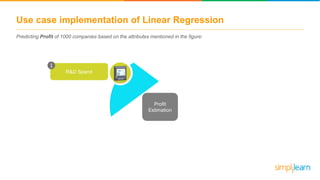
- 38. Use case implementation of Linear Regression Predicting Profit of 1000 companies based on the attributes mentioned in the figure: R&D Spend 1 Profit Estimation
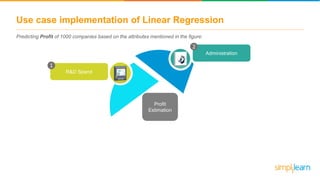
- 39. Use case implementation of Linear Regression Predicting Profit of 1000 companies based on the attributes mentioned in the figure: R&D Spend 1 Administration 2 Profit Estimation
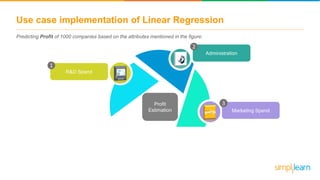
- 40. Use case implementation of Linear Regression Predicting Profit of 1000 companies based on the attributes mentioned in the figure: R&D Spend 1 Marketing Spend 3 Administration 2 Profit Estimation
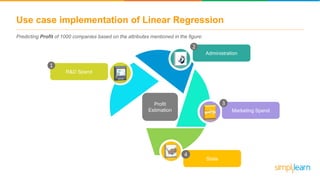
- 41. Use case implementation of Linear Regression Predicting Profit of 1000 companies based on the attributes mentioned in the figure: R&D Spend 1 State 4 Marketing Spend 3 Administration 2 Profit Estimation
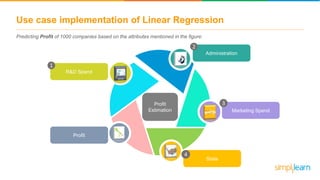
- 42. Use case implementation of Linear Regression Predicting Profit of 1000 companies based on the attributes mentioned in the figure: R&D Spend 1 State 4 Marketing Spend 3 Administration 2 ProfitProfit Profit Estimation
- 43. Use case implementation of Linear Regression Predicting Profit of 1000 companies based on the attributes mentioned in the figure: R&D Spend 1 State 4 Marketing Spend 3 Administration 2 ProfitProfit Profit Estimation Predict Profit
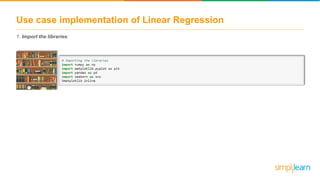
- 44. Use case implementation of Linear Regression 1. Import the libraries:
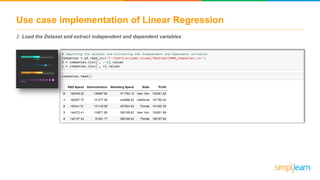
- 45. Use case implementation of Linear Regression 2. Load the Dataset and extract independent and dependent variables:
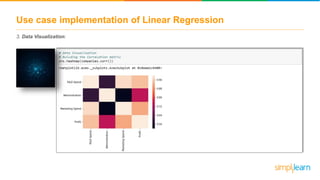
- 46. Use case implementation of Linear Regression 3. Data Visualization:
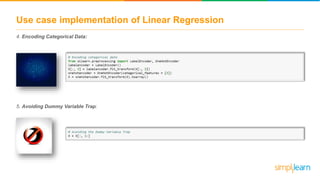
- 47. Use case implementation of Linear Regression 4. Encoding Categorical Data: 5. Avoiding Dummy Variable Trap:
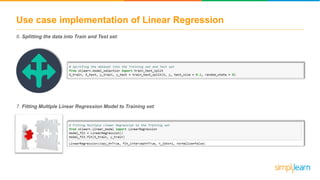
- 48. Use case implementation of Linear Regression 6. Splitting the data into Train and Test set: 7. Fitting Multiple Linear Regression Model to Training set:
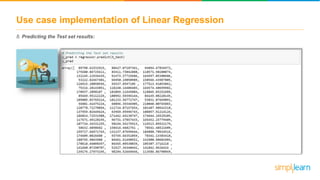
- 49. Use case implementation of Linear Regression 8. Predicting the Test set results:
- 50. Use case implementation of Linear Regression 9. Calculating the Coefficients and Intercepts:
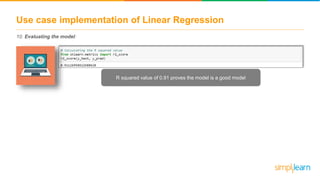
- 51. Use case implementation of Linear Regression 10. Evaluating the model: R squared value of 0.91 proves the model is a good model
- 52. Use case summary We successfully trained our model with certain predictors and estimated the profit of companies using linear regression
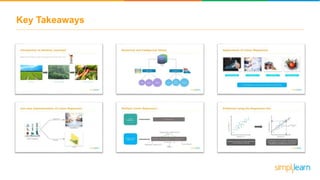
- 53. Key Takeaways
Editor's Notes
- #2: Style - 01
- #3: Style - 01
- #4: Style - 01
- #5: Style - 01
- #6: Style - 01
- #7: Style - 01
- #9: Style - 01
- #10: Style - 01
- #11: Style - 01
- #12: Style - 01
- #13: Style - 01
- #14: Style - 01
- #16: Style - 01
- #17: Style - 01
- #18: Style - 01
- #19: Style - 01
- #21: Style - 01
- #22: Style - 01
- #23: Style - 01
- #24: Style - 01
- #25: Style - 01
- #26: Style - 01
- #27: Style - 01
- #28: Style - 01
- #29: Style - 01
- #30: Style - 01
- #31: Style - 01
- #32: Style - 01
- #34: Style - 01
- #36: Style - 01
- #37: Style - 01
- #38: Style - 01
- #39: Style - 01
- #40: Style - 01
- #41: Style - 01
- #42: Style - 01
- #43: Style - 01
- #44: Style - 01
- #45: Style - 01
- #46: Style - 01
- #47: Style - 01
- #48: Style - 01
- #49: Style - 01
- #50: Style - 01
- #51: Style - 01
- #52: Style - 01
- #53: Style - 01
- #54: Style - 01