Performance profiling and
testing of a Symfony
application
Performance profiling and testing of symfony application 2
About me
● Developer Advocate
● Release Manager
● Trainer
● Team Leader
● Software Engineer
at
Performance profiling
Finding bottlenecks in the code to make it work faster
Performance testing
- The process of evaluating the quality or capacity of a
product.
- Performance testing is vital in the software development
lifecycle.
The goal
To measure code quality
Profiling without testing
- Possible only when your project will not be changed.
- If the code is left tested, even one line can break
everything with the damage discovered by clients already
in production.
When do we need profiling?
- The website is down because of overload
- Website load takes more than 2 seconds (performance is
a mandatory feature of any website)
- How One Second Could Cost Amazon $1.6 Billion In
Sales
When we don’t need profiling?
- The customer said there would have a significant load in production without
giving any proof.
- Premature optimization is almost always a bad idea.
This doesn’t mean you should use $repo->findAll()->paginate(),
This means: don’t do profiling when there are no performance issues.
Step #1
At ORO we started with:
- A time limit for Behat tests
- A network tab in the Chrome Dev Toolbar
Issue #1
Time is a good but unreliable metric.
How to know when time goes up because of:
- VM load
- CPU throttling
- Network issues
- Unreliable external API
- Or bad code ?
If the website has slowed down, you can blame:
- A software developer
- A system administrator
- The Hardware
Blame someone else but don’t fix it
How to blame the PHP code?
Don’t measure the time, measure the code quality.
The quality from performance perspective, not OOD
Why is a PHP application slow?
- PHP
- PHP 7 twice as fast as the same code on PHP 5.6
- Framework
- Symfony 4 twice as fast as the same code on Symfony 3.4
because of
SQL
Step #2
Let’s measure bad SQL with Symfony toolbar extension
- Hydration time
- Slow with a lot of joins
- Queries count
- Duplicate queries count
- same queries with different params
- Identical queries count
- Same queries
- Performance tab
- time based
Performance tab metrics
Extend performance tab metrics
@debug.stopwatch
Step #2.1
Repeat the same for all network operations if they affect
performance:
- External API calls count
- Redis cache requests count
- Filesystem access count
- Memory usage by application or better the method
- etc. count
Issue #2
Developers don’t check Toolbar
Step #3
Integrate query metrics with test framework
Test query metrics only on real or real-life data.
Issue #3
Now PHP and Framework usage is a bottleneck
Symfony Toolbar Main Issue
Symfony developer toolbar adds overhead by itself and
can’t be used in production
So it can’t be used for real precise profiling
Step #4
Choose the tool for profiling PHP code.
- xDebug
- good start, but it’s not a profiler
- Xhprof
- very basic functionality, only time and memory
- Blackfire
- fork of Xhprof, widely used, a lot of integrations
- free plan has all xhprof features in a fancy interface, paid plans bring a lot of features
- Tideways
- fork of Xhprof
- Very similar to blackfire by the feature list but not so common
Blackfire pros
- Low overhead *
- Can be used in production
- A lot of ways to use, from CURL to Player
- Profile comparing
- Sharing
- Cross platform support
- Testing by all the metrics
- Periodic builds on production
- Profile every N request on overloaded application
Blackfire cons
- Most of features only available with paid plans.
- The big overhead on new PHP versions.
- Interface not always intuitive.
- *Requires prod-like environment.
Blackfire graph view
Blackfire Timeline View
Blackfire Recorder
Blackfire Metrics
Defining custom metrics at Blackfire
Blackfire Tests
Can replace some generic Symfony profiler based tests
Blackfire SDK
PhpUnit integration
BlackfireBridgePhpUnitTestCaseTrait;
Behat Integration
Validate environment configuration
- bin/symfony_requirements
- bin/console doctrine:ensure-production-settings
- bin/console oro:check-requirements
- Blackfire configs
What else?
Xdebug extension to check Garbage Collector
efficiency
Logging
Monolog Processors to enrich log messages
● Elapsed memory
● Current memory
● Peak memory
● Time taken
● Channels
Reach log message
Collecting Logs
Logs Monitoring
To summarize
Metrics can be used for:
- Local profiling
- CI tests
- Production testing
- Load testing
To summarize
To make a developer follow metrics:
- Make every metric explicit and as small as possible
- Describe the value of all the metrics and how to fix them
- Don’t rely on time or other unstable metrics
- Don’t add tests to common metrics that you don’t know
how to fix
To summarize
- Symfony Toolbar and Blackfire are best friends of
profiling
- xDebug could help too but be carefull
- Logging helps to “profile” in production
Questions

More Related Content

PDF
Code Quality Control in a PHP project. GeekTalks, Cherkassy 2020
PDF
Effectively Reuse the Code Between PHP Projects
PDF
Test Driven Development with PHP
PDF
TestWorks Conf Robot framework - the unsung hero of test automation - Michael...
PDF
PHPUnit with Magento
PDF
Writing Tests with the Unity Test Framework
PDF
Coding Dojo: Naming with Dices (2021)
PDF
User story workflow (eng)
Code Quality Control in a PHP project. GeekTalks, Cherkassy 2020
Effectively Reuse the Code Between PHP Projects
Test Driven Development with PHP
TestWorks Conf Robot framework - the unsung hero of test automation - Michael...
PHPUnit with Magento
Writing Tests with the Unity Test Framework
Coding Dojo: Naming with Dices (2021)
User story workflow (eng)

What's hot (20)

PPTX
21o. RubyFloripa - Maintaining legacy Rails app and introducing Elixir
PPTX
Introduction to robot framework
PDF
Pragmatic Introduction to Python Unit Testing (PyDays 2018)
ODP
Behaviour Driven Development Hands-on
PDF
Civilized Git Process
PPTX
Robot framework Gowthami Goli
PDF
Coding Dojo: Baby Steps Push Challenge (2021)
ODP
Test Driven Development (TDD) with Windows PowerShell
PPTX
Framework
PDF
Using Automated Code Reviews to Achieve Continuous Quality (ASQF Agile Night ...
PDF
Robot framework - Lord of the Rings
PDF
Outside-in Test Driven Development - the London School of TDD
PPTX
Acceptance Test Driven Development and Robot Framework
ODP
Lighning Talk: PHP build process
PDF
Barcamp Bangkhen :: Robot Framework
PDF
Continuous Integration In Php
PDF
Project Management: Burn-Down Chart / OrangeHRM Project MOD (eng)
PDF
Tracking and improving software quality with SonarQube
PDF
Introduction to Robot Framework
PPTX
Automatic Test 2019-07-25
21o. RubyFloripa - Maintaining legacy Rails app and introducing Elixir
Introduction to robot framework
Pragmatic Introduction to Python Unit Testing (PyDays 2018)
Behaviour Driven Development Hands-on
Civilized Git Process
Robot framework Gowthami Goli
Coding Dojo: Baby Steps Push Challenge (2021)
Test Driven Development (TDD) with Windows PowerShell
Framework
Using Automated Code Reviews to Achieve Continuous Quality (ASQF Agile Night ...
Robot framework - Lord of the Rings
Outside-in Test Driven Development - the London School of TDD
Acceptance Test Driven Development and Robot Framework
Lighning Talk: PHP build process
Barcamp Bangkhen :: Robot Framework
Continuous Integration In Php
Project Management: Burn-Down Chart / OrangeHRM Project MOD (eng)
Tracking and improving software quality with SonarQube
Introduction to Robot Framework
Automatic Test 2019-07-25
Ad

Similar to Performance profiling and testing of symfony application 2 (20)

PDF
Joomla Code Quality Control and Automation Testing
PPTX
Continuous integration / continuous delivery of web applications, Eugen Kuzmi...
PPTX
Continuous Integration/ Continuous Delivery of web applications
PDF
Continuous integration / continuous delivery
PPTX
Optimizing and Profiling Golang Rest Api
PDF
Taking your code to production
PDF
Web Developer Tools
PPT
[ENGLISH] TDC 2015 - PHP Trail - Tests and PHP Continuous Integration Enviro...
KEY
improving the performance of Rails web Applications
PPTX
QA or the Highway 2022.pptx
PPTX
Profiling and Tuning a Web Application - The Dirty Details
PPTX
Optimizing performance
PPT
" Performance testing for Automation QA - why and how " by Andrey Kovalenko f...
PPT
Встреча "QA: в каких направлениях может найти себя тестировщик?"
PPTX
Solving the Automation Puzzle - how to select the right automation framework ...
PDF
Profiling and inspection with Blackfire.io
PPTX
Infrastructure as Code for Network
PPT
Delivering High Performance Ecommerce with Magento Commerce Cloud
PDF
"To cover uncoverable", Andrii Shumada
PDF
Phonegap Development & Debugging
Joomla Code Quality Control and Automation Testing
Continuous integration / continuous delivery of web applications, Eugen Kuzmi...
Continuous Integration/ Continuous Delivery of web applications
Continuous integration / continuous delivery
Optimizing and Profiling Golang Rest Api
Taking your code to production
Web Developer Tools
[ENGLISH] TDC 2015 - PHP Trail - Tests and PHP Continuous Integration Enviro...
improving the performance of Rails web Applications
QA or the Highway 2022.pptx
Profiling and Tuning a Web Application - The Dirty Details
Optimizing performance
" Performance testing for Automation QA - why and how " by Andrey Kovalenko f...
Встреча "QA: в каких направлениях может найти себя тестировщик?"
Solving the Automation Puzzle - how to select the right automation framework ...
Profiling and inspection with Blackfire.io
Infrastructure as Code for Network
Delivering High Performance Ecommerce with Magento Commerce Cloud
"To cover uncoverable", Andrii Shumada
Phonegap Development & Debugging
Ad

More from Andrew Yatsenko (8)

PDF
OroCommerce Storefront Design. Non-standard Layout Customisation.
PDF
Gear Up for OroPlatform 4.1 LTS. Dependency Injection Improvements Overview ...
PDF
Make the most of twig
PDF
Using Oro layouts
PDF
Data cache management in php
PDF
Doctrine Internals. UnitOfWork
PDF
Writing extensible applications
PDF
Symfony Form Basics - OroMeetup #3 Cherkassy
OroCommerce Storefront Design. Non-standard Layout Customisation.
Gear Up for OroPlatform 4.1 LTS. Dependency Injection Improvements Overview ...
Make the most of twig
Using Oro layouts
Data cache management in php
Doctrine Internals. UnitOfWork
Writing extensible applications
Symfony Form Basics - OroMeetup #3 Cherkassy

Recently uploaded (20)

PPTX
Sorting and Hashing in Data Structures with Algorithms, Techniques, Implement...
PDF
August 2025 - Top 10 Read Articles in Network Security & Its Applications
PPTX
Measurement Uncertainty and Measurement System analysis
PPTX
mechattonicsand iotwith sensor and actuator
PPTX
Management Information system : MIS-e-Business Systems.pptx
PDF
Influence of Green Infrastructure on Residents’ Endorsement of the New Ecolog...
PDF
Exploratory_Data_Analysis_Fundamentals.pdf
PDF
20250617 - IR - Global Guide for HR - 51 pages.pdf
PDF
Artificial Superintelligence (ASI) Alliance Vision Paper.pdf
PPTX
A Brief Introduction to IoT- Smart Objects: The "Things" in IoT
PPTX
Module 8- Technological and Communication Skills.pptx
PPTX
Graph Data Structures with Types, Traversals, Connectivity, and Real-Life App...
PDF
Applications of Equal_Area_Criterion.pdf
PPTX
Chapter 2 -Technology and Enginerring Materials + Composites.pptx
PPTX
Software Engineering and software moduleing
PDF
Prof. Dr. KAYIHURA A. SILAS MUNYANEZA, PhD..pdf
PPTX
Petroleum Refining & Petrochemicals.pptx
PDF
UEFA_Embodied_Carbon_Emissions_Football_Infrastructure.pdf
PDF
Computer System Architecture 3rd Edition-M Morris Mano.pdf
PPTX
Amdahl’s law is explained in the above power point presentations
Sorting and Hashing in Data Structures with Algorithms, Techniques, Implement...
August 2025 - Top 10 Read Articles in Network Security & Its Applications
Measurement Uncertainty and Measurement System analysis
mechattonicsand iotwith sensor and actuator
Management Information system : MIS-e-Business Systems.pptx
Influence of Green Infrastructure on Residents’ Endorsement of the New Ecolog...
Exploratory_Data_Analysis_Fundamentals.pdf
20250617 - IR - Global Guide for HR - 51 pages.pdf
Artificial Superintelligence (ASI) Alliance Vision Paper.pdf
A Brief Introduction to IoT- Smart Objects: The "Things" in IoT
Module 8- Technological and Communication Skills.pptx
Graph Data Structures with Types, Traversals, Connectivity, and Real-Life App...
Applications of Equal_Area_Criterion.pdf
Chapter 2 -Technology and Enginerring Materials + Composites.pptx
Software Engineering and software moduleing
Prof. Dr. KAYIHURA A. SILAS MUNYANEZA, PhD..pdf
Petroleum Refining & Petrochemicals.pptx
UEFA_Embodied_Carbon_Emissions_Football_Infrastructure.pdf
Computer System Architecture 3rd Edition-M Morris Mano.pdf
Amdahl’s law is explained in the above power point presentations

Performance profiling and testing of symfony application 2

  • 1. Performance profiling and testing of a Symfony application
  • 3. About me ● Developer Advocate ● Release Manager ● Trainer ● Team Leader ● Software Engineer at
  • 4. Performance profiling Finding bottlenecks in the code to make it work faster
  • 5. Performance testing - The process of evaluating the quality or capacity of a product. - Performance testing is vital in the software development lifecycle.
  • 6. The goal To measure code quality
  • 7. Profiling without testing - Possible only when your project will not be changed. - If the code is left tested, even one line can break everything with the damage discovered by clients already in production.
  • 8. When do we need profiling? - The website is down because of overload - Website load takes more than 2 seconds (performance is a mandatory feature of any website) - How One Second Could Cost Amazon $1.6 Billion In Sales
  • 9. When we don’t need profiling? - The customer said there would have a significant load in production without giving any proof. - Premature optimization is almost always a bad idea. This doesn’t mean you should use $repo->findAll()->paginate(), This means: don’t do profiling when there are no performance issues.
  • 10. Step #1 At ORO we started with: - A time limit for Behat tests - A network tab in the Chrome Dev Toolbar
  • 11. Issue #1 Time is a good but unreliable metric. How to know when time goes up because of: - VM load - CPU throttling - Network issues - Unreliable external API - Or bad code ?
  • 12. If the website has slowed down, you can blame: - A software developer - A system administrator - The Hardware Blame someone else but don’t fix it
  • 13. How to blame the PHP code? Don’t measure the time, measure the code quality. The quality from performance perspective, not OOD
  • 14. Why is a PHP application slow? - PHP - PHP 7 twice as fast as the same code on PHP 5.6 - Framework - Symfony 4 twice as fast as the same code on Symfony 3.4
  • 16. Step #2 Let’s measure bad SQL with Symfony toolbar extension - Hydration time - Slow with a lot of joins - Queries count - Duplicate queries count - same queries with different params - Identical queries count - Same queries - Performance tab - time based
  • 19. Extend performance tab metrics @debug.stopwatch
  • 20. Step #2.1 Repeat the same for all network operations if they affect performance: - External API calls count - Redis cache requests count - Filesystem access count - Memory usage by application or better the method - etc. count
  • 22. Step #3 Integrate query metrics with test framework
  • 23. Test query metrics only on real or real-life data.
  • 24. Issue #3 Now PHP and Framework usage is a bottleneck
  • 25. Symfony Toolbar Main Issue Symfony developer toolbar adds overhead by itself and can’t be used in production So it can’t be used for real precise profiling
  • 26. Step #4 Choose the tool for profiling PHP code. - xDebug - good start, but it’s not a profiler - Xhprof - very basic functionality, only time and memory - Blackfire - fork of Xhprof, widely used, a lot of integrations - free plan has all xhprof features in a fancy interface, paid plans bring a lot of features - Tideways - fork of Xhprof - Very similar to blackfire by the feature list but not so common
  • 27. Blackfire pros - Low overhead * - Can be used in production - A lot of ways to use, from CURL to Player - Profile comparing - Sharing - Cross platform support - Testing by all the metrics - Periodic builds on production - Profile every N request on overloaded application
  • 28. Blackfire cons - Most of features only available with paid plans. - The big overhead on new PHP versions. - Interface not always intuitive. - *Requires prod-like environment.
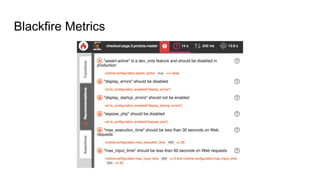
  • 33. Defining custom metrics at Blackfire
  • 34. Blackfire Tests Can replace some generic Symfony profiler based tests
  • 38. Validate environment configuration - bin/symfony_requirements - bin/console doctrine:ensure-production-settings - bin/console oro:check-requirements - Blackfire configs
  • 40. Xdebug extension to check Garbage Collector efficiency
  • 41. Logging Monolog Processors to enrich log messages ● Elapsed memory ● Current memory ● Peak memory ● Time taken ● Channels
  • 45. To summarize Metrics can be used for: - Local profiling - CI tests - Production testing - Load testing
  • 46. To summarize To make a developer follow metrics: - Make every metric explicit and as small as possible - Describe the value of all the metrics and how to fix them - Don’t rely on time or other unstable metrics - Don’t add tests to common metrics that you don’t know how to fix
  • 47. To summarize - Symfony Toolbar and Blackfire are best friends of profiling - xDebug could help too but be carefull - Logging helps to “profile” in production