Change the size of Dash Graph in Python
Last Updated :
03 Jul, 2024
Dash is a popular Python framework for building interactive web applications, particularly for data visualization. Developed by Plotly, Dash allows users to create web-based dashboards with minimal code. One common requirement when working with Dash is adjusting the size of graphs to fit the layout and design needs of the dashboard.
What is a Dash Graph?
A Dash graph is a data visualization component created using the Plotly library within a Dash application. These graphs can be interactive and customized in various ways, including their size, colors, layout, and interactivity features. Dash graphs are typically used to represent data insights in a clear and visually appealing manner. Make sure you have installed all the required Dash packages correctly. Run the following commands to ensure everything is up to date:
pip install dash dash-core-components dash-html-components
Methods to Change the Window Size of Your Dash Graph
Example 1: Using the style Attribute
One of the simplest ways to change the size of a Dash graph is by using the style attribute in the dcc.Graph component. This method allows you to set the width and height of the graph directly.
Python
import dash
import dash_core_components as dcc
import dash_html_components as html
# Create a Dash application
app = dash.Dash(__name__)
# Define the layout of the app
app.layout = html.Div([
dcc.Graph(
id='example-graph',
figure={
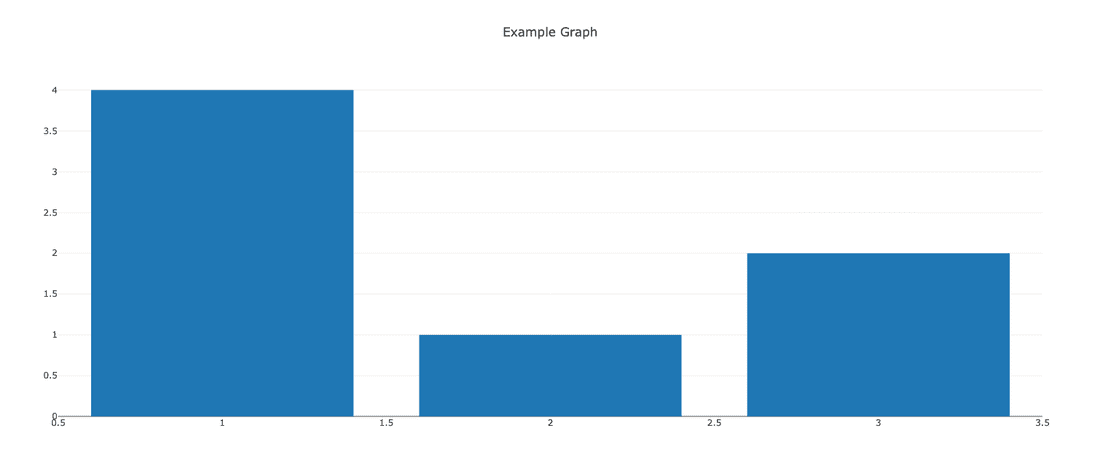
'data': [{'x': [1, 2, 3], 'y': [4, 1, 2], 'type': 'bar', 'name': 'Example'}],
'layout': {'title': 'Example Graph'}
},
style={'width': '50%', 'height': '500px'}
)
])
# Run the app
if __name__ == '__main__':
app.run_server(debug=True)
In this example, the style attribute sets the width to 50% of the parent container and the height to 500 pixels.
Output:
 How Can I Change the Size of My Dash Graph?
Example 2: Using Plotly Layout
Another way to change the size of your Dash graph is by adjusting the layout properties in the Plotly figure. The width and height properties of the layout dictionary can be used to set the size of the graph.
Python
import dash
import dash_core_components as dcc
import dash_html_components as html
import plotly.graph_objs as go

# Create a Dash application
app = dash.Dash(__name__)

# Define the layout of the app
app.layout = html.Div([
    dcc.Graph(
        id='example-graph',
        figure={
            'data': [go.Bar(x=[1, 2, 3], y=[4, 1, 2], name='Example')],
            'layout': go.Layout(
                title='Example Graph',
                width=600,
                height=400
            )
        }
    )
])

# Run the app
if __name__ == '__main__':
    app.run_server(debug=True)
Here, the width and height properties in the layout dictionary are used to set the size of the graph to 600 by 400 pixels.
 How Can I Change the Size of My Dash Graph? - 2
Example 3: Responsive Graph Sizing
To create a graph that dynamically adjusts its size based on the window size, you can use CSS and the style attribute together. This approach makes the graph responsive and adaptable to different screen sizes.
Python
import dash
import dash_core_components as dcc
import dash_html_components as html

# Create a Dash application
app = dash.Dash(__name__)

# Define the layout of the app
app.layout = html.Div([
    dcc.Graph(
        id='example-graph',
        figure={
            'data': [{'x': [1, 2, 3], 'y': [4, 1, 2], 'type': 'bar', 'name': 'Example'}],
            'layout': {'title': 'Example Graph'}
        },
        style={'width': '100%', 'height': '100vh'}  # 100% width and 100% viewport height
    )
], style={'height': '100vh'})  # Ensure the parent div takes the full viewport height

# Run the app
if __name__ == '__main__':
    app.run_server(debug=True)
In this example, the graph will take up 100% of the width and height of the viewport, making it fully responsive to changes in window size.
Output:
 How Can I Change the Size of My Dash Graph? -3
Conclusion
Changing the size of your Dash graph is crucial for creating a visually appealing and user-friendly dashboard. Whether you prefer using the style attribute, adjusting the Plotly layout properties, or creating a responsive design with CSS, Dash provides flexible methods to customize the size of your graphs. These examples demonstrate how to effectively resize your graphs to fit the specific needs of your Dash application.
Similar Reads
How to change figure size in Plotly in Python
In this article, we will discuss how we can change the figure size in Plotly in Python. Let's firstly take about Plotly in Python. Plotly  Python library provides us with an interactive open-source Plotly library that can support over 40 unique chart types that cover a wide list of statistical, fin
4 min read
Change figure size in Pandas - Python
Prerequisites: Pandas The size of a plot can be modified by passing required dimensions as a tuple to the figsize parameter of the plot() method. it is used to determine the size of a figure object. Syntax: figsize=(width, height) Where dimensions should be given in inches. ApproachImport pandas.Cre
1 min read
How to Change the Font Size in Python Shell?
In this article, we will see how to Change the Font Size in Python Shell Follow these steps to change font size: Step 1: Open the Python shell Python Shell Step 2: Click on the Options and select Configure IDLE Step 3: In Fonts/Tabs tab set Size value Step 4: Let's select a size value is 16 and clic
1 min read
How to change the colorbar size of a seaborn heatmap figure in Python?
Prerequisites: Seaborn A colorbar is a rectangular color scale that is used to interpret the data of a heatmap. By default, it is of the same size as the heatmap but its size can be changed using the cbar_kws parameter of the heatmap() function. This parameter accepts dictionary type values and to c
2 min read
Change plot size in Matplotlib - Python
Plots are an effective way of visually representing data and summarizing it beautifully. However, if not plotted efficiently it seems appears complicated. Python's Matplotlib provides several libraries for data representation. While making a plot we need to optimize its size. In this article, we wil
3 min read
Python - Change legend size in Plotly chart
The data on the graph's Y-axis, also known as the graph series, is reflected in the legend of the graph. This is the information that comes from the columns of the relevant grid report, and it usually consists of metrics. A graph legend is usually displayed as a box on the right or left side of your
2 min read
How to Change the Size of Figures in Matplotlib?
Matplotlib provides a default figure size of 6.4 inches in width and 4.8 inches in height. While this is suitable for basic graphs, various situations may require resizing figures for better visualization, presentation or publication. This article explores multiple methods to adjust the figure size
3 min read
Creating a Path Graph Using Networkx in Python
A path graph is a connected graph denoted by Pn if it contains n nodes. Nodes are connected in form of a straight line in a path graph. Here we will discuss how networkx module can be used to generate one using its inbuilt path_graph() function. Properties of Path Graph:The number of nodes in a path
2 min read
How to Change the Font Size of Colorbars in Matplotlib
Matplotlib is a powerful and widely used library in Python for data visualization. It offers a variety of plotting functions to create complex graphs and charts. One common visualization is a heatmap, which often includes a color bar to indicate the scale of values represented by colors. Adjusting t
4 min read
How to re-size Choropleth maps - Python
In this article, we are going to learn how to create resizable maps using different libraries in Python. Choropleth maps are a type of thematic map that displays divided regions or territories shaded or patterned in relation to a specific data variable. In Python, choropleth maps can be created usin
3 min read