How to Plot a Smooth Curve in Matplotlib?
Last Updated :
31 May, 2025
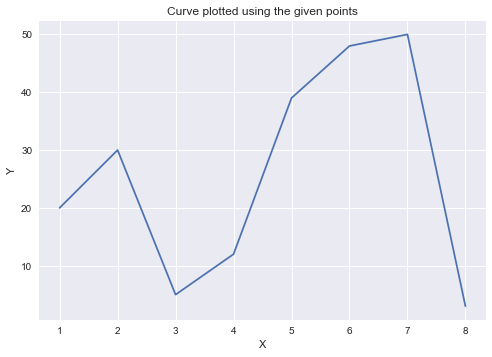
Many times, we have line plots generated from lists of data that are quite scattered which makes graphs seem like straight lines connecting dots or quite dense which leads to the data points being extremely close to each other and hence the plot looks cluttered. The matplotlib.pyplot.plot() function by default produces a curve by joining two adjacent points in the data with a straight line and hence the matplotlib.pyplot.plot() function does not produce a smooth curve for a small range of data points.
Syntax:
sns.heatmap(data, cmap=None, annot=None, linewidths=0, linecolor='white', cbar=True, square=False, **kwargs)
Parameters:
- data: 2D data (e.g., NumPy array or DataFrame) to be represented as a heatmap.
- cmap: Colormap used to assign colors to values.
- annot: If True, writes data values in each cell.
- linewidths: Width of the lines dividing cells.
- linecolor: Color of the dividing lines between cells.
- cbar: Whether to display the color bar.
- square: If True, makes the cells square-shaped.
Returns: It returns a matplotlib Axes object with the smoothed heatmap drawn on it.
Let see an example: We will use the tips dataset which is an inbuilt dataset. This dataset contains information about restaurant tips, total bill amount, tip amount, customer details like sex and day of the week etc. Also, we will be using Seaborn and Matplotlib libraries for this.
Python
import numpy as np
import matplotlib.pyplot as plt

# Dataset
x = np.array([ 1,  2,  3,  4,  5,  6,  7, 8 ])
y = np.array([ 20, 30, 5, 12, 39, 48, 50, 3 ])

# Plotting the Graph
plt.plot(x, y)
plt.title("Curve plotted using the given points")
plt.xlabel("X")
plt.ylabel("Y")
plt.show()
Output:
Example 1: Smooth Spline Curve with PyPlot:
We draw a smooth spline curve using scipy.interpolate.make_interp_spline(), which fits a smooth curve through the given data points. To make the curve appear smooth, we generate many closely spaced x-values using np.linspace(), which creates evenly spaced numbers in a range. By setting the num parameter to a high value like 500, we get a smooth curve between the minimum and maximum x-values.
Syntax:
numpy.linspace(start, stop, num = 50, endpoint = True, retstep = False, dtype = None, axis = 0)
X_Y_Spline = scipy.interpolate.make_interp_spline(x, y)
Parameters:
- start, stop: The starting and ending values of the sequence.
- num: Number of samples to generate (default is 50). A higher number results in a smoother curve.
- endpoint: If True (default), stop is the last sample; otherwise, it is not included.
- retstep: If True, return (samples, step), where step is the spacing between samples.
- dtype: The data type of the output array.
- axis: The axis in the result along which the linspace samples are stored.
Returns:
- np.linspace() returns a NumPy array of evenly spaced values.
- make_interp_spline() returns a callable spline function that can be used to evaluate smooth y-values from new x-values.
Example:
Python
import numpy as np

from scipy.interpolate import make_interp_spline
import matplotlib.pyplot as plt

# Dataset
x = np.array([1, 2, 3, 4, 5, 6, 7, 8])
y = np.array([20, 30, 5, 12, 39, 48, 50, 3])

X_Y_Spline = make_interp_spline(x, y)

# Returns evenly spaced numbers
# over a specified interval.
X_ = np.linspace(x.min(), x.max(), 500)
Y_ = X_Y_Spline(X_)


plt.plot(X_, Y_)
plt.title("Plot Smooth Curve Using the scipy.interpolate.make_interp_spline() Class")
plt.xlabel("X")
plt.ylabel("Y")
plt.show()
Output:
 Smooth Curve
Example 2: Spline Curve Using Cubic Interpolation
It generates a cubic interpolation curve using the scipy.interpolate.interp1d class and then we use the curve to determine the y-values for closely spaced x-values for a smooth curve. Here also we will be using np.linspace() method which returns evenly spaced samples, calculated over a specified interval. Let's take 500 equally spaced samples between min and max values along the X-axis to plot the curve. Depending on how curved you want the line to be, you can modify the value for the third(num) parameter.
Syntax:
numpy.linspace(start, stop, num = 50, endpoint = True, retstep = False, dtype = None, axis = 0)
X_Y_Spline = scipy.interpolate.make_interp_spline(x, y)
Parameters:
- start, stop: Range of values for which samples are needed.
- num: Number of samples. Higher values create smoother curves.
- endpoint: If True, includes the stop value.
- kind: Type of interpolation. "cubic" fits a cubic spline curve.
- x, y: Input data points used for interpolation.
Returns:
- np.linspace() returns a NumPy array of evenly spaced values.
- interp1d() returns an interpolation function which can be used to compute y-values for any x within the original range.
Example:
Python
import numpy as np
from scipy.interpolate import interp1d
import matplotlib.pyplot as plt

# Dataset
x=np.array([1, 2, 3, 4, 5, 6, 7, 8])
y=np.array([20, 30, 5, 12, 39, 48, 50, 3])

cubic_interpolation_model = interp1d(x, y, kind = "cubic")

# Plotting the Graph
X_=np.linspace(x.min(), x.max(), 500)
Y_=cubic_interpolation_model(X_)

plt.plot(X_, Y_)
plt.title("Plot Smooth Curve Using the scipy.interpolate.interp1d Class")
plt.xlabel("X")
plt.ylabel("Y")
plt.show()
Output:
 Smooth Curve
Similar Reads
How to plot a simple vector field in Matplotlib ?
The quantity incorporating both magnitude and direction is known as Vectors. In simple words, we can say, Vector Field is an engagement or collaboration of such vectors in a subset of space. Vector fields are the key aspects of understanding our real-life surrounding. For more intuition, you can thi
3 min read
How to update a plot in Matplotlib?
In this article, let's discuss how to update a plot in Matplotlib. Updating a plot simply means plotting the data, then clearing the existing plot, and then again plotting the updated data and all these steps are performed in a loop. Functions Used:canvas.draw(): It is used to update a figure that
1 min read
How to Change the Size of Figures in Matplotlib?
Matplotlib provides a default figure size of 6.4 inches in width and 4.8 inches in height. While this is suitable for basic graphs, various situations may require resizing figures for better visualization, presentation or publication. This article explores multiple methods to adjust the figure size
3 min read
matplotlib.pyplot.arrow() in Python
Matplotlib is a very powerful plotting library Python, widely used for data visualization and statistical analysis. One of its useful functions is arrow(), which lets you add arrows to your plots to highlight or point out specific data points or trends. This article explains how to use the arrow() f
2 min read
How to Add an Average Line to Plot in Matplotlib
In this article, we will learn how we can add an average line to a plot in matplotlib. We will discuss the steps to add a horizontal average line using the axhline function, as well as the steps to add a vertical average line using the axvline function in Matplotlib. Throughout the article, we will
5 min read
How to plot a dashed line in matplotlib?
Matplotlib is used to create visualizations and plotting dashed lines is used to enhance the style and readability of graphs. A dashed line can represent trends, relationships or boundaries in data. Below we will explore how to plot and customize dashed lines using Matplotlib. To plot dashed line:Sy
2 min read
Matplotlib.pyplot.acorr() in Python
Matplotlib is a library in Python and it is numerical - mathematical extension for NumPy library. Pyplot is a state-based interface to a Matplotlib module which provides a MATLAB-like interface. matplotlib.pyplot.acorr() Function The acorr() function in pyplot module of matplotlib library is used to
2 min read
matplotlib.pyplot.figure() in Python
Matplotlib is a library in Python and it is numerical - mathematical extension for NumPy library. Pyplot is a state-based interface to a Matplotlib module which provides a MATLAB-like interface. There are various plots which can be used in Pyplot are Line Plot, Contour, Histogram, Scatter, 3D Plot,
2 min read
matplotlib.pyplot.imshow() in Python
matplotlib.pyplot.imshow() function in Python is used to display images in a plot. It is part of the matplotlib library and allows you to visualize images as 2D data. This function is widely used for displaying images, matrices, or heatmaps where each value in the array corresponds to a color. Examp
5 min read
How to Create Subplots in Matplotlib with Python?
Matplotlib is a widely used data visualization library in Python that provides powerful tools for creating a variety of plots. One of the most useful features of Matplotlib is its ability to create multiple subplots within a single figure using the plt.subplots() method. This allows users to display
6 min read