How to use Azure Stream Analytics for stream processing
Last Updated :
02 Jan, 2024
Azure Stream Analytics is a managed stream processing engine for real-time data analysis from various sources, like devices and applications. It identifies patterns and triggers actions, making it useful for alerts, reporting, and data storage. It can run on Azure IoT Edge for processing data on IoT devices.
Where to use Azure Stream Analytics?
- Streaming ETL pipeline to Azure Storage in Parquet format.
- Event driven applications with Azure SQL Database and Azure Cosmos DB.
- Analyze real-time telemetry streams and logs from applications and IoT devices.
- Real-time dashboarding with Power BI.
- Anomaly detection to detect spikes, dips, and slow positive and negative changes in sensor values.
- Geospatial analytics for fleet management and driverless vehicles.
- Remote monitoring and predictive maintenance of high value assets.
- Clickstream analytics to determine customer behavior.
What are the benefits of Azure Stream Analytics?
- Ease of Use: Easily connect sources and sinks, ingest data from Event Hubs, IoT Hub, and Blob storage. No-code editor simplifies job development and flexible output routing.
- Programmer Productivity: Stream Analytics uses SQL with temporal constraints. Create jobs with developer tools, support CEP, and extend via custom functions.
- Fully Managed: Azure handles infrastructure and updates.
- Cloud or Edge: Run in the cloud for scale or on IoT Edge/Azure Stack for low-latency processing.
- Low Total Cost: Pay only for consumed streaming units, no upfront costs.
- Mission-Critical: Offers reliability, security, compliance, and guarantees exactly-once event processing.
- Reliability: Ensures exactly-once processing, recovery, and high availability.
- Security: Encrypts communications, supports TLS 1.2, and can use Azure Virtual Networks.
- Performance: Processes millions of events with low latencies, scalability via partitioning, powered by Trill engine.
In this article, we perform the following steps to demonstrate how to use Azure Stream Analytics for processing data stream (here from an IoT device)
- Create an IoT Hub: In the Azure portal, create an IoT Hub to collect telemetry data from your IoT device.
- Set up an IoT device: Here, we use a browser-based Raspberry Pi simulator.
- Set up Stream Analytics Job: Create a Stream Analytics job that will process the data.
- Create an Output: Add an output to specify where the processed data will be sent. Here, we use Azure Blob Storage.
- Connecting Steam from loT to BLOB with query: Define a SQL query that specifies how data from the IoT Hub will be processed. This includes filtering and aggregation.
- Start the Job: Start the Stream Analytics job.
- Visualize Data: Use Power BI to create a real-time dashboard for visualizing the processed data.
Steps to use Azure Stream Analytics for Stream Processing
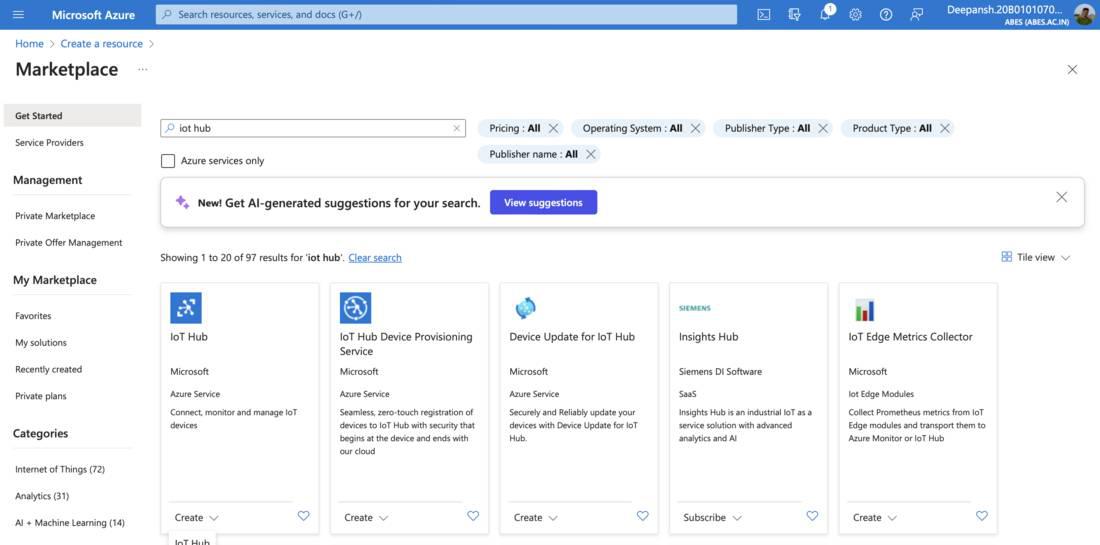
Step 1: Creating an IoT Hub.
- Type in IoT Hub in the search bar. Click on the Create option.
- In the basics tab, fill in the required details
- Subscription: The subscription in which you wish to create the virtual network.
- Resource Group: Choose the resource group where you wish to create the storage account. If you haven’t created one before, click "Create New”. You will be prompted to provide a name for the Resource group. Enter the name and click OK.
- IoT hub name: Provide a name for the IoT Hub.
- Region: Choose the region where you want to create the IoT Hub.

- Click on Review+Create and then click on Create on the next screen.
- After the deployment is complete, click on Go to Resource.
- In the left-hand menu, under Device management, click on Devices and then click Add Device.

- On the Create a Device page, provide a Device ID and click Save.

- Navigate to the newly created IoT Device. Copy and save the Primary Connection String for the next step.

Step 2: Setting up an IoT device.

- Replace the const connectionString with the Primary Connection String you copied in Step 1.

Step 3: Setting up Stream Analytics Job.
- Type in Stream Analytics Job in the search bar. Select Stream Analytics Job. Click Create.
- In the basics tab, fill in the required details
- Subscription, Resource Group, Name, Region.
- Streaming units: Streaming units in Azure Stream Analytics represent the processing capacity allocated to a job, affecting its cost and performance. Price = Streaming Units x Hours Running x Price per hour.
Here, we choose 1.

- Click on Review+Create and then click on Create.
Step 4: Creating an Azure Blob Storage for output.
- Type in Storage Account in the search bar. Select Storage Account. Click Create.
- In the basics tab, fill in the required details.

- Click on Review+Create and then click on Create.
- After the deployment is complete, click on Go to Resource.
- From the left-hand menu, under Data Storage, click on Containers.
- Click on +Container icon. In the pop-up menu, provide a name for the container and click on Create.

Step 5: Connecting Steam from loT to BLOB with query.
- Go to Stream Analytics Job by searching for it using the search bar.
- Select the Stream Analytics Job you created recently.
Adding an Input.
- From the left-hand menu, under Job Topology, select Inputs.
- From the Inputs page, Click on Add Stream Input.
- Choose the type of input from the given options:
- Event Hub
- IoT Hub
- Blob Storage
Here, we choose IoT Hub.

- In the pop-up menu, provide the Input Alias(a name for data source) and Click on Save.

Adding an Output.
- From the left-hand menu, under Job Topology, select Outputs.
- From the Outputs page, Click on Add Output.
- Choose the type of output from the provided options. Here, we choose Blob Storage/ADLS Gen2.

- In the pop-up menu,
- Provide the Output Alias.
- Path Pattern: Specify blob locations using customizable path patterns with date, time, and data column partitions.(Optional) and choose the desired Date Format. Here, we use {date}.
- Event Serialization Format: Specify data serialization format for Stream Analytics queries, typically Parquet with Delta Lake as the default. Here, we choose JSON.
- Click on Save.

Define the SQL Query
- Navigate to Query blade, under Job Topology in the same window.
- Click on Refresh to check if the input stream is working properly.
If you see some data from Raspberry Pi Web Client, that means it is working properly.
- Now, specify the suitable SQL query within the coding interface. Here is an example where we are selecting all the rows from the iotinput and storing them into bloboutput.
Python3
SELECT
    *
INTO
    bloboutput
FROM
    iotinput
- Click on Save and then click on Test Query.

Step 6: Starting the Job.
- Navigate to Stream Analytics Job. Choose the Stream Analytics Job you created.
- From the left-hand menu, Click on Overview.
- Click on Start Job and then click on Start.

- Wait until the Status of the job changes from Starting to Running.

Step 7: Visualizing the Data.
Creating New Output to Power BI.
- Go to Overview blade in the Stream Analytics Job, and click to Stop Job and then click on Yes to stop the running job.
- Under Job Topology, click on Outputs.
- Click on Add Output.
- From the drop-down menu, select Power BI.
- In the pop-up menu, click on Authorize. You'll need to authorize with Power BI to configure your output settings.
- Once done, you will be directed back to Power BI new output menu.
- Provide the desired information such as, Output Alias, Group Workspace, Dataset name and Table name.
- Click on Save.
Adding a New Query.
- Under Job Topology, select Query.
- Add the desired query. An example is given below,
Python3
SELECT
    AVG(temperature) as temperature
INTO
    powerbioutput
FROM
    iotinput
GROUP BY
    TumblingWindow(second, 2)
- Click on Save Query.
- Select the new query and click on Test Selected Query.

Start the Job
- From the left-hand menu, select Overview.
- Click on Start Job and then click on Start.
Visualize Data using Power BI

- Provide a name for the dashboard. Click on Create.
- Click on Edit. Click on Add a Tile.

- In the pop-up menu, under Real-time data, select Custom Streaming Data. Click on Next.
- Select the desired dataset(here, iotdata), under Your Datasets. Click on Next.

- On the next screen, select Visualization Type. Click on Add Value and then select the desired Column.
- Click on Next. Click on Apply.
Note: You can add any number of Tiles with various Visualization Types.
 Visualization of Data
Basic Troubleshooting
- What if the secure connection test fails during input setup?
Delete the input and attempt to add it again. - Unable to Receive Data from the Input Stream? Error Indicates Deserialization Problem.
Potential Causes:- Malformed events: The incoming data may have issues or be improperly formatted.
- Incorrect serialization format configuration for the input source.
Solutions: - Test the incoming data connection. Click on three dots present on right side of your desired input. Click on Test.
- Check the serialization format in the Output blade under Stream Analytics Job.
- Receiving the Message 'You Haven't Configured Diagnostic Settings for This Job Yet' when starting the Job.
You can either disregard the message or set up diagnostic settings in the dedicated pane. - The 'Add Output' button appears to be inactive when attempting to create a new output.
You can't add a new output while the job is already running. Go to Overview and then click on Stop to stop the running job. - I can't find my dataset in PowerBi under the datasets tab.
- Visit the Raspberry Pi Web Simulator to check if the data is still being sent as input to Azure Portal.
- Run the query to see if the output stream is working properly.
Similar Reads
Non-linear Components In electrical circuits, Non-linear Components are electronic devices that need an external power source to operate actively. Non-Linear Components are those that are changed with respect to the voltage and current. Elements that do not follow ohm's law are called Non-linear Components. Non-linear Co
11 min read
Spring Boot Tutorial Spring Boot is a Java framework that makes it easier to create and run Java applications. It simplifies the configuration and setup process, allowing developers to focus more on writing code for their applications. This Spring Boot Tutorial is a comprehensive guide that covers both basic and advance
10 min read
Class Diagram | Unified Modeling Language (UML) A UML class diagram is a visual tool that represents the structure of a system by showing its classes, attributes, methods, and the relationships between them. It helps everyone involved in a project—like developers and designers—understand how the system is organized and how its components interact
12 min read
Steady State Response In this article, we are going to discuss the steady-state response. We will see what is steady state response in Time domain analysis. We will then discuss some of the standard test signals used in finding the response of a response. We also discuss the first-order response for different signals. We
9 min read
Backpropagation in Neural Network Back Propagation is also known as "Backward Propagation of Errors" is a method used to train neural network . Its goal is to reduce the difference between the model’s predicted output and the actual output by adjusting the weights and biases in the network.It works iteratively to adjust weights and
9 min read
Polymorphism in Java Polymorphism in Java is one of the core concepts in object-oriented programming (OOP) that allows objects to behave differently based on their specific class type. The word polymorphism means having many forms, and it comes from the Greek words poly (many) and morph (forms), this means one entity ca
7 min read
3-Phase Inverter An inverter is a fundamental electrical device designed primarily for the conversion of direct current into alternating current . This versatile device , also known as a variable frequency drive , plays a vital role in a wide range of applications , including variable frequency drives and high power
13 min read
What is Vacuum Circuit Breaker? A vacuum circuit breaker is a type of breaker that utilizes a vacuum as the medium to extinguish electrical arcs. Within this circuit breaker, there is a vacuum interrupter that houses the stationary and mobile contacts in a permanently sealed enclosure. When the contacts are separated in a high vac
13 min read
AVL Tree Data Structure An AVL tree defined as a self-balancing Binary Search Tree (BST) where the difference between heights of left and right subtrees for any node cannot be more than one. The absolute difference between the heights of the left subtree and the right subtree for any node is known as the balance factor of
4 min read
What Is Cloud Computing ? Types, Architecture, Examples and Benefits Nowadays, Cloud computing is adopted by every company, whether it is an MNC or a startup many are still migrating towards it because of the cost-cutting, lesser maintenance, and the increased capacity of the data with the help of servers maintained by the cloud providers. Cloud Computing means stori
15 min read