Faster Python Programs Through Optimization by Dr.-Ing Mike Muller
9 likes5,012 views

1) The document discusses several methods for optimizing Python programs to increase speed, including profiling CPU usage with the cProfile module. 2) cProfile can measure the time spent in different functions and identify bottlenecks by running sample programs and printing statistics. 3) Running a "fast" sample that calls a function taking 0.001 seconds 100 times took 0.195 seconds total, with most time spent in the time.sleep calls. A "slow" sample taking 0.1 seconds per call was over 10 seconds total.


![• database access
• calls to system functions
In most cases hardware is cheaper than programmer time. Always
check if there is enough memory for application. Swapping
memory pages to disc may slow down execution by an order of
magnitude. Make sure you have plenty of free disk space and a
recent and fast processor. The Python Cookbook [MART2005],
also available online
1
, is a very good compilation of short and not
so short solutions to specific problems. Some of the recipes,
especially in the algorithm section are applicable to performance
issues.
The Python in a Nutshell book ([MART2006]) contains a good
summary on optimization, including profiling as well as large-scale
and small-scale optimization (see pages 474 to 489). There are](https://image.slidesharecdn.com/fasterpythonprogramsthroughoptimizationmikemuller-140421112429-phpapp01/85/Faster-Python-Programs-Through-Optimization-by-Dr-Ing-Mike-Muller-7-320.jpg)
![two chapters about optimization in [ZIAD2008]. A good resource
for scientific applications in Python is [LANG2006] that also
contains substantial material on optimization and extending of
Python with other languages.
Some of them are exemplified in the following section.
From now on we assume you have done all the above-mentioned
steps and still need more speed.](https://image.slidesharecdn.com/fasterpythonprogramsthroughoptimizationmikemuller-140421112429-phpapp01/85/Faster-Python-Programs-Through-Optimization-by-Dr-Ing-Mike-Muller-8-320.jpg)


!["""
print
print '%10s %10s' % ('seconds', 'kpystones')
print
for seconds in [0.1, 0.5, 1.0, 2.0, 5.0]:
print ('%10.5f %10.5f' % (seconds, kpystone_from_seconds(seconds)))
test()
We will use this function to compare our results.](https://image.slidesharecdn.com/fasterpythonprogramsthroughoptimizationmikemuller-140421112429-phpapp01/85/Faster-Python-Programs-Through-Optimization-by-Dr-Ing-Mike-Muller-14-320.jpg)


![import timeit
def clock_check(duration=1):
"""Check the measured time with different methods.
"""
start_os_time0 = os.times()[0]
start_time_clock = time.clock()
start_default_timer = timeit.default_timer()
for _ in xrange(int(1e6)):
1 + 1
time.sleep(duration)
durtation_os_time0 = os.times()[0] - start_os_time0
durtation_time_clock = time.clock() - start_time_clock
durtation_default_timer = timeit.default_timer() - start_default_timer
print('durtation_os_time0: ', durtation_os_time0)
print('durtation_time_clock: ', durtation_time_clock)
print('durtation_default_timer:', durtation_default_timer)
if __name__ == '__main__':
clock_check()](https://image.slidesharecdn.com/fasterpythonprogramsthroughoptimizationmikemuller-140421112429-phpapp01/85/Faster-Python-Programs-Through-Optimization-by-Dr-Ing-Mike-Muller-28-320.jpg)
![We use three different methods to get time stamps:
1. os.times()[0] provides the CPU time on all operating
systems. While it has six decimals, i.e. microseconds accuracy
on Windows, it is only two significant decimal on Unix-like
systems.
2. start_time_clock = time.clock() is the CPU time on
Unix but wall clock time on Windows.
3. timeit.default_timer() chooses the right timing function
for wall clock, i.e. time.time() on Unix and
time.clock() on windows.
This is our output on Unix/Linux/MacOSX:
durtation_os_time0: 0.05
durtation_time_clock: 0.041949
durtation_default_timer: 1.04296183586](https://image.slidesharecdn.com/fasterpythonprogramsthroughoptimizationmikemuller-140421112429-phpapp01/85/Faster-Python-Programs-Through-Optimization-by-Dr-Ing-Mike-Muller-29-320.jpg)

![if sys.version_info[0] < 3:
range = xrange
After some imports and a Python 2/3 compatibility helper, we
define a function to measure CPU time that is aware of the
differences between operating systems:
def cpu_time():
"""Function for cpu time. Os dependent.
"""
if sys.platform == 'win32':
return os.times()[0]
else:
return time.clock()
We use two functions:
def sleep():
"""Wait 2 seconds.](https://image.slidesharecdn.com/fasterpythonprogramsthroughoptimizationmikemuller-140421112429-phpapp01/85/Faster-Python-Programs-Through-Optimization-by-Dr-Ing-Mike-Muller-31-320.jpg)


![This shows us how much time each line used. Our test functions
are very short. Let's create a small function that accumulates the
sums of all elements in a list:
# file accumulate.py
"""Simple test function for line_profiler.
"""
@profile
def accumulate(iterable):
"""Accumulate the intermediate steps in summing all elements.
The result is a list with the length of `iterable`.
The last element is the sum of all elements of `iterable`
>>>accumulate(range(5))
[0, 1, 3, 6, 10]
accumulate(range(10))
[0, 1, 3, 6, 10, 15, 21, 28, 36, 45]
"""
acm = [iterable[0]]](https://image.slidesharecdn.com/fasterpythonprogramsthroughoptimizationmikemuller-140421112429-phpapp01/85/Faster-Python-Programs-Through-Optimization-by-Dr-Ing-Mike-Muller-49-320.jpg)
![for elem in iterable[1:]:
old_value = acm[-1]
new_value = old_value + elem
acm.append(new_value)
return acm
if __name__ == '__main__':
accumulate(range(10))
accumulate(range(100))
Let's look at the output:
$ kernprof.py -l -v accumulate.py
Wrote profile results to accumulate.py.lprof
Timer unit: 1e-06 s
File: accumulate.py
Function: accumulate at line 3
Total time: 0.000425 s](https://image.slidesharecdn.com/fasterpythonprogramsthroughoptimizationmikemuller-140421112429-phpapp01/85/Faster-Python-Programs-Through-Optimization-by-Dr-Ing-Mike-Muller-50-320.jpg)
![Line # Hits Time Per Hit % Time Line Contents
==============================================================
3 @profile
4 def accumulate(iterable):
5 """Accumulate the intermediate steps in summing all elements.
6
7 The result is a list with the lenght of `iterable`.
8 The last elments is the sum of all elements of `ieterable`
9 >>>accumulate(range(5))
10 [0, 1, 3, 6, 10]
11 accumulate(range(10))
12 [0, 1, 3, 6, 10, 15, 21, 28, 36, 45]
13 """
14 2 5 2.5 1.2 acm = [iterable[0]]
15 110 99 0.9 23.3 for elem in iterable[1:]:
16 108 94 0.9 22.1 old_value = acm[-1]
17 108 98 0.9 23.1 new_value = old_value + elem
18 108 127 1.2 29.9 acm.append(new_value)
19 2 2 1.0 0.5 return acm
The algorithm could be written more concisely. In fact, the three
lines inside the loop could be one. But we would like to see how
much each operation takes and therefore spread things over
several lines.
Another example looks at some simple mathematical calculations:](https://image.slidesharecdn.com/fasterpythonprogramsthroughoptimizationmikemuller-140421112429-phpapp01/85/Faster-Python-Programs-Through-Optimization-by-Dr-Ing-Mike-Muller-51-320.jpg)


![>>> h[0]
Partition of a set of 999910 objects. Total size = 11998920 bytes.
Index Count % Size % Cumulative % Kind (class / dict of class)
0 999910 100 11998920 100 11998920 100 int
We can order everything by type:
>>> h.bytype
Partition of a set of 1000746 objects. Total size = 16120804 bytes.
Index Count % Size % Cumulative % Type
0 999910 100 11998920 74 11998920 74 int
1 3 0 4066700 25 16065620 100 list
2 750 0 46536 0 16112156 100 str
3 8 0 4028 0 16116184 100 types.FrameType
4 17 0 2380 0 16118564 100 dict
5 24 0 856 0 16119420 100 tuple
6 16 0 704 0 16120124 100 __builtin__.weakref
7 7 0 280 0 16120404 100 __builtin__.wrapper_descriptor
8 4 0 128 0 16120532 100 guppy.etc.Glue.Interface
9 3 0 120 0 16120652 100 types.MethodType
<3 more rows. Type e.g. '_.more' to view.>](https://image.slidesharecdn.com/fasterpythonprogramsthroughoptimizationmikemuller-140421112429-phpapp01/85/Faster-Python-Programs-Through-Optimization-by-Dr-Ing-Mike-Muller-70-320.jpg)


![def measure_memory(function): #4
"""Decorator to measure memory size.
"""
@functools.wraps(function) #5
def _measure_memory(*args, **kwargs): #6
"""This replaces the function that is to be measured.
"""
measurer = hpy() #7
measurer.setref() #8
inital_memory = measurer.heap().size #9
try:
res = function(*args, **kwargs) #10
return res
finally: #11
memory[function.__name__] = (measurer.heap().size -
inital_memory)
return _measure_memory #12
if __name__ == '__main__':](https://image.slidesharecdn.com/fasterpythonprogramsthroughoptimizationmikemuller-140421112429-phpapp01/85/Faster-Python-Programs-Through-Optimization-by-Dr-Ing-Mike-Muller-73-320.jpg)


![def test():
"""Do some tests with different memory usage patterns.
"""
def make_big(number): #8
"""Function without side effects.
It cleans up all used memory after it returns.
"""
return range(number)
data = [] #9
def grow(number):
"""Function with side effects on global list.
"""
for x in xrange(number):
data.append(x) #10
size = int(1e6)
print 'memory make_big:', check_memory_growth(make_big,
size) #11](https://image.slidesharecdn.com/fasterpythonprogramsthroughoptimizationmikemuller-140421112429-phpapp01/85/Faster-Python-Programs-Through-Optimization-by-Dr-Ing-Mike-Muller-77-320.jpg)


![measurer.diff() #9
try:
res = function(*args, **kwargs) #10
return res
finally: #11
memory[function.__name__] = (measurer.diff())
return _measure_memory #12
if __name__ == '__main__':
@measure_memory #13
def make_big(number):
"""Example function that makes a large list.
"""
return range(number) #14
make_big(int(1e6)) #15
print 'used memory', memory #16](https://image.slidesharecdn.com/fasterpythonprogramsthroughoptimizationmikemuller-140421112429-phpapp01/85/Faster-Python-Programs-Through-Optimization-by-Dr-Ing-Mike-Muller-83-320.jpg)


![data = [] #9
def grow(number):
"""Function with side effects on global list.
"""
for x in xrange(number):
data.append(x) #10
size = int(1e6)
print 'memory make_big:', check_memory_growth(make_big,
size) #11
print 'memory grow:', check_memory_growth(grow, size) #12
test()
After importing pympler.tracker (#1) we define a helper
function that takes the function to be measured, and positional
and keyword arguments that will be handed to this function (#2).
We make an instance of tracker.SummaryTracker (3) and
use a loop (#4) to call measurer.diff() several times and in](https://image.slidesharecdn.com/fasterpythonprogramsthroughoptimizationmikemuller-140421112429-phpapp01/85/Faster-Python-Programs-Through-Optimization-by-Dr-Ing-Mike-Muller-87-320.jpg)

![write a function that takes the length of the list and a function that
is to be used to measure the memory size of an object:
# file: pympler_list_growth.py
"""Measure the size of a list as it grows.
"""
from pympler.asizeof import asizeof, flatsize
def list_mem(length, size_func=flatsize):
"""Measure incremental memory increase of a growing list.
"""
my_list= []
mem = [size_func(my_list)]
for elem in xrange(length):
my_list.append(elem)
mem.append(size_func(my_list))
return mem](https://image.slidesharecdn.com/fasterpythonprogramsthroughoptimizationmikemuller-140421112429-phpapp01/85/Faster-Python-Programs-Through-Optimization-by-Dr-Ing-Mike-Muller-89-320.jpg)
![Now we use this function with three different functions:
pympler.asizeof.flatsize, pympler.asizeof.asizeof
and sys.getsizeof:
if __name__ == '__main__':
SIZE = 1000
SHOW = 20
import sys
for func in [flatsize, asizeof, sys.getsizeof]:
mem = list_mem(SIZE, size_func=func)
try:
from matplotlib import pylab
pylab.plot(mem)
pylab.show()
except ImportError:
print 'matplotlib seems not be installed. Skipping the plot.'
if SIZE > SHOW:
limit = SHOW / 2
print mem[:limit], '... skipping %d elements ...' % (SIZE - SHOW),
print mem[-limit:]](https://image.slidesharecdn.com/fasterpythonprogramsthroughoptimizationmikemuller-140421112429-phpapp01/85/Faster-Python-Programs-Through-Optimization-by-Dr-Ing-Mike-Muller-90-320.jpg)


![For more complex cases pympler.asizeof.flatsize might
give different results.
We can also measure the number of allocation steps it takes when
a list grows one element at a time:
# file: list_alloc_steps.py
"""Measure the number of memory allocation steps for a list.
"""
import sys
from pympler.asizeof import flatsize
def list_steps(lenght, size_func=sys.getsizeof):
"""Measure the number of memory alloaction steps for a list.
"""
my_list = []
steps = 0](https://image.slidesharecdn.com/fasterpythonprogramsthroughoptimizationmikemuller-140421112429-phpapp01/85/Faster-Python-Programs-Through-Optimization-by-Dr-Ing-Mike-Muller-97-320.jpg)
![int_size = size_func(int())
old_size = size_func(my_list)
for elem in xrange(lenght):
my_list.append(elem)
new_size = sys.getsizeof(my_list)
if new_size - old_size > int_size:
steps += 1
old_size = new_size
return steps
if __name__ == '__main__':
print 'Using sys.getsizeof:'
for size in [10, 100, 1000, 10000, int(1e5), int(1e6), int(1e7)]:
print '%10d: %3d' % (size, list_steps(size))
print 'Using pympler.asizeof.flatsize:'
for size in [10, 100, 1000, 10000, int(1e5), int(1e6), int(1e7)]:
print '%10d: %3d' % (size, list_steps(size, flatsize))
The results are the same for sys.getsizeof and
pympler.asizeof.flatsize:](https://image.slidesharecdn.com/fasterpythonprogramsthroughoptimizationmikemuller-140421112429-phpapp01/85/Faster-Python-Programs-Through-Optimization-by-Dr-Ing-Mike-Muller-98-320.jpg)

![Memory Usage Line-by-Line with memory_profiler
Similarly to line_profiler that profiles CPU usage
line-by-line, memory_profiler measures the memory
line-by-line. We use a small sample code with one function and
decorate it with @profile:
import random
# Make it work with Python 2 and Python 3.
if sys.version_info[0] < 3:
range = xrange
@profile
def use_mem(numbers):
a = sum([x * x for x in numbers])
b = sum(x * x for x in numbers)
c = sum(x * x for x in numbers)
squares = [x * x for x in numbers]](https://image.slidesharecdn.com/fasterpythonprogramsthroughoptimizationmikemuller-140421112429-phpapp01/85/Faster-Python-Programs-Through-Optimization-by-Dr-Ing-Mike-Muller-100-320.jpg)
![d = sum(squares)
del squares
x = 'a' * int(2e8)
del x
return 42
if __name__ == '__main__':
numbers = [random.random() for x in range(int(1e7))]
use_mem(numbers)
Running it from the command line:
$ python -m memory_profiler use_mem.py
for a list one million random numbers:
Line # Mem usage Increment Line Contents
================================================](https://image.slidesharecdn.com/fasterpythonprogramsthroughoptimizationmikemuller-140421112429-phpapp01/85/Faster-Python-Programs-Through-Optimization-by-Dr-Ing-Mike-Muller-101-320.jpg)
![8 @profile
9 33.430 MB 0.000 MB def use_mem(numbers):
10 94.797 MB 61.367 MB a = sum([x * x for x in numbers])
11 94.797 MB 0.000 MB b = sum(x * x for x in numbers)
12 94.797 MB 0.000 MB c = sum(x * x for x in numbers)
13 114.730 MB 19.934 MB squares = [x * x for x in numbers]
14 121.281 MB 6.551 MB d = sum(squares)
15 121.281 MB 0.000 MB del squares
16 312.020 MB 190.738 MB x = 'a' * int(2e8)
17 121.281 MB -190.738 MB del x
18 121.281 MB 0.000 MB return 42
and then for a list ten million random numbers:
Line # Mem usage Increment Line Contents
================================================
8 @profile
9 265.121 MB 0.000 MB def use_mem(numbers):
10 709.500 MB 444.379 MB a = sum([x * x for x in numbers])
11 799.570 MB 90.070 MB b = sum(x * x for x in numbers)
12 798.965 MB -0.605 MB c = sum(x * x for x in numbers)](https://image.slidesharecdn.com/fasterpythonprogramsthroughoptimizationmikemuller-140421112429-phpapp01/85/Faster-Python-Programs-Through-Optimization-by-Dr-Ing-Mike-Muller-102-320.jpg)
![13 806.707 MB 7.742 MB squares = [x * x for x in numbers]
14 972.270 MB 165.562 MB d = sum(squares)
15 976.984 MB 4.715 MB del squares
16 943.906 MB -33.078 MB x = 'a' * int(2e8)
17 871.207 MB -72.699 MB del x
18 871.203 MB -0.004 MB return 42
The result is not as clear as expected. One reason might bet that
it takes time to free memory. Therefore, the effects come later.
In addition to running from the command line you can import the
decorator from memory_profile import profile. You can
also track the memory usage over time. For example, his
measures the usage of the interactive Python interpreter:
>>> from memory_profiler import memory_usage
>>> mem_over_time = memory_usage(-1, interval=0.5, timeout=3)
>>> mem_over_time
[7.453125, 7.4609375, 7.4609375, 7.4609375, 7.4609375, 7.4609375]](https://image.slidesharecdn.com/fasterpythonprogramsthroughoptimizationmikemuller-140421112429-phpapp01/85/Faster-Python-Programs-Through-Optimization-by-Dr-Ing-Mike-Muller-103-320.jpg)


![String Concatenation
Strings in Python are immutable. So if you want to modify a string,
you have to actually create a new one and use parts of the old
one:
>>> s = 'old text'
>>> 'new' + s[-5:]
'new text'
This means that new memory has to be allocated for the string.
This is no problem for a few hundred or thousand strings, but if
you have to deal with millions of strings, memory allocation time
may be considerably longer. The solution in Python is to use a list
to hold the sub strings and join them with ''.join() string
method.](https://image.slidesharecdn.com/fasterpythonprogramsthroughoptimizationmikemuller-140421112429-phpapp01/85/Faster-Python-Programs-Through-Optimization-by-Dr-Ing-Mike-Muller-106-320.jpg)

![List and Generator Comprehensions
Python offers list comprehension as a short and very readable
way to construct a list.
>>> L = [x * x for x in xrange(10)]
>>> L
[0, 1, 4, 9, 16, 25, 36, 49, 64, 81]
is a short form for:
>>> L = []
>>> for x in xrange(10):
... L.append(x * x)
...
>>> L
[0, 1, 4, 9, 16, 25, 36, 49, 64, 81]](https://image.slidesharecdn.com/fasterpythonprogramsthroughoptimizationmikemuller-140421112429-phpapp01/85/Faster-Python-Programs-Through-Optimization-by-Dr-Ing-Mike-Muller-108-320.jpg)


![ratio: 180.783828766
>>> compare_convert_multiple(10, 1000)
ratio: 3.81331204005
Let's assume we have two lists:
>>> list_a = list('abcdefg')
>>> list_a
['a', 'b', 'c', 'd', 'e', 'f', 'g']
>>> list_b = list('fghijklmnopq')
>>> list_b
['f', 'g', 'h', 'i', 'j', 'k', 'l', 'm', 'n', 'o', 'p', 'q']
and we would like to find out which letters are in both lists. A
simple implementation would look like this:
>>> in_both = []
>>> for a in list_a:](https://image.slidesharecdn.com/fasterpythonprogramsthroughoptimizationmikemuller-140421112429-phpapp01/85/Faster-Python-Programs-Through-Optimization-by-Dr-Ing-Mike-Muller-125-320.jpg)
![... if a in list_b:
... in_both.append(a)
>>> in_both
['f', 'g']
This can be achieved in fewer lines and in most cases faster with
sets:
>>> set_a = set(list_a)
>>> set_b = set(list_b)
>>> set_a.intersection(set_b)
set(['g', 'f'])
Following the same method, we write a short performance test.
First we write the function that uses lists:](https://image.slidesharecdn.com/fasterpythonprogramsthroughoptimizationmikemuller-140421112429-phpapp01/85/Faster-Python-Programs-Through-Optimization-by-Dr-Ing-Mike-Muller-126-320.jpg)
![>>> def intersect_list(n):
... list_a = range(n)
... list_b = range(n-3, 2 * n)
... start = timeit.default_timer()
... in_both = []
... for a in list_a:
... if a in list_b:
... in_both.append(a)
... run_time = timeit.default_timer() - start
... return run_time, in_both
...
and check if the results is what we expected:
>>> intersect_list(10)
(1.0189864042331465e-005, [7, 8, 9])
Now, we write a function for sets:](https://image.slidesharecdn.com/fasterpythonprogramsthroughoptimizationmikemuller-140421112429-phpapp01/85/Faster-Python-Programs-Through-Optimization-by-Dr-Ing-Mike-Muller-127-320.jpg)
![>>> def intersect_set(n):
... set_a = set(range(n))
... set_b = set(range(n-3, 2 * n))
... start = timeit.default_timer()
... in_both = set_a.intersection(set_b)
... run_time = timeit.default_timer() - start
... return run_time, in_both
...
We are faster but the result of the intersection is the same:
>>> intersect_set(10)
(4.0926115616457537e-006, set([8, 9, 7]))
Finally, we write a comparison function in which we assert that
both results are the same, and calculate the run time ratios.
>>> def compare_intersect(n):
... list_time, list_result = intersect_list(n)](https://image.slidesharecdn.com/fasterpythonprogramsthroughoptimizationmikemuller-140421112429-phpapp01/85/Faster-Python-Programs-Through-Optimization-by-Dr-Ing-Mike-Muller-128-320.jpg)


![speed[function.__name__] = {'time': run_time,
'kstones': kstones} #10
return _profile_speed #11
We need the time module (#1) to measure the elapsed time. We
also import our converter from seconds to pystones (#2). Again,
we use a global dictionary to store our speed profiling results (#3).
The decorator function takes function to be speed tested as
argument (#4). The nested function takes positional and keyword
arguments (#5) that will be supplied to the measured function. We
record a time stamp for the start (#6) and call our function with
arguments (#7). After this, we calculate the run time (#8) and
convert it into kilo pystones (#9). Finally, we store the measured
values in the global dictionary (#10) and return our nested
function (#11).
Now we can use our module at the interactive prompt:](https://image.slidesharecdn.com/fasterpythonprogramsthroughoptimizationmikemuller-140421112429-phpapp01/85/Faster-Python-Programs-Through-Optimization-by-Dr-Ing-Mike-Muller-132-320.jpg)
![>>> import profile_speed
We decorate a function that takes a list and deletes several
elements somewhere in the list by assigning an empty list to the
range to be deleted:
>>> @profile_speed.profile_speed
... def remove_from_list(my_list, start, end):
... my_list[start:end] = []
...
Now we use a deque to do the same:
>>> @profile_speed.profile_speed
... def remove_from_deque(my_deque, start, end):
... my_deque.rotate(-end)
... for counter in range(end - start):
... my_deque.pop()](https://image.slidesharecdn.com/fasterpythonprogramsthroughoptimizationmikemuller-140421112429-phpapp01/85/Faster-Python-Programs-Through-Optimization-by-Dr-Ing-Mike-Muller-133-320.jpg)
![... my_deque.rotate(start)
...
We rotate by -end to move the elements that need to be deleted
to the end, call pop as many times as needed and rotate back by
start.
Let's look at this rotating with a small example: We would like to
achieve this:
>>> L = range(10)
>>> L[2:4] = []
>>> L
[0, 1, 4, 5, 6, 7, 8, 9]
We import deque from the collections module:
>>> from collections import deque](https://image.slidesharecdn.com/fasterpythonprogramsthroughoptimizationmikemuller-140421112429-phpapp01/85/Faster-Python-Programs-Through-Optimization-by-Dr-Ing-Mike-Muller-134-320.jpg)
![make make a deque:
>>> d = deque(range(10))
>>> d
deque([0, 1, 2, 3, 4, 5, 6, 7, 8, 9])
Now we rotate by the negative end index:
>>> d.rotate(-4)
>>> d
deque([4, 5, 6, 7, 8, 9, 0, 1, 2, 3])
We remove the last two elements:
>>> d.pop()
3
>>> d.pop()
2
and rotate back in the desired order:](https://image.slidesharecdn.com/fasterpythonprogramsthroughoptimizationmikemuller-140421112429-phpapp01/85/Faster-Python-Programs-Through-Optimization-by-Dr-Ing-Mike-Muller-135-320.jpg)
![>>> d.rotate(2)
>>> d
deque([0, 1, 4, 5, 6, 7, 8, 9])
Now, let's test the speed of our implementations. We make a large
list:
>>> my_list = range(int(1e6))
We make a decque from our list:
>>> my_deque = deque(my_list)
Now we call both of our decorated functions:
>>> remove_from_list(my_list, 100, 105)
>>> remove_from_deque(my_deque, 100, 105)](https://image.slidesharecdn.com/fasterpythonprogramsthroughoptimizationmikemuller-140421112429-phpapp01/85/Faster-Python-Programs-Through-Optimization-by-Dr-Ing-Mike-Muller-136-320.jpg)
![The speed measuring results are in the global dictionary speed
in profile_speed:
>>> profile_speed.speed['remove_from_list']
{'kstones': 0.05940467108987868, 'time': 0.0015446220713783987}
>>> profile_speed.speed['remove_from_deque']
{'kstones': 0.00090945420190496104, 'time': 2.3647349735256284e-005}
To be able to compare the results better, we calculate the ratio of
both speeds:
>>> (profile_speed.speed['remove_from_list']['kstones'] /
... profile_speed.speed['remove_from_deque']['kstones'])
71.706250305342934
Our deque is considerably faster than our list. But now we
increase the range that is to be deleted:](https://image.slidesharecdn.com/fasterpythonprogramsthroughoptimizationmikemuller-140421112429-phpapp01/85/Faster-Python-Programs-Through-Optimization-by-Dr-Ing-Mike-Muller-137-320.jpg)
![>>> remove_from_list(my_list, 100, 1000)
>>> remove_from_deque(my_deque, 100, 1000)
And get a much smaller gain by using a deque:
>>> (profile_speed.speed['remove_from_list']['kstones'] /
... profile_speed.speed['remove_from_deque']['kstones'])
4.925948467147018
We make the range even larger:
>>> remove_from_list(my_list, 100, 10000)
>>> remove_from_deque(my_deque, 100, 10000)
Our list eventually becomes faster than the deque:
>>> (profile_speed.speed['remove_from_list']['kstones'] /
... profile_speed.speed['remove_from_deque']['kstones'])
0.5219062068409327](https://image.slidesharecdn.com/fasterpythonprogramsthroughoptimizationmikemuller-140421112429-phpapp01/85/Faster-Python-Programs-Through-Optimization-by-Dr-Ing-Mike-Muller-138-320.jpg)

![dict vs. defaultdict
Since Python 2.5 there is new defaultdict in the module
collections. This works similarly to the the defaultdict
method of dictionaries.
Let's assume we want to count how many of each letter are in the
following sentence:
>>> s = 'Some letters appear several times in this text.'
We can do this in the standard way:
>>> d = {}
>>> for key in s:
... d.setdefault(key, 0)
... d[key] += 1
...
>>> d](https://image.slidesharecdn.com/fasterpythonprogramsthroughoptimizationmikemuller-140421112429-phpapp01/85/Faster-Python-Programs-Through-Optimization-by-Dr-Ing-Mike-Muller-140-320.jpg)
![{'a': 3, ' ': 7, 'e': 8, 'i': 3, 's': 4, 'm': 2,
'l': 2, 'o': 1, 'n': 1, 'p': 2, 'S': 1, 'r': 3,
't': 6, 'v': 1, 'x': 1, 'h': 1, '.': 1}
Or we can use the new defaultdict:
>>> dd = collections.defaultdict(int)
>>> for key in s:
... dd[key] += 1
...
>>> dd
defaultdict(<type 'int'>, {'a': 3, ' ': 7, 'e': 8, 'i': 3, 's': 4, 'm': 2,
'l': 2, 'o': 1, 'n': 1, 'p': 2, 'S': 1, 'r': 3, 't': 6, 'v': 1, 'x': 1,
'h': 1, '.': 1})
>>>
Let's profile the speed differences. First, a function with our
standard dictionary:](https://image.slidesharecdn.com/fasterpythonprogramsthroughoptimizationmikemuller-140421112429-phpapp01/85/Faster-Python-Programs-Through-Optimization-by-Dr-Ing-Mike-Muller-141-320.jpg)
![>>> @profile_speed.profile_speed
... def standard_dict(text):
... d = {}
... for key in text:
... d.setdefault(key, 0)
... d[key] += 1
...
And now one for the defaultdict:
>>> import collections
>>> @profile_speed.profile_speed
... def default_dict(text):
... dd = collections.defaultdict(int)
... for key in text:
... dd[key] += 1
...
We call them both with the same data:](https://image.slidesharecdn.com/fasterpythonprogramsthroughoptimizationmikemuller-140421112429-phpapp01/85/Faster-Python-Programs-Through-Optimization-by-Dr-Ing-Mike-Muller-142-320.jpg)
![>>> standard_dict(s)
>>> default_dict(s)
and compare the results:
>>> (profile_speed.speed['standard_dict']['kstones'] /
profile_speed.speed['default_dict']['kstones'])
1.0524903876080238
There is not much difference between them: Therefore, we
increase the size of our data:
>>> s = 'a' * int(1e6)
>>> standard_dict(s)
>>> default_dict(s)
and get a more than twofold speedup:](https://image.slidesharecdn.com/fasterpythonprogramsthroughoptimizationmikemuller-140421112429-phpapp01/85/Faster-Python-Programs-Through-Optimization-by-Dr-Ing-Mike-Muller-143-320.jpg)
![>>> (profile_speed.speed['standard_dict']['kstones'] /
profile_speed.speed['default_dict']['kstones'])
2.3854284818433915
Let's look at different example from the Python documentation.
We have this data structure:
>>> data = [('yellow', 1), ('blue', 2), ('yellow', 3), ('blue', 4), ('red', 1)]
Our goal is to produce a dictionary that groups all second tuple
entries into a list:
>>> d.items()
[('blue', [2, 4]), ('red', [1]), ('yellow', [1, 3])]
Again, we define a decorated function for the two dictionary
versions:](https://image.slidesharecdn.com/fasterpythonprogramsthroughoptimizationmikemuller-140421112429-phpapp01/85/Faster-Python-Programs-Through-Optimization-by-Dr-Ing-Mike-Muller-144-320.jpg)
![>>> @profile_speed.profile_speed
... def default_dict_group(data):
... dd = collections.defaultdict(list)
... for key, value in data:
... dd[key].append(value)
...
>>> @profile_speed.profile_speed
... def standard_dict_group(data):
... d = {}
... for key, value in data:
... d.setdefault(key, []).append(value)
...
Call them:
>>> default_dict_group(data)
>>> standard_dict_group(data)
and look at the results:](https://image.slidesharecdn.com/fasterpythonprogramsthroughoptimizationmikemuller-140421112429-phpapp01/85/Faster-Python-Programs-Through-Optimization-by-Dr-Ing-Mike-Muller-145-320.jpg)
![>>> (profile_speed.speed['standard_dict_group']['kstones'] /
profile_speed.speed['default_dict_group']['kstones'])
0.69018090107868191
The defaultdict seems to be slower. So let's increase th data
size:
>>> data = data * 10000
>>> standard_dict_group(data)
>>> default_dict_group(data)
Now we are nearly twice as fast:
>>> (profile_speed.speed['standard_dict_group']['kstones'] /
profile_speed.speed['default_dict_group']['kstones'])
1.9115965603608458
Making the data even larger makes things only slightly faster:](https://image.slidesharecdn.com/fasterpythonprogramsthroughoptimizationmikemuller-140421112429-phpapp01/85/Faster-Python-Programs-Through-Optimization-by-Dr-Ing-Mike-Muller-146-320.jpg)
![>>> data = data * 10
>>> standard_dict_group(data)
>>> default_dict_group(data)
>>> (profile_speed.speed['standard_dict_group']['kstones'] /
profile_speed.speed['default_dict_group']['kstones'])
1.9823501285360818
Another increase by a factor of ten actually produces a less
favorable ratio for the defaultdict:
>>> data = data * 10
>>> standard_dict_group(data)
>>> default_dict_group(data)
>>> (profile_speed.speed['standard_dict_group']['kstones'] /
profile_speed.speed['default_dict_group']['kstones'])
1.8241023044794571](https://image.slidesharecdn.com/fasterpythonprogramsthroughoptimizationmikemuller-140421112429-phpapp01/85/Faster-Python-Programs-Through-Optimization-by-Dr-Ing-Mike-Muller-147-320.jpg)
![Big-O notation and Data Structures
Normally, you would want to reduce complexity of your program to
make it faster. One frequently used measure for complexity is the
so called big-O
5
notation. The following table gives an overview
of some notations along with a short description and some
examples from Python.
Notation Description Python Examples
O(1) constant time does not increase
with size of data
len(my_list), len(my_dict),
my_list[i], del my_dict[i], x in dict, x
in set, my_list.append(i)
O(n) linear time increase linearly with
size of data
Loops on list, strings, dicts, sets,
string methods, x in my_list
O(n log n) quasi linear time increases a little
faster than linearly
my_list.sort()
O(n
2
) quadratic time increases four times
for each doubling of data
nested loops](https://image.slidesharecdn.com/fasterpythonprogramsthroughoptimizationmikemuller-140421112429-phpapp01/85/Faster-Python-Programs-Through-Optimization-by-Dr-Ing-Mike-Muller-148-320.jpg)

![O(1) vs. O(n) vs. O(n
2
)
We use our decorator from the module profile_speed:
>>> import profile_speed
We write a function that takes an iterable and reverses it into a list.
Our first implementation uses the method insert to insert every
item at the first position:
>>> @profile_speed.profile_speed
... def use_on(iterable):
... result = []
... for item in iterable:
... result.insert(0, item)
... return result
...](https://image.slidesharecdn.com/fasterpythonprogramsthroughoptimizationmikemuller-140421112429-phpapp01/85/Faster-Python-Programs-Through-Optimization-by-Dr-Ing-Mike-Muller-150-320.jpg)
![Our second implementation uses append and reverse the list
after all items are appended:
>>> @profile_speed.profile_speed
... def use_o1(iterable):
... result = []
... for item in iterable:
... result.append(item)
... result.reverse()
... return result
...
Now we compare both functions in terms for runtime:
>>> def compare_on_o1(n):
... r1 = use_on(range(n))
... r2 = use_o1(range(n))
... assert r1 == r2
... print (profile_speed.speed['use_on']['kstones'] /
... profile_speed.speed['use_o1']['kstones'])](https://image.slidesharecdn.com/fasterpythonprogramsthroughoptimizationmikemuller-140421112429-phpapp01/85/Faster-Python-Programs-Through-Optimization-by-Dr-Ing-Mike-Muller-151-320.jpg)

![our iterable, the first function is O(n + n) but the second is O(n
2
).
Putting this in numbers, we get:
>>> for x in [10, 100, 1000, 10000, 100000, 1000000]:
... print x * x / (x + x)
...
5
50
500
5000
50000
500000
Of course instead of appending to a new list we can just convert
the iterable into a list and reverse it:
>>> @profile_speed.profile_speed
... def use_list(iterable):
... result = list(iterable)
... result.reverse()](https://image.slidesharecdn.com/fasterpythonprogramsthroughoptimizationmikemuller-140421112429-phpapp01/85/Faster-Python-Programs-Through-Optimization-by-Dr-Ing-Mike-Muller-153-320.jpg)
![... return result
...
Now we can compare both implementations that have the same
big-O notation:
>>> def compare_o1_list(n):
... r1 = use_list(range(n))
... r2 = use_o1(range(n))
... assert r1 == r2
... speed = profile_speed.speed
... print (speed['use_o1']['kstones'] /
... speed['use_list']['kstones'])
...
>>> compare_o1_list(10)
1.24255753768
>>> compare_o1_list(100)
4.39513352799
>>> compare_o1_list(1000)](https://image.slidesharecdn.com/fasterpythonprogramsthroughoptimizationmikemuller-140421112429-phpapp01/85/Faster-Python-Programs-Through-Optimization-by-Dr-Ing-Mike-Muller-154-320.jpg)


![All of the following examples are based on [ZIAD2008].](https://image.slidesharecdn.com/fasterpythonprogramsthroughoptimizationmikemuller-140421112429-phpapp01/85/Faster-Python-Programs-Through-Optimization-by-Dr-Ing-Mike-Muller-159-320.jpg)
![Deterministic caching
The first thing we need to do, if we want to cache function results,
is to uniquely identify the function we want to call:
# file: get_key.py
# based on Ziade 2008
"""Generate a unique key for a function and its arguments.
"""
def get_key(function, *args, **kw): #1
"""Make key from module and function names as well as arguments.
"""
key = '%s.%s:' % (function.__module__,
function.__name__) #2
hash_args = [str(arg) for arg in args] #3
hash_kw = ['%s:%s' % (k, str(v))
for k, v in kw.items()] #4
return '%s::%s::%s' % (key, hash_args, hash_kw) #5](https://image.slidesharecdn.com/fasterpythonprogramsthroughoptimizationmikemuller-140421112429-phpapp01/85/Faster-Python-Programs-Through-Optimization-by-Dr-Ing-Mike-Muller-160-320.jpg)

![from get_key import get_key #1
cache = {} #2
def memoize_deterministic(get_key=get_key, cache=cache): #3
"""Parameterized decorator for memoizing.
"""
def _memoize(function): #4
"""This takes the function.
"""
@functools.wraps(function)
def __memoize(*args, **kw): #5
"""This replaces the original function.
"""
key = get_key(function, *args, **kw) #6
try:
return cache[key] #7](https://image.slidesharecdn.com/fasterpythonprogramsthroughoptimizationmikemuller-140421112429-phpapp01/85/Faster-Python-Programs-Through-Optimization-by-Dr-Ing-Mike-Muller-162-320.jpg)
![except KeyError:
value = function(*args, **kw) #8
cache[key] = value #9
return value #10
return __memoize
return _memoize
We use our function get_key (#1) and define a global dictionary
that will be used to store pre-calculated data (#2). Our decorator
takes the function and the dictionary as arguments (#3). This
allows us to use other functions to retrieve a key and other caches
possibly data dictionary-like data stores such as shelve. The
second level function takes the function that is to be called as
argument (#4). The third level function takes the arguments (#5).
Now we retrieve our key (#6) and try to access the result from our
cache (#7). If the key is not in the cache, we call our function /#8),
store the result in the cache (#9) and return the result (#10).](https://image.slidesharecdn.com/fasterpythonprogramsthroughoptimizationmikemuller-140421112429-phpapp01/85/Faster-Python-Programs-Through-Optimization-by-Dr-Ing-Mike-Muller-163-320.jpg)


!["""
def _memoize(function):
"""This takes the function.
"""
@functools.wraps(function)
def __memoize(*args, **kw):
"""This replaces the original function.
"""
key = get_key(function, *args, **kw)
try:
value_age, value = storage[key] #2
deprecated = (age != 0 and
(value_age + age) < time.time()) #3
except KeyError:
deprecated = True #4
if not deprecated:
return value #5
storage[key] = time.time(), function(*args, **kw) #6
return storage[key][1] #7](https://image.slidesharecdn.com/fasterpythonprogramsthroughoptimizationmikemuller-140421112429-phpapp01/85/Faster-Python-Programs-Through-Optimization-by-Dr-Ing-Mike-Muller-167-320.jpg)


![from timeit import Timer #1
def measure_run_time(total, names, number=1): #2
"""Measure the run times of all functions given with `names`.
"""
def timeit_runner(name): #3
"""Time one function.
"""
timer = Timer('%s(total)' % name,
'from __main__ import %sntotal=%d'
% (name, total)) #4
return timer.timeit(number), name #5
results = [] #6
for name in names:
results.append(timeit_runner(name)) #7
results.sort() #8
length = max(len(name) for name in (names)) #9
format1 = '%%-%ds' % length](https://image.slidesharecdn.com/fasterpythonprogramsthroughoptimizationmikemuller-140421112429-phpapp01/85/Faster-Python-Programs-Through-Optimization-by-Dr-Ing-Mike-Muller-181-320.jpg)
![header = (format1 + '%s%10s') % ('Function',
'Time'.center(11), 'Ratio')
print
print header
print '=' * len(header)
for result in results:
ratio = result[0] / results[0][0]
print (format1 + '%9.4f s%10.2f') % (result[1],
result[0], ratio)
if __name__ == '__main__':
import time
def func1(total):
"""Test function that waits for `total` seconds.
"""
time.sleep(total)
def func2(total):
"""Test function that waits for `total` * 2 seconds.
"""](https://image.slidesharecdn.com/fasterpythonprogramsthroughoptimizationmikemuller-140421112429-phpapp01/85/Faster-Python-Programs-Through-Optimization-by-Dr-Ing-Mike-Muller-182-320.jpg)
![time.sleep(total * 2)
def test():
"""Check if it works.
"""
measure_run_time(1, ['func1', 'func2'])
test()
We import the class Timer from the module timeit (#1). The
function measure_run_time takes the number of iterations for
the Monte Carlo calculation n, the names of the functions to run
names and the number of runs. It averages run time speed over
number defaulting to 1 (#2).
Within this function we have the helper function timeit_runner
(#3) that takes only the name of the function. It makes an instance](https://image.slidesharecdn.com/fasterpythonprogramsthroughoptimizationmikemuller-140421112429-phpapp01/85/Faster-Python-Programs-Through-Optimization-by-Dr-Ing-Mike-Muller-183-320.jpg)


![count_inside = 0 #4
for _ in xrange(total): #5
x = random.random() #6
y = random.random() #7
dist = math.sqrt(x * x + y * y) #8
if dist < 1:
count_inside += 1 #9
return 4.0 * count_inside / total #10
if __name__ == '__main__': #11
def test():
"""Check if it works.
"""
print 'pi:', pi_plain(int(1e5)) #12
names = ['pi_plain'] #13
total = int(1e5) #14
repeat = 5 #15
measure_time.measure_run_time(total, names, repeat) #16
test()](https://image.slidesharecdn.com/fasterpythonprogramsthroughoptimizationmikemuller-140421112429-phpapp01/85/Faster-Python-Programs-Through-Optimization-by-Dr-Ing-Mike-Muller-186-320.jpg)


![dist = math.hypot(random.random(), #2
random.random())
if dist < 1:
count_inside += 1
return 4.0 * count_inside / total
if __name__ == '__main__':
import plain_pi
import measure_time
pi_plain = plain_pi.pi_plain
def test():
"""Check if it works.
"""
names = ['pi_plain', 'pi_math']
total = int(1e5)
repeat = 5
measure_time.measure_run_time(total, names, repeat)
test()](https://image.slidesharecdn.com/fasterpythonprogramsthroughoptimizationmikemuller-140421112429-phpapp01/85/Faster-Python-Programs-Through-Optimization-by-Dr-Ing-Mike-Muller-190-320.jpg)


![dist = numpy.sqrt(x * x + y * y) #5
count_inside = len(numpy.where(dist < 1)[0]) #6
return 4.0 * count_inside / total
if __name__ == '__main__':
def test():
"""Time the execution.
"""
import timeit
start = timeit.default_timer()
print 'pi:', pi_numpy(int(1e6))
print 'run time', timeit.default_timer() - start
test()
After we import numpy (#1), we define the function numpy_pi
that again takes the number of iterations as argument total
(#2). The function numpy.random.rand generates an array of
random numbers in the range (0,1). So x and y hold such arrays
(#3, #4). dist is the array of distances computed from x and y](https://image.slidesharecdn.com/fasterpythonprogramsthroughoptimizationmikemuller-140421112429-phpapp01/85/Faster-Python-Programs-Through-Optimization-by-Dr-Ing-Mike-Muller-198-320.jpg)
![(#5). where returns an array with the values for which the
condition dist < 1 is true. Its lenght is the number of hits inside
the circle (#6). The return value is a tuple with one element.
Therefore, we need to index with zero [0].](https://image.slidesharecdn.com/fasterpythonprogramsthroughoptimizationmikemuller-140421112429-phpapp01/85/Faster-Python-Programs-Through-Optimization-by-Dr-Ing-Mike-Muller-199-320.jpg)


![them to other processes.
"""
min_n = total // process_count #7
counters = [min_n] * process_count #8
reminder = total % process_count #9
for count in xrange(reminder): #10
counters[count] += 1 #11
queues_processes = [] #12
for counter in counters: #13
queue = Queue() #14
process = Process(target=count_inside_process,
args=(queue, counter)) #15
process.start() #16
queues_processes.append((queue, process)) #17
inside_count = sum(process[0].get() for process
in queues_processes) #18
for queue_process in queues_processes: #19
queue_process[1].join() #20
return 4 * inside_count / float(total) #21](https://image.slidesharecdn.com/fasterpythonprogramsthroughoptimizationmikemuller-140421112429-phpapp01/85/Faster-Python-Programs-Through-Optimization-by-Dr-Ing-Mike-Muller-205-320.jpg)


![them to other process that run workers
"""
if not workers:
workers = cpu_count() #4
min_n = total // workers
counters = [min_n] * workers
reminder = total % workers
for count in xrange(reminder):
counters[count] += 1
pool = Pool(processes=workers) #5
results = [pool.apply_async(count_inside, (counter,))
for counter in counters] #6
inside_count = sum(result.get() for result in results) #7
return 4 * inside_count / float(total) #8
if __name__ == '__main__':
def test():
"""Check if it works.
"""
workers = 2](https://image.slidesharecdn.com/fasterpythonprogramsthroughoptimizationmikemuller-140421112429-phpapp01/85/Faster-Python-Programs-Through-Optimization-by-Dr-Ing-Mike-Muller-214-320.jpg)


![x = numpy.random.rand(total)
y = numpy.random.rand(total)
dist = numpy.sqrt(x * x + y * y)
return len(numpy.where(dist < 1)[0]) #2
def calc_pi(total):
"""Calcualte pi from the hits inside and the total hits.
"""
return 4 * count_inside(total) / float(total)
def calc_pi_workers_numpy(total, workers=None):
"""Spread the work over several processes.
"""
if not workers:
workers = cpu_count()
min_n = total // workers
counters = [min_n] * workers
reminder = total % workers
for count in xrange(reminder):
counters[count] += 1](https://image.slidesharecdn.com/fasterpythonprogramsthroughoptimizationmikemuller-140421112429-phpapp01/85/Faster-Python-Programs-Through-Optimization-by-Dr-Ing-Mike-Muller-220-320.jpg)
![pool = Pool(processes=workers)
results = [pool.apply_async(count_inside, [counter])
for counter in counters]
inside_count = sum(result.get() for result in results)
return 4 * inside_count / float(total)
if __name__ == '__main__':
def test():
"""Run some performamce tests.
"""
import timeit
workers = 2
total = int(1e3)
print 'number of tries: %2.0e' % total
start = timeit.default_timer()
print 'pi:', calc_pi(total)
no_time = timeit.default_timer() - start
print 'run time no workers:', no_time](https://image.slidesharecdn.com/fasterpythonprogramsthroughoptimizationmikemuller-140421112429-phpapp01/85/Faster-Python-Programs-Through-Optimization-by-Dr-Ing-Mike-Muller-221-320.jpg)


!["""Run all tests that could be found.
"""
total = int(float(sys.argv[1])) #7
repeat = int(sys.argv[2]) #8
names = ['pi_plain', 'pi_math', 'calc_pi_workers'] #9
if has_numpy:
names.extend(['pi_numpy', 'calc_pi_workers_numpy']) #10
if has_psyco:
names.extend(['psyco_pi_plain', 'psyco_pi_math', #11
'psyco_calc_pi_workers'])
if has_numpy:
names.extend(['psyco_pi_numpy',
'psyco_calc_pi_workers_numpy']) #12
measure_time.measure_run_time(total, names, repeat) #13
if __name__ == '__main__':
main()](https://image.slidesharecdn.com/fasterpythonprogramsthroughoptimizationmikemuller-140421112429-phpapp01/85/Faster-Python-Programs-Through-Optimization-by-Dr-Ing-Mike-Muller-225-320.jpg)


Faster Python Programs Through Optimization by Dr.-Ing Mike Muller
- 1. Faster Python Programs through Optimization A Tutorial at PyData London 2014 Februar 21, 2014 London, UK author: Dr.-Ing. Mike Müller email: [email protected] version: 3.1
- 2. How Fast is Fast Enough?
- 3. Introduction Since Python is an interpreted language, some types of computations are slower in Python than in compiled languages. Depending on the application, this may or may not be a problem. This tutorial introduces several methods to speed up Python. Before starting to optimize, however the cost involved should be considered. Optimized code may need more effort to develop and maintain, leading to prolonged development time. So there is always a balance between speed of development and speed of program execution.
- 4. Optimization Guidelines Premature optimization is the root of all evil. C. A. R. Hoare (often misattributed to D. Knuth) Before you start thinking about optimization make sure your program works correctly. Never optimize before the program produces the desired results. Optimization often comes with a price: It tends to make your code less readable. Since most of the programming time for software is spent on maintenance rather than developing new code, readability and maintainability is of great importance for an effective life cycle of your program. Therefore, always think twice if it is really worth before you make your code less readable the speed gain. After all, we deliberately choose Python for its
- 5. excellent readability and pay with somewhat slower programs for certain tasks. A few general guidelines are formulated as follows: 1. Make sure your program is really too slow. Do you really need more performance? Are there any other slowdown factors such as network traffic or user input that have more impact on speed? Does it hurt if the program runs slowly? 2. Don't optimize as you go. Don't waste time before you are certain that you will need the additional speed. 3. Only realistic use cases and user experience should be considered. 4. Architecture can be essential for performance. Is it appropriate?
- 6. 5. Are there any bugs that slow down the program? 6. If the program is really too slow, find the bottlenecks by profiling (use module profile). 7. Always check the result of optimization with all unit tests. Don't optimize with bugs. Usually for complex programs, the most performance gain can be achieved by optimization of algorithms. Finding what big-O notation an algorithm has is very important to predict performance for large amounts of data. The first thing you should check before making any changes in your program is external causes that may slow down your program. Likely candidates are: • network connections
- 7. • database access • calls to system functions In most cases hardware is cheaper than programmer time. Always check if there is enough memory for application. Swapping memory pages to disc may slow down execution by an order of magnitude. Make sure you have plenty of free disk space and a recent and fast processor. The Python Cookbook [MART2005], also available online 1 , is a very good compilation of short and not so short solutions to specific problems. Some of the recipes, especially in the algorithm section are applicable to performance issues. The Python in a Nutshell book ([MART2006]) contains a good summary on optimization, including profiling as well as large-scale and small-scale optimization (see pages 474 to 489). There are
- 8. two chapters about optimization in [ZIAD2008]. A good resource for scientific applications in Python is [LANG2006] that also contains substantial material on optimization and extending of Python with other languages. Some of them are exemplified in the following section. From now on we assume you have done all the above-mentioned steps and still need more speed.
- 9. Strategy
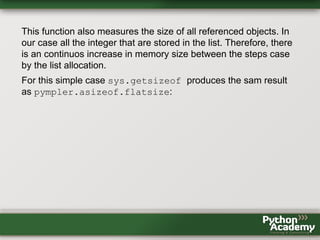
- 10. Measuring in Stones Programs will run at different speeds on different hardware. The use of benchmarks allows to measure how fast your hardware and in the case of Python how fast the used implementation is. Python has the module test.pystone that allows to benchmark hardware and implementation. We can use it as a standalone script: python2.5 ..Python25Libtest>pystone.py Pystone(1.1) time for 50000 passes = 0.840635 This machine benchmarks at 59478.8 pystones/second Python 2.6 is a little bit faster: python2.6 ..Python26Libtest>pystone.py Pystone(1.1) time for 50000 passes = 0.6943 This machine benchmarks at 72015 pystones/second
- 11. Python 2.7 needs a bit longer for this test: python2.7 ..Python27Libtest>pystone.py Pystone(1.1) time for 50000 passes = 0.807359 This machine benchmarks at 61930.3 pystones/second IronPython is faster than CPython for this benchmark: ipy ..Libtestpystone.py Pystone(1.1) time for 50000 passes = 0.459697 This machine benchmarks at 108767 pystones/second PyPy is significantly faster than CPython and IronPython for this benchmark: Pystone(1.1) time for 50000 passes = 0.152618 This machine benchmarks at 327616 pystones/second And repeating the test several times will make it even faster:
- 12. Pystone(1.1) time for 50000 passes = 0.115852 This machine benchmarks at 431583 pystones/second But Jython is much slower: jython2.2 ..Libtestpystone.py Pystone(1.1) time for 50000 passes = 1.359 This machine benchmarks at 36791.8 pystones/second jython2.5 ..Libtestpystone.py Pystone(1.1) time for 50000 passes = 1.37963 This machine benchmarks at 36241.6 pystones/second We can also use pystone in our programs: >>> from test import pystone >>> pystone.pystones() (1.2585885652668103, 39727.04136987008)
- 13. The first value is the benchmark time in seconds and the second the pystones. We can use the pystone value to convert measured run times in seconds into pystones: # file: pystone_converter.py """Convert seconds to kilo pystones.""" from test import pystone BENCHMARK_TIME, PYSTONES = pystone.pystones() def kpystone_from_seconds(seconds): """Convert seconds to kilo pystones.""" return (seconds * PYSTONES) / 1e3 if __name__ == '__main__': def test(): """Show how it works
- 14. """ print print '%10s %10s' % ('seconds', 'kpystones') print for seconds in [0.1, 0.5, 1.0, 2.0, 5.0]: print ('%10.5f %10.5f' % (seconds, kpystone_from_seconds(seconds))) test() We will use this function to compare our results.
- 15. Profiling CPU Usage There are three modules in the Python standard library that allow measuring the used CPU time: • profile • hotshot and • cProfile Because profile is a pure Python implementation and hotshot might be removed in a future version of Python, cProfile is the recommended tool. It is part of the standard library for version 2.5 onwards. All three profilers are deterministic and therefore actually run the code they are profiling and measure its execution time. This has some overhead but provides reliable results in most cases. cProfile tries to minimize this overhead.
- 16. Since Python works with the interpreter, the overhead is rather small. The other type of profiling is called statistical and uses random sampling of the effective instruction pointer. This has less overhead but is also less precise. We won't look at those techniques. Let's write a small program whose whole purpose is to use up CPU time: # file profile_me.py """Example to be profiled. """ import time def fast(): """Wait 0.001 seconds.
- 17. """ time.sleep(1e-3) def slow(): """Wait 0.1 seconds. """ time.sleep(0.1) def use_fast(): """Call `fast` 100 times. """ for _ in xrange(100): fast() def use_slow(): """Call `slow` 100 times. """ for _ in xrange(100): slow()
- 18. if __name__ == '__main__': use_fast() use_slow() Now we import our module as well as cProfile: >>> import profile_me >>> import cProfile and make an instance of Profile: >>> profiler = cProfile.Profile() First we call our fast function: >>> profiler.runcall(profile_me.use_fast)
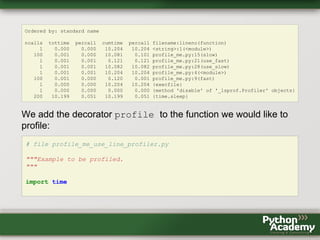
- 19. and look at the statistics cProfile provides: >>> profiler.print_stats() 202 function calls in 0.195 CPU seconds Ordered by: standard name ncalls tottime percall cumtime percall filename:lineno(function) 100 0.000 0.000 0.195 0.002 profile_me.py:3(fast) 1 0.000 0.000 0.195 0.195 profile_me.py:9(use_fast) 1 0.000 0.000 0.000 0.000 ~:0(<method 'disable' of ' _lsprof.Profiler' objects>) 100 0.194 0.002 0.194 0.002 ~:0(<time.sleep>) The column headers have the following meaning: • ncalls is the number of calls to this function • tottime is the total time spent in this function, where calls to sub-functions are excluded from time measurement • percall is tottime divided by ncalls
- 20. • cumtime is the cumulative time, that is the total time spent in this including the time spent in sub-functions • percall is cumtime divided by ncalls • filename:lineno(function) are the name of the module, the line number and the name of the function We can see that the function fast is called 100 times and that it takes about 0.002 seconds per call. At first look it is surprising that tottme is zero. But if we look at the time the function time.sleep uses up, it becomes clear the fast spends only 0.001 seconds (0.195 - 0.194 seconds) and the rest of the time is burnt in time.sleep(). We can do the same thing for our slow function:
- 21. >>> profiler = cProfile.Profile() >>> profiler.runcall(profile_me.use_slow) >>> profiler.print_stats() 202 function calls in 10.058 CPU seconds Ordered by: standard name ncalls tottime percall cumtime percall filename:lineno(function) 1 0.001 0.001 10.058 10.058 profile_me.py:13(use_slow) 100 0.001 0.000 10.058 0.101 profile_me.py:6(slow) 1 0.000 0.000 0.000 0.000 ~:0(<method 'disable' of '_lsprof.Profiler' objects>) 100 10.057 0.101 10.057 0.101 ~:0(<time.sleep>) Not surprisingly, the run times are nearly two orders of magnitude greater, because we let sleep use up one hundred times more time. Another method to invoke the profiler is to use the function run: >>> cProfile.run('profile_me.use_fast()') 203 function calls in 0.195 CPU seconds
- 22. Ordered by: standard name ncalls tottime percall cumtime percall filename:lineno(function) 1 0.000 0.000 0.195 0.195 <string>:1(<module>) 100 0.000 0.000 0.195 0.002 profile_me.py:3(fast) 1 0.000 0.000 0.195 0.195 profile_me.py:9(use_fast) 1 0.000 0.000 0.000 0.000 ~:0(<method 'disable' of '_lsprof.Profiler' objects>) 100 0.195 0.002 0.195 0.002 ~:0(<time.sleep>) Here we supply the function to be called as a string with parenthesis, i.e. a string that can be used in an exec statement as opposed to the function object we supplied to the runcall method of our Profile instance. We can also supply a file where the measured runtime data will be stored: >>> cProfile.run('profile_me.use_fast()', 'fast.stats')
- 23. Now we can use the pstats module to analyze these data: >>> cProfile.run('profile_me.use_fast()', 'fast.stats') >>> import pstats >>> stats = pstats.Stats('fast.stats') We can just print out the data in the same format we saw before: >>> stats.print_stats() Wed Mar 11 16:11:39 2009 fast.stats 203 function calls in 0.195 CPU seconds Random listing order was used ncalls tottime percall cumtime percall filename:lineno(function) 100 0.194 0.002 0.194 0.002 ~:0(<time.sleep>) 1 0.000 0.000 0.000 0.000 ~:0(<method 'disable' of '_lsprof.Profiler' objects>) 100 0.000 0.000 0.195 0.002 profile_me.py:3(fast) 1 0.000 0.000 0.195 0.195 <string>:1(<module>) 1 0.000 0.000 0.195 0.195 profile_me.py:9(use_fast)
- 24. We can also sort by different columns and restrict the number of lines printed out. Here we sort by the number of calls and want to see only the first three columns: >>> stats.sort_stats('calls').print_stats(3) Wed Mar 11 16:11:39 2009 fast.stats 203 function calls in 0.195 CPU seconds Ordered by: call count List reduced from 5 to 3 due to restriction <3> ncalls tottime percall cumtime percall filename:lineno(function) 100 0.194 0.002 0.194 0.002 ~:0(<time.sleep>) 100 0.000 0.000 0.195 0.002 profile_me.py:3(fast) 1 0.000 0.000 0.000 0.000 ~:0(<method 'disable' of '_lsprof.Profiler' objects>) Or we sort by time used and show all lines: >>> stats.sort_stats('time').print_stats() Wed Mar 11 16:11:39 2009 fast.stats 203 function calls in 0.195 CPU seconds
- 25. Ordered by: internal time ncalls tottime percall cumtime percall filename:lineno(function) 100 0.194 0.002 0.194 0.002 ~:0(<time.sleep>) 100 0.000 0.000 0.195 0.002 profile_me.py:3(fast) 1 0.000 0.000 0.195 0.195 profile_me.py:9(use_fast) 1 0.000 0.000 0.195 0.195 <string>:1(<module>) 1 0.000 0.000 0.000 0.000 ~:0(<method 'disable' of '_lsprof.Profiler' objects>) We can also get information about which function is called by a certain function: >>> stats.print_callers('fast') Ordered by: internal time List reduced from 5 to 2 due to restriction <'fast'> Function was called by... profile_me.py:3(fast) profile_me.py:9(use_fast) ((100, 100, 0.00040628818660897912, 0 .19478914258667296)) 0.195 profile_me.py:9(use_fast) <string>:1(<module>) ((1, 1, 0.00026121123840443721, 0.1950503538250774)) 0.195
- 26. We can also find out what functions are called: >>> stats.print_callees('use_fast') Ordered by: internal time List reduced from 5 to 1 due to restriction <'use_fast'> Function called... profile_me.py:9(use_fast) profile_me.py:3(fast) ((100, 100, 0.00040628818660897912, 0.19478914258667296)) 0.195 There are more interesting attributes such as the number of calls: >>> stats.total_calls 203
- 27. Wall Clock vs. CPU Time Per default cProfile measures wall clock time, i.e. the time elapsed between start and end of the function. Since typically computers do more than one thing at a time, this times usually does not correspond with the usage time of the CPU. Also, often computers often wait for IO. During this time the CPU is more or less idle but the time elapses nevertheless. Unfortunately, there are differences between operating systems in how they measure CPU time. Let's look at a simple test function: """Checking different timing functions. """ from __future__ import print_function import os import time
- 28. import timeit def clock_check(duration=1): """Check the measured time with different methods. """ start_os_time0 = os.times()[0] start_time_clock = time.clock() start_default_timer = timeit.default_timer() for _ in xrange(int(1e6)): 1 + 1 time.sleep(duration) durtation_os_time0 = os.times()[0] - start_os_time0 durtation_time_clock = time.clock() - start_time_clock durtation_default_timer = timeit.default_timer() - start_default_timer print('durtation_os_time0: ', durtation_os_time0) print('durtation_time_clock: ', durtation_time_clock) print('durtation_default_timer:', durtation_default_timer) if __name__ == '__main__': clock_check()
- 29. We use three different methods to get time stamps: 1. os.times()[0] provides the CPU time on all operating systems. While it has six decimals, i.e. microseconds accuracy on Windows, it is only two significant decimal on Unix-like systems. 2. start_time_clock = time.clock() is the CPU time on Unix but wall clock time on Windows. 3. timeit.default_timer() chooses the right timing function for wall clock, i.e. time.time() on Unix and time.clock() on windows. This is our output on Unix/Linux/MacOSX: durtation_os_time0: 0.05 durtation_time_clock: 0.041949 durtation_default_timer: 1.04296183586
- 30. and on Windows: durtation_os_time0: 0.03125 durtation_time_clock: 1.02673477293 durtation_default_timer: 1.02673567261 We write a script to look at how cProfile can be used to measure both, wall clock and CPU time: # file: cpu_time.py """Measuring CPU time instead of wall clock time. """ import cProfile import os import sys import time # Make it work with Python 2 and Python 3.
- 31. if sys.version_info[0] < 3: range = xrange After some imports and a Python 2/3 compatibility helper, we define a function to measure CPU time that is aware of the differences between operating systems: def cpu_time(): """Function for cpu time. Os dependent. """ if sys.platform == 'win32': return os.times()[0] else: return time.clock() We use two functions: def sleep(): """Wait 2 seconds.
- 32. """ time.sleep(2) def count(): """100 million loops. """ for _ in range(int(1e8)): 1 + 1 def test(): """Run functions """ sleep() count() One that sleeps and one that just loops many times to consume CPU time. We put them into a test function and use cProfile with different timing methods:
- 33. def profile(): """Profile with wall clock and cpu time. """ profiler = cProfile.Profile() profiler.run('test()') profiler.print_stats() profiler = cProfile.Profile(cpu_time) profiler.run('test()') profiler.print_stats() if __name__ == '__main__': profile() Without providing a time measurement function: profiler = cProfile.Profile(), we get the default wall clock timing. Providing our timer function: cProfile.Profile(cpu_time), we get the CPU time.
- 34. The output on Windows: $ cpu_time.py 6 function calls in 5.233 seconds Ordered by: standard name ncalls tottime percall cumtime percall filename:lineno(function) 1 0.010 0.010 5.233 5.233 <string>:1(<module>) 1 0.000 0.000 2.000 2.000 cpu_time.py:25(sleep) 1 3.222 3.222 3.222 3.222 cpu_time.py:31(count) 1 0.000 0.000 5.222 5.222 cpu_time.py:38(test) 1 0.000 0.000 0.000 0.000 {method 'disable' of '_lsprof.Profiler' objects} 1 2.000 2.000 2.000 2.000 {time.sleep} 6 function calls in 3.141 seconds Ordered by: standard name ncalls tottime percall cumtime percall filename:lineno(function) 1 0.000 0.000 3.141 3.141 <string>:1(<module>) 1 0.000 0.000 0.000 0.000 cpu_time.py:25(sleep) 1 3.141 3.141 3.141 3.141 cpu_time.py:31(count) 1 0.000 0.000 3.141 3.141 cpu_time.py:38(test) 1 0.000 0.000 0.000 0.000 {method 'disable' of '_lsprof.Profiler' objects} 1 0.000 0.000 0.000 0.000 {time.sleep}
- 35. And the output on Unix/Linux/MacOSX: $ python cpu_time.py 6 function calls in 7.171 seconds Ordered by: standard name ncalls tottime percall cumtime percall filename:lineno(function) 1 0.000 0.000 7.171 7.171 <string>:1(<module>) 1 0.000 0.000 2.001 2.001 cpu_time.py:25(sleep) 1 5.169 5.169 5.169 5.169 cpu_time.py:31(count) 1 0.000 0.000 7.171 7.171 cpu_time.py:38(test) 1 0.000 0.000 0.000 0.000 {method 'disable' of '_lsprof.Profiler' objects} 1 2.001 2.001 2.001 2.001 {time.sleep} 6 function calls in 4.360 seconds Ordered by: standard name ncalls tottime percall cumtime percall filename:lineno(function) 1 0.000 0.000 4.360 4.360 <string>:1(<module>) 1 0.000 0.000 0.000 0.000 cpu_time.py:25(sleep) 1 4.360 4.360 4.360 4.360 cpu_time.py:31(count) 1 0.000 0.000 4.360 4.360 cpu_time.py:38(test) 1 0.000 0.000 0.000 0.000 {method 'disable' of '_lsprof.Profiler' objects} 1 0.000 0.000 0.000 0.000 {time.sleep}
- 36. Both seem to correspond. We can also time with Python 3: $ python3 cpu_time.py 7 function calls in 6.223 seconds Ordered by: standard name ncalls tottime percall cumtime percall filename:lineno(function) 1 0.000 0.000 6.223 6.223 <string>:1(<module>) 1 0.000 0.000 2.000 2.000 cpu_time.py:25(sleep) 1 4.223 4.223 4.223 4.223 cpu_time.py:31(count) 1 0.000 0.000 6.223 6.223 cpu_time.py:38(test) 1 0.000 0.000 6.223 6.223 {built-in method exec} 1 2.000 2.000 2.000 2.000 {built-in method sleep} 1 0.000 0.000 0.000 0.000 {method 'disable' of '_lsprof.Profiler' objects} 7 function calls in 4.231 seconds Ordered by: standard name ncalls tottime percall cumtime percall filename:lineno(function)
- 37. 1 0.000 0.000 4.231 4.231 <string>:1(<module>) 1 0.000 0.000 0.000 0.000 cpu_time.py:25(sleep) 1 4.230 4.230 4.230 4.230 cpu_time.py:31(count) 1 0.000 0.000 4.231 4.231 cpu_time.py:38(test) 1 0.000 0.000 4.231 4.231 {built-in method exec} 1 0.000 0.000 0.000 0.000 {built-in method sleep} 1 0.000 0.000 0.000 0.000 {method 'disable' of '_lsprof.Profiler' objects} Conclusion: Always be aware what you are actual measuring. Don't assume to be on particular operating system, try to make your program run cross platform.
- 38. A Picture is Worth a Thousand Words Doing the statistics with tables is worthwhile and interesting. But there is another way to look at the profiling results: making graphs. A very nice tool for this is RunSnakeRun 2 . It is written in Python itself and uses wxPython and SquareMap. The usage is very simple. After installing RunSnakeRun just type: runsnake slow.stats at the command line and you will get nice interactive graphs that should look like this for our slow example:
- 40. Our fast example is not really fast and the graphical view shows a very similar picture
- 42. Later in the course, we will use a simple algorithm to calculate pi (the one from the circle, see chapter "The Example" for more details and the code). This gives a more interesting picture:
- 43. We also will use a NumPy version for this algorithm. Even though our code has about the same number of lines, the graph becomes much more complex because we use NumPy functions:
- 44. Going Line-by-Line With cProfile the finest resolution we get is the function call. But there is line_profiler by Robert Kern that allows line-by-line profiling. line_profiler comesin bundle with kernprof that adds some features to cProfile. Installation is simple: pip install line_profiler We can use kernprof from the command line, which turns just uses cProfile. The option -v shows the statics right away: $ kernprof.py -v profile_me.py Wrote profile results to profile_me.py.prof 406 function calls in 10.204 seconds
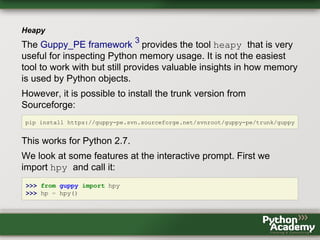
- 45. Ordered by: standard name ncalls tottime percall cumtime percall filename:lineno(function) 1 0.000 0.000 10.204 10.204 <string>:1(<module>) 100 0.001 0.000 10.081 0.101 profile_me.py:15(slow) 1 0.001 0.001 0.121 0.121 profile_me.py:21(use_fast) 1 0.001 0.001 10.082 10.082 profile_me.py:28(use_slow) 1 0.001 0.001 10.204 10.204 profile_me.py:4(<module>) 100 0.001 0.000 0.120 0.001 profile_me.py:9(fast) 1 0.000 0.000 10.204 10.204 {execfile} 1 0.000 0.000 0.000 0.000 {method 'disable' of '_lsprof.Profiler' objects} 200 10.199 0.051 10.199 0.051 {time.sleep} We add the decorator profile to the function we would like to profile: # file profile_me_use_line_profiler.py """Example to be profiled. """ import time
- 46. def fast(): """Wait 0.001 seconds. """ time.sleep(1e-3) def slow(): """Wait 0.1 seconds. """ time.sleep(0.1) @profile def use_fast(): """Call `fast` 100 times. """ for _ in xrange(100): fast() @profile def use_slow(): """Call `slow` 100 times.
- 47. """ for _ in xrange(100): slow() if __name__ == '__main__': use_fast() use_slow() Now we can use the option -l to turn on line_profiler: $ kernprof.py -l -v profile_me_use_line_profiler.py Wrote profile results to profile_me_use_line_profiler.py.lprof Timer unit: 1e-06 s File: profile_me_use_line_profiler.py Function: use_fast at line 20 Total time: 0.120634 s Line # Hits Time Per Hit % Time Line Contents ==============================================================
- 48. 20 @profile 21 def use_fast(): 22 """Call `fast` 100 times. 23 """ 24 101 732 7.2 0.6 for _ in xrange(100): 25 100 119902 1199.0 99.4 fast() File: profile_me_use_line_profiler.py Function: use_slow at line 27 Total time: 10.086 s Line # Hits Time Per Hit % Time Line Contents ============================================================== 27 @profile 28 def use_slow(): 29 """Call `slow` 100 times. 30 """ 31 101 1147 11.4 0.0 for _ in xrange(100): 32 100 10084845 100848.4 100.0 slow()
- 49. This shows us how much time each line used. Our test functions are very short. Let's create a small function that accumulates the sums of all elements in a list: # file accumulate.py """Simple test function for line_profiler. """ @profile def accumulate(iterable): """Accumulate the intermediate steps in summing all elements. The result is a list with the length of `iterable`. The last element is the sum of all elements of `iterable` >>>accumulate(range(5)) [0, 1, 3, 6, 10] accumulate(range(10)) [0, 1, 3, 6, 10, 15, 21, 28, 36, 45] """ acm = [iterable[0]]
- 50. for elem in iterable[1:]: old_value = acm[-1] new_value = old_value + elem acm.append(new_value) return acm if __name__ == '__main__': accumulate(range(10)) accumulate(range(100)) Let's look at the output: $ kernprof.py -l -v accumulate.py Wrote profile results to accumulate.py.lprof Timer unit: 1e-06 s File: accumulate.py Function: accumulate at line 3 Total time: 0.000425 s
- 51. Line # Hits Time Per Hit % Time Line Contents ============================================================== 3 @profile 4 def accumulate(iterable): 5 """Accumulate the intermediate steps in summing all elements. 6 7 The result is a list with the lenght of `iterable`. 8 The last elments is the sum of all elements of `ieterable` 9 >>>accumulate(range(5)) 10 [0, 1, 3, 6, 10] 11 accumulate(range(10)) 12 [0, 1, 3, 6, 10, 15, 21, 28, 36, 45] 13 """ 14 2 5 2.5 1.2 acm = [iterable[0]] 15 110 99 0.9 23.3 for elem in iterable[1:]: 16 108 94 0.9 22.1 old_value = acm[-1] 17 108 98 0.9 23.1 new_value = old_value + elem 18 108 127 1.2 29.9 acm.append(new_value) 19 2 2 1.0 0.5 return acm The algorithm could be written more concisely. In fact, the three lines inside the loop could be one. But we would like to see how much each operation takes and therefore spread things over several lines. Another example looks at some simple mathematical calculations:
- 52. #calc.py """Simple test function for line_profiler doing some math. """ import math @profile def calc(number, loops=1000): """Do some math calculations. """ sqrt = math.sqrt for x in xrange(loops): x = number + 10 x = number * 10 x = number ** 10 x = pow(x, 10) x = math.sqrt(number) x = sqrt(number) math.sqrt sqrt
- 53. if __name__ == '__main__': calc(100, int(1e5)) The output shows which operation takes the most time: $ kernprof.py -l -v calc.py Wrote profile results to calc.py.lprof Timer unit: 1e-06 s File: calc.py Function: calc at line 7 Total time: 1.33158 s Line # Hits Time Per Hit % Time Line Contents ============================================================== 7 @profile 8 def calc(number, loops=1000): 9 """Do some math calculations. 10 """ 11 1 4 4.0 0.0 sqrt = math.sqrt
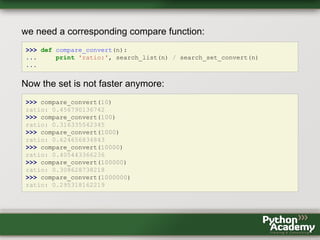
- 54. 12 100001 77315 0.8 5.8 for x in xrange(loops): 13 100000 87124 0.9 6.5 x = number + 10 14 100000 84518 0.8 6.3 x = number * 10 15 100000 330587 3.3 24.8 x = number ** 10 16 100000 378584 3.8 28.4 x = pow(x, 10) 17 100000 109849 1.1 8.2 x = math.sqrt(number) 18 100000 93211 0.9 7.0 x = sqrt(number) 19 100000 88768 0.9 6.7 math.sqrt 20 100000 81624 0.8 6.1 sqrt The function pow takes by far the most time, whereas sqrt from the math module is fast. Note that seem to be no difference between math.sqrt and sqrt, which is just a local reference. Let's look at this in a further example: # local_ref.py """Testing access to local name and name referenced on another module. """ import math
- 55. # If there is no decorator `profile`, make one that just calls the function, # i.e. does nothing. # This allows to call `kernprof` with and without the option `-l` without # commenting or un-commentimg `@profile' all the time. # You can add this to the builtins to make it available in the whole program. try: @profile def dummy(): """Needs to be here to avoid a syntax error. """ pass except NameError: def profile(func): """Will act as the decorator `profile` if it was already found. """ return func def local_ref(counter): """Access local name. """
- 56. # make it local sqrt = math.sqrt for _ in xrange(counter): sqrt def module_ref(counter): """Access name as attribute of another module. """ for _ in xrange(counter): math.sqrt @profile def test(counter): """Call both functions. """ local_ref(counter) module_ref(counter) if __name__ == '__main__': test(int(1e6))
- 57. There are two functions to be line-traced. local_ref gets a local reference to math.sqrt and module_ref calls math.sqrt as it is. We run this with the option -v, and we get: $ kernprof.py -v local_ref.py Wrote profile results to local_ref.py.prof 9 function calls in 14.847 seconds Ordered by: standard name ncalls tottime percall cumtime percall filename:lineno(function) 1 0.000 0.000 14.847 14.847 <string>:1(<module>) 1 0.000 0.000 0.000 0.000 local_ref.py:18(profile) 1 0.001 0.001 14.846 14.846 local_ref.py:2(<module>) 1 0.000 0.000 14.845 14.845 local_ref.py:21(mock) 1 4.752 4.752 4.752 4.752 local_ref.py:28(local_ref) 1 10.093 10.093 10.093 10.093 local_ref.py:37(module_ref) 1 0.000 0.000 14.845 14.845 local_ref.py:44(test) 1 0.001 0.001 14.847 14.847 {execfile}
- 58. 1 0.000 0.000 0.000 0.000 {method 'disable' of '_lsprof.Profiler' objects} This shows that local_ref is more than twice as fast as module_ref because it avoids many lookups on the module math. Now we run it with the options -v -l: $ kernprof.py -v -l local_ref.py Wrote profile results to local_ref.py.lprof Timer unit: 1e-06 s File: local_ref.py Function: dummy at line 12 Total time: 0 s Line # Hits Time Per Hit % Time Line Contents ============================================================== 12 @profile
- 59. 13 def dummy(): 14 """Needs to be here to avoid a syntax error. 15 """ 16 pass File: local_ref.py Function: test at line 44 Total time: 125.934 s Line # Hits Time Per Hit % Time Line Contents ============================================================== 44 @profile 45 def test(counter): 46 """Call both functions. 47 """ 48 1 58162627 58162627.0 46.2 local_ref(counter) 49 1 67771433 67771433.0 53.8 module_ref(counter) This takes much longer. The differences in run times are largely gone. After correspondence with Robert Kern, the author of line_profiler, it turns out that the substantial overhead the
- 60. line tracing adds causes a distortion of measuring results. Conclusion: Use line_profiler for expensive atomic calls such as to a function in an extension module like NumPy.
- 61. Profiling Memory Usage Current computers have lots of RAM, still it can be a problem if an application uses more RAM than is physically available, leading to swapping and a large performance penalty. In particular, long running applications tend to use up more RAM over time. Although Python does automatic memory management, there are cases where memory is not released because there are still references to objects that are no longer needed. We can call the garbage collector manually, but this does not always produce the desired effects.
- 62. Heapy The Guppy_PE framework 3 provides the tool heapy that is very useful for inspecting Python memory usage. It is not the easiest tool to work with but still provides valuable insights in how memory is used by Python objects. However, it is possible to install the trunk version from Sourceforge: pip install https://guppy-pe.svn.sourceforge.net/svnroot/guppy-pe/trunk/guppy This works for Python 2.7. We look at some features at the interactive prompt. First we import hpy and call it: >>> from guppy import hpy >>> hp = hpy()
- 63. Now we can look at the heap: >>> hp.heap() Partition of a set of 55690 objects. Total size = 3848216 bytes. Index Count % Size % Cumulative % Kind (class / dict of class) 0 27680 50 1522412 40 1522412 40 str 1 150 0 666120 17 2188532 57 dict of module 2 10459 19 474800 12 2663332 69 tuple 3 2913 5 186432 5 2849764 74 types.CodeType 4 2814 5 168840 4 3018604 78 function 5 368 1 167488 4 3186092 83 dict (no owner) 6 345 1 151596 4 3337688 87 dict of class 7 145 0 90956 2 3428644 89 dict of type 8 192 0 82156 2 3510800 91 type 9 6310 11 75720 2 3586520 93 int <140 more rows. Type e.g. '_.more' to view.> There are 150 types of objects in our fresh interactive session. 40 % of the memory is taken up by strings and 17 % by module name space dictionaries.
- 64. We create a new object, a list with one million intergers: >>> big_list = range(int(1e6)) and look at our heap again: >>> hp.heap() Partition of a set of 1055602 objects. Total size = 19924092 bytes. Index Count % Size % Cumulative % Kind (class / dict of class) 0 1006210 95 12074520 61 12074520 61 int 1 208 0 4080320 20 16154840 81 list 2 27685 3 1522628 8 17677468 89 str 3 150 0 666120 3 18343588 92 dict of module 4 10458 1 474768 2 18818356 94 tuple 5 2913 0 186432 1 19004788 95 types.CodeType 6 2813 0 168780 1 19173568 96 function 7 374 0 168328 1 19341896 97 dict (no owner) 8 345 0 151596 1 19493492 98 dict of class 9 145 0 90956 0 19584448 98 dict of type <140 more rows. Type e.g. '_.more' to view.>
- 65. Now integers, of which we have one million in our list, take up 61 % of the memory followed by lists that use up 20 %. Strings are down to 8%. We delete our list: >>> del big_list and we are (nearly) back to our initial state: >>> hp.heap() Partition of a set of 55700 objects. Total size = 3861984 bytes. Index Count % Size % Cumulative % Kind (class / dict of class) 0 27685 50 1522632 39 1522632 39 str 1 150 0 666120 17 2188752 57 dict of module 2 10458 19 474768 12 2663520 69 tuple 3 2913 5 186432 5 2849952 74 types.CodeType 4 2813 5 168780 4 3018732 78 function 5 374 1 168328 4 3187060 83 dict (no owner) 6 345 1 151596 4 3338656 86 dict of class 7 145 0 90956 2 3429612 89 dict of type 8 192 0 82156 2 3511768 91 type
- 66. 9 6309 11 75708 2 3587476 93 int <140 more rows. Type e.g. '_.more' to view.> We can tell hp to count only newly added objects with: >>> hp.setref() There are still a few objects, but much fewer than before: >>> hp.heap() Partition of a set of 93 objects. Total size = 8768 bytes. Index Count % Size % Cumulative % Kind (class / dict of class) 0 8 9 4024 46 4024 46 types.FrameType 1 7 8 980 11 5004 57 dict of type 2 16 17 704 8 5708 65 __builtin__.weakref 3 20 22 700 8 6408 73 tuple 4 4 4 560 6 6968 79 dict (no owner) 5 4 4 560 6 7528 86 dict of guppy.etc.Glue.Interface 6 9 10 320 4 7848 90 str 7 7 8 280 3 8128 93 __builtin__.wrapper_descriptor
- 67. 8 1 1 140 2 8268 94 dict of guppy.etc.Glue.Owner 9 4 4 128 1 8396 96 guppy.etc.Glue.Interface <5 more rows. Type e.g. '_.more' to view.> Now we can create our big list again: >>> big_list = range(int(1e6)) The list and the integers in it take up 99 % (74 + 25) of the memory now: >>> hp.heap() Partition of a set of 1000742 objects. Total size = 16120680 bytes. Index Count % Size % Cumulative % Kind (class / dict of class) 0 999908 100 11998896 74 11998896 74 int 1 3 0 4066700 25 16065596 100 list 2 750 0 46532 0 16112128 100 str 3 8 0 4012 0 16116140 100 types.FrameType 4 7 0 980 0 16117120 100 dict of type 5 22 0 776 0 16117896 100 tuple
- 68. 6 16 0 704 0 16118600 100 __builtin__.weakref 7 4 0 560 0 16119160 100 dict (no owner) 8 4 0 560 0 16119720 100 dict of guppy.etc.Glue.Interface 9 7 0 280 0 16120000 100 __builtin__.wrapper_descriptor <8 more rows. Type e.g. '_.more' to view.> Even we have an error of 1 % in our example, it is good enough to find out how memory changes when we do certain things. If we use setref several times in a row, we get slightly different results: >>> h = hp.heap() >>> hp.setref() >>> h.size 16120804 >>> hp.heap().size 5620 >>> big_list = range(int(1e6)) >>> hp.heap().size
- 69. 16067724 >>> hp.setref() >>> hp.heap().size 4824 >>> big_list = range(int(1e6)) >>> hp.heap().size 16066788 >>> hp.setref() >>> hp.heap().size 4768 There is much more information in the heap. Let's look at some of them: >>> h = hp.heap() We can use the index to extract single lines:
- 70. >>> h[0] Partition of a set of 999910 objects. Total size = 11998920 bytes. Index Count % Size % Cumulative % Kind (class / dict of class) 0 999910 100 11998920 100 11998920 100 int We can order everything by type: >>> h.bytype Partition of a set of 1000746 objects. Total size = 16120804 bytes. Index Count % Size % Cumulative % Type 0 999910 100 11998920 74 11998920 74 int 1 3 0 4066700 25 16065620 100 list 2 750 0 46536 0 16112156 100 str 3 8 0 4028 0 16116184 100 types.FrameType 4 17 0 2380 0 16118564 100 dict 5 24 0 856 0 16119420 100 tuple 6 16 0 704 0 16120124 100 __builtin__.weakref 7 7 0 280 0 16120404 100 __builtin__.wrapper_descriptor 8 4 0 128 0 16120532 100 guppy.etc.Glue.Interface 9 3 0 120 0 16120652 100 types.MethodType <3 more rows. Type e.g. '_.more' to view.>
- 71. Since there are only three more lines to display, we use the method more to see all of h content: >>> _.more Index Count % Size % Cumulative % Type 10 2 0 72 0 16120724 100 types.InstanceType 11 1 0 64 0 16120788 100 types.CodeType 12 1 0 16 0 16120804 100 long We can also order by referrers: >>> h.byrcs Partition of a set of 1000746 objects. Total size = 16120804 bytes. Index Count % Size % Cumulative % Referrers by Kind (class / dict of class) 0 1000648 100 12045316 75 12045316 75 list 1 3 0 4063336 25 16108652 100 dict of module 2 27 0 4708 0 16113360 100 <Nothing> 3 6 0 3472 0 16116832 100 tuple 4 21 0 1456 0 16118288 100 type 5 4 0 560 0 16118848 100 guppy.etc.Glue.Interface
- 72. 6 3 0 420 0 16119268 100 dict of guppy.etc.Glue.Owner 7 8 0 352 0 16119620 100 guppy.heapy.heapyc.HeapView 8 7 0 280 0 16119900 100 dict of type 9 7 0 256 0 16120156 100 dict (no owner), dict of guppy.etc.Glue.Interface <9 more rows. Type e.g. '_.more' to view.> Let's look at some examples for how we can use hpy. First we write a decorator that tells us how much memory the result of a function uses: # file: memory_size_hpy.py """Measure the size of used memory with a decorator. """ import functools #1 from guppy import hpy #2 memory = {} #3
- 73. def measure_memory(function): #4 """Decorator to measure memory size. """ @functools.wraps(function) #5 def _measure_memory(*args, **kwargs): #6 """This replaces the function that is to be measured. """ measurer = hpy() #7 measurer.setref() #8 inital_memory = measurer.heap().size #9 try: res = function(*args, **kwargs) #10 return res finally: #11 memory[function.__name__] = (measurer.heap().size - inital_memory) return _measure_memory #12 if __name__ == '__main__':
- 74. @measure_memory #13 def make_big(number): """Example function that makes a large list. """ return range(number) #14 make_big(int(1e6)) #15 print 'used memory', memory #16 First we import functools (#1) that will help us to write a nice decorator. Then we import hpy (#2) and define a global dictionary (#3) that will hold all values for memory. We define a function that takes a function as argument (#4) and another function inside it that takes a variable number of positional and keyword arguments (#6). This is a typical setup of a decorator that takes no arguments (with arguments we would need a third level). We also decorate this function with @functools.wraps (#5)to
- 75. preserve the docstring and the name of the original function after it is decorated. Now we call hpy (#7) and set the measured memory back (#8). We measure our initially used memory (#9) and call the function with the supplied arguments (#10). We always want to have the size of memory after the call (#11). Finally, we return our internally defined function. Note that we store the result of the called function in res. This is necessary to get the memory that is used by the object the function returns. We return our newly created function (#12) We decorate our function (#13) that just returns a list of size number (#14). After we call the function (#15), we can print the used memory (#16).
- 76. When we suspect that a function leaks memory, we can use guppy to measure the memory growth after a function returned: # file memory._growth_hpy.py """Measure the memory growth during a function call. """ from guppy import hpy #1 def check_memory_growth(function, *args, **kwargs): #2 """Measure the memory usage of `function`. """ measurer = hpy() #3 measurer.setref() #4 inital_memory = measurer.heap().size #5 function(*args, **kwargs) #6 return measurer.heap().size - inital_memory #7 if __name__ == '__main__':
- 77. def test(): """Do some tests with different memory usage patterns. """ def make_big(number): #8 """Function without side effects. It cleans up all used memory after it returns. """ return range(number) data = [] #9 def grow(number): """Function with side effects on global list. """ for x in xrange(number): data.append(x) #10 size = int(1e6) print 'memory make_big:', check_memory_growth(make_big, size) #11
- 78. print 'memory grow:', check_memory_growth(grow, size) #12 test() After importing hpy (#1) we define a helper function that takes the function to be measured, and positional and keyword arguments that will be handed to this function (#2). Now we call hpy (3) and set the measured memory back (#4). We measure our initially used memory (#5) and call the function with the supplied arguments (#6). Finally, we return difference in memory size before and after the function call (#7). We define a function that just returns a list (#8) and thus does not increase memory size after it is finished. The size of the returned list is not measured.
- 79. We use a global list as data storage (#9) and define a second function that appends elements to this list (#10). Finally, we call our helper function with both functions as arguments (#11 and #12). Pympler Pympler 4 it is a merge of the formerly independent projects asizeof, heapmonitor, and muppy. It works for Python version 2.4 through 3.2. We can use it very similarly to heapy. Let's start a new interpreter and make an instance of pympler.tracker.SummaryTracker: >>> from pympler import tracker >>> mem_tracker = tracker.SummaryTracker()
- 80. We need to call print_diff() several times to get to the baseline: >>> mem_tracker.print_diff() types | # objects | total size ======================= | =========== | ============ list | 1353 | 138.02 KB str | 1345 | 75.99 KB int | 149 | 3.49 KB dict | 2 | 2.05 KB wrapper_descriptor | 8 | 640 B weakref | 3 | 264 B member_descriptor | 2 | 144 B getset_descriptor | 2 | 144 B function (store_info) | 1 | 120 B cell | 2 | 112 B instancemethod | -1 | -80 B tuple | -1 | -216 B >>> mem_tracker.print_diff() types | # objects | total size ======= | =========== | ============
- 81. str | 2 | 97 B list | 1 | 96 B >>> mem_tracker.print_diff() types | # objects | total size ======= | =========== | ============ Now we create our big list and look at the memory again: >>> big_list = range(int(1e6)) >>> mem_tracker.print_diff() types | # objects | total size ======= | =========== | ============ int | 999861 | 22.89 MB list | 1 | 7.63 MB Let's look at some examples for how we can use pympler. First we write a decorator that tells us how much memory the result of a function uses:
- 82. # file: memory_size_pympler.py """Measure the size of used memory with a decorator. """ import functools #1 from pympler import tracker #2 memory = {} #3 def measure_memory(function): #4 """Decorator to measure memory size. """ @functools.wraps(function) #5 def _measure_memory(*args, **kwargs): #6 """This replaces the function that is to be measured. """ measurer = tracker.SummaryTracker() #7 for _ in xrange(5): #8
- 83. measurer.diff() #9 try: res = function(*args, **kwargs) #10 return res finally: #11 memory[function.__name__] = (measurer.diff()) return _measure_memory #12 if __name__ == '__main__': @measure_memory #13 def make_big(number): """Example function that makes a large list. """ return range(number) #14 make_big(int(1e6)) #15 print 'used memory', memory #16
- 84. First we import functools (#1) that will help us to write a nice decorator. Then we import pympler.tracker (#2) and define a global dictionary (#3) that will hold all values for memory. We define a function that takes a function as argument (#4) and another function inside it that takes a variable number of positional and keyword arguments (#6). This is a typical setup of a decorator that takes no arguments (with arguments we would need a third level). We also decorate this function with @functools.wraps (#5) to preserve the docstring and the name of the original function after it is decorated. Now we make an instance of our tracker (#7). We use a loop (#8) and call tracker.diff() several times (#9). Then we call the function with the supplied arguments (#10). We always want to have the size of memory after the call (#11). Finally, we return our internally defined function. Note that we store the result of the
- 85. called function in res. This is necessary to get the memory that is used by the object the function returns. We return our newly created function (#12) We decorate our function (#13) that just returns a list of size number (#14). After we call the function (#15), we can print the used memory (#16). When we suspect that a function leaks memory, we can use pympler to measure the memory growth after a function returned: # file memory_growth_pympler.py """Measure the memory growth during a function call. """ from pympler import tracker #1
- 86. def check_memory_growth(function, *args, **kwargs): #2 """Measure the memory usage of `function`. """ measurer = tracker.SummaryTracker() #3 for _ in xrange(5): #4 measurer.diff() #5 function(*args, **kwargs) #6 return measurer.diff() #7 if __name__ == '__main__': def test(): """Do some tests with different memory usage patterns. """ def make_big(number): #8 """Function without side effects. It cleans up all used memory after it returns. """ return range(number)
- 87. data = [] #9 def grow(number): """Function with side effects on global list. """ for x in xrange(number): data.append(x) #10 size = int(1e6) print 'memory make_big:', check_memory_growth(make_big, size) #11 print 'memory grow:', check_memory_growth(grow, size) #12 test() After importing pympler.tracker (#1) we define a helper function that takes the function to be measured, and positional and keyword arguments that will be handed to this function (#2). We make an instance of tracker.SummaryTracker (3) and use a loop (#4) to call measurer.diff() several times and in
- 88. this way set the baseline of memory usage (#5). We call the function with the supplied arguments (#6). Finally, we return difference in memory size before and after the function call (#7). We define a function that just returns a list (#8) and thus does not increase memory size after it is finished. The size of the returned list is not measured. We use a global list as data storage (#9) and define a second function that appends elements to this list (#10). Finally, we call our helper function with both functions as arguments (#11 and #12). Pympler offers more tools. Let's look at the possibilities to measure the memory size of a given object. We would like to measure the memory size of a list as we append elements. We
- 89. write a function that takes the length of the list and a function that is to be used to measure the memory size of an object: # file: pympler_list_growth.py """Measure the size of a list as it grows. """ from pympler.asizeof import asizeof, flatsize def list_mem(length, size_func=flatsize): """Measure incremental memory increase of a growing list. """ my_list= [] mem = [size_func(my_list)] for elem in xrange(length): my_list.append(elem) mem.append(size_func(my_list)) return mem
- 90. Now we use this function with three different functions: pympler.asizeof.flatsize, pympler.asizeof.asizeof and sys.getsizeof: if __name__ == '__main__': SIZE = 1000 SHOW = 20 import sys for func in [flatsize, asizeof, sys.getsizeof]: mem = list_mem(SIZE, size_func=func) try: from matplotlib import pylab pylab.plot(mem) pylab.show() except ImportError: print 'matplotlib seems not be installed. Skipping the plot.' if SIZE > SHOW: limit = SHOW / 2 print mem[:limit], '... skipping %d elements ...' % (SIZE - SHOW), print mem[-limit:]
- 91. else: print mem The code just calls our function and supplies one of the functions to measure memory size as an argument. If matloptlib is installed, it draws a graph for each call. Let's look at the resulting graphs. Using pympler.asizeof.flatsize we get this kind of step diagram:
- 93. We can see nicely how the list grows discontinuously. Python allocates more memory than it actually needs to append the next element. This way it can append several elements before it needs to increase its size again. These steps get bigger the bigger the list is. Using pympler.asizeof.asizeof we get a different looking graph:
- 95. This function also measures the size of all referenced objects. In our case all the integer that are stored in the list. Therefore, there is an continuos increase in memory size between the steps case by the list allocation. For this simple case sys.getsizeof produces the sam result as pympler.asizeof.flatsize:
- 97. For more complex cases pympler.asizeof.flatsize might give different results. We can also measure the number of allocation steps it takes when a list grows one element at a time: # file: list_alloc_steps.py """Measure the number of memory allocation steps for a list. """ import sys from pympler.asizeof import flatsize def list_steps(lenght, size_func=sys.getsizeof): """Measure the number of memory alloaction steps for a list. """ my_list = [] steps = 0
- 98. int_size = size_func(int()) old_size = size_func(my_list) for elem in xrange(lenght): my_list.append(elem) new_size = sys.getsizeof(my_list) if new_size - old_size > int_size: steps += 1 old_size = new_size return steps if __name__ == '__main__': print 'Using sys.getsizeof:' for size in [10, 100, 1000, 10000, int(1e5), int(1e6), int(1e7)]: print '%10d: %3d' % (size, list_steps(size)) print 'Using pympler.asizeof.flatsize:' for size in [10, 100, 1000, 10000, int(1e5), int(1e6), int(1e7)]: print '%10d: %3d' % (size, list_steps(size, flatsize)) The results are the same for sys.getsizeof and pympler.asizeof.flatsize:
- 99. Using sys.getsizeof: 10: 3 100: 10 1000: 27 10000: 46 100000: 65 1000000: 85 10000000: 104 Using pympler.asizeof.flatsize: 10: 3 100: 10 1000: 27 10000: 46 100000: 65 1000000: 85 10000000: 104
- 100. Memory Usage Line-by-Line with memory_profiler Similarly to line_profiler that profiles CPU usage line-by-line, memory_profiler measures the memory line-by-line. We use a small sample code with one function and decorate it with @profile: import random # Make it work with Python 2 and Python 3. if sys.version_info[0] < 3: range = xrange @profile def use_mem(numbers): a = sum([x * x for x in numbers]) b = sum(x * x for x in numbers) c = sum(x * x for x in numbers) squares = [x * x for x in numbers]
- 101. d = sum(squares) del squares x = 'a' * int(2e8) del x return 42 if __name__ == '__main__': numbers = [random.random() for x in range(int(1e7))] use_mem(numbers) Running it from the command line: $ python -m memory_profiler use_mem.py for a list one million random numbers: Line # Mem usage Increment Line Contents ================================================
- 102. 8 @profile 9 33.430 MB 0.000 MB def use_mem(numbers): 10 94.797 MB 61.367 MB a = sum([x * x for x in numbers]) 11 94.797 MB 0.000 MB b = sum(x * x for x in numbers) 12 94.797 MB 0.000 MB c = sum(x * x for x in numbers) 13 114.730 MB 19.934 MB squares = [x * x for x in numbers] 14 121.281 MB 6.551 MB d = sum(squares) 15 121.281 MB 0.000 MB del squares 16 312.020 MB 190.738 MB x = 'a' * int(2e8) 17 121.281 MB -190.738 MB del x 18 121.281 MB 0.000 MB return 42 and then for a list ten million random numbers: Line # Mem usage Increment Line Contents ================================================ 8 @profile 9 265.121 MB 0.000 MB def use_mem(numbers): 10 709.500 MB 444.379 MB a = sum([x * x for x in numbers]) 11 799.570 MB 90.070 MB b = sum(x * x for x in numbers) 12 798.965 MB -0.605 MB c = sum(x * x for x in numbers)
- 103. 13 806.707 MB 7.742 MB squares = [x * x for x in numbers] 14 972.270 MB 165.562 MB d = sum(squares) 15 976.984 MB 4.715 MB del squares 16 943.906 MB -33.078 MB x = 'a' * int(2e8) 17 871.207 MB -72.699 MB del x 18 871.203 MB -0.004 MB return 42 The result is not as clear as expected. One reason might bet that it takes time to free memory. Therefore, the effects come later. In addition to running from the command line you can import the decorator from memory_profile import profile. You can also track the memory usage over time. For example, his measures the usage of the interactive Python interpreter: >>> from memory_profiler import memory_usage >>> mem_over_time = memory_usage(-1, interval=0.5, timeout=3) >>> mem_over_time [7.453125, 7.4609375, 7.4609375, 7.4609375, 7.4609375, 7.4609375]
- 104. You can also supply a PID of another process. memory_profiler also comes with a IPython plug-in to be used with the magic function %memit analogous to %timeit.
- 106. String Concatenation Strings in Python are immutable. So if you want to modify a string, you have to actually create a new one and use parts of the old one: >>> s = 'old text' >>> 'new' + s[-5:] 'new text' This means that new memory has to be allocated for the string. This is no problem for a few hundred or thousand strings, but if you have to deal with millions of strings, memory allocation time may be considerably longer. The solution in Python is to use a list to hold the sub strings and join them with ''.join() string method.
- 107. Exercise Write a test program that constructs a very long string (containing up to one million characters). Use the idiom s += 'text' and the idiom text_list.append('text') plus ''.join(text_list) in a function for each. Compare the two approaches in terms of execution speed. Hint: You can use timeit.default_timer() to get the time since the last call to this function. Alternatively, you can use the module timeit or the function measureRunTime which can be found in the examples directory in the subdirectory modules.
- 108. List and Generator Comprehensions Python offers list comprehension as a short and very readable way to construct a list. >>> L = [x * x for x in xrange(10)] >>> L [0, 1, 4, 9, 16, 25, 36, 49, 64, 81] is a short form for: >>> L = [] >>> for x in xrange(10): ... L.append(x * x) ... >>> L [0, 1, 4, 9, 16, 25, 36, 49, 64, 81]
- 109. If you are not interested in the list itself but rather some values computed from the whole list, you can use generator comprehension and avoid the list all together. >>> sum(x * x for x in xrange(10)) 285 Exercise Write a test program that calculates the sum of all squares of the numbers form zero to one million. Use the idiom l.append and list comprehension as well as generator comprehension. Try it with range and xrange. Use different numbers, e.g. smaller and bigger than one million. Hint: You can use timeit.default_timer() to get the time since the last call to this function. Alternatively, you can use the
- 110. module timeit or the function measureRunTime which you can find in the examples directory in the subdirectory modules.
- 111. Think Global buy Local A greta deal of things in Python are dynamic. This includes the lookup of variables. It follows the famous LGB local-global-built-in rule. If a variable name is not found in the local scope, Python looks for it in global and then in the built-in name space before raising an NameError when nothing was found. Since every name space is a dictionary, it involves more look ups the more name spaces have to be searched. Therefore, local variables are faster than global variables. Let's look at an example: # file: local_global.py """Local vs. built-in. """
- 112. GLOBAL = 1 def repeat(counter): """Using the GLOBAL value directly. """ for count in xrange(counter): GLOBAL def repeat_local(counter): """Making GLOBAL a local variable. """ local = GLOBAL for count in xrange(counter): local def test(counter): """Call both functions. """ repeat(counter)
- 113. repeat_local(counter) if __name__ == '__main__': def do_profile(): """Check the run times. """ import cProfile profiler = cProfile.Profile() profiler.run('test(int(1e8))') profiler.print_stats() do_profile() By running this code, we will see that the version that accesses the GLOBAL directly is about 25% slower than the version with the local variable.
- 114. The difference becomes larger when we move more outward and make a built-in name a local one: """Local vs. built-in. """ def repeat(counter): """Using the built-in `True` in a loop. """ for count in xrange(counter): True def repeat_local(counter): """Making `True` a local variable. """ true = True for count in xrange(counter): true
- 115. def test(counter): """Call both functions. """ repeat(counter) repeat_local(counter) if __name__ == '__main__': def do_profile(): """Check the run times. """ import cProfile profiler = cProfile.Profile() profiler.run('test(int(1e8))') profiler.print_stats() do_profile()
- 116. In this example it saves about 40% of the run. So, if you have large loops and you access globals or built-ins frequently, making them local might be quite useful.
- 117. The Right Data Structure
- 118. Use built-in Data Types It is always a good idea to use Python built-in data structures. They are not only most often more elegant and robust than self-made data structures, but also faster in nearly all cases. They are well tested, often partially implemented in C and optimized through long time usage by many of talented programmers. There are essential differences among built-in data types in terms of performance depending on the task.
- 119. list vs. set If you need to search in items, dictionaries and sets are mostly preferable to lists. >>> 9 in range(10) True >>> 9 in set(range(10)) True Let's make a performance test. We define a function that searches in a list: >>> import timeit >>> def search_list(n): ... my_list = range(n) ... start = timeit.default_timer() ... n in my_list ... return timeit.default_timer() - start ...
- 120. and one that searches in a set: >>> def search_set(n): ... my_set = set(range(n)) ... start = timeit.default_timer() ... n in my_set ... return timeit.default_timer() - start ... We define a function that compares both run time: >>> def compare(n): ... print 'ratio:', search_list(n) / search_set(n) ... The set is considerably faster, especially for larger collections: >>> compare(10) ratio: 1.83441560587 >>> compare(100)
- 121. ratio: 4.4749036373 >>> compare(1000) ratio: 21.4793493288 >>> compare(10000) ratio: 203.487480019 >>> compare(100000) ratio: 1048.8407761 We did not measure the time it takes to convert the list into a set. So, let's define a modified function for the set that includes the creation of the set into the runtime measurement: >>> def search_set_convert(n): ... my_list = range(n) ... start = timeit.default_timer() ... my_set = set(my_list) ... n in my_set ... return timeit.default_timer() - start ...
- 122. we need a corresponding compare function: >>> def compare_convert(n): ... print 'ratio:', search_list(n) / search_set_convert(n) ... Now the set is not faster anymore: >>> compare_convert(10) ratio: 0.456790136742 >>> compare_convert(100) ratio: 0.316335542345 >>> compare_convert(1000) ratio: 0.624656834843 >>> compare_convert(10000) ratio: 0.405443366236 >>> compare_convert(100000) ratio: 0.308628738218 >>> compare_convert(1000000) ratio: 0.295318162219
- 123. If we need to search more than once, the overhead for creating the set gets relatively smaller. We write function that searches in our list several times: >>> def search_list_multiple(n, m): ... my_list = range(n) ... start = timeit.default_timer() ... for x in xrange(m): ... n in my_list ... return timeit.default_timer() - start and do the same for our set: >>> def search_set_multiple_convert(n, m): ... my_list = range(n) ... start = timeit.default_timer() ... my_set = set(my_list) ... for x in xrange(m): ... n in my_set ... return timeit.default_timer() - start
- 124. We also need a new compare function: >>> def compare_convert_multiple(n, m): ... print 'ratio:', (search_list_multiple(n, m) / ... search_set_multiple_convert(n, m)) The set gets relatively faster with increasing collection size and number of searches. >>> compare_convert_multiple(10, 1) ratio: 0.774266745907 >>> compare_convert_multiple(10, 10) ratio: 1.17802196759 >>> compare_convert_multiple(100, 10) ratio: 2.99640026716 >>> compare_convert_multiple(100, 100) ratio: 12.1363117596 >>> compare_convert_multiple(1000, 1000) ratio: 39.478349851 >>> compare_convert_multiple(10, 1000)
- 125. ratio: 180.783828766 >>> compare_convert_multiple(10, 1000) ratio: 3.81331204005 Let's assume we have two lists: >>> list_a = list('abcdefg') >>> list_a ['a', 'b', 'c', 'd', 'e', 'f', 'g'] >>> list_b = list('fghijklmnopq') >>> list_b ['f', 'g', 'h', 'i', 'j', 'k', 'l', 'm', 'n', 'o', 'p', 'q'] and we would like to find out which letters are in both lists. A simple implementation would look like this: >>> in_both = [] >>> for a in list_a:
- 126. ... if a in list_b: ... in_both.append(a) >>> in_both ['f', 'g'] This can be achieved in fewer lines and in most cases faster with sets: >>> set_a = set(list_a) >>> set_b = set(list_b) >>> set_a.intersection(set_b) set(['g', 'f']) Following the same method, we write a short performance test. First we write the function that uses lists:
- 127. >>> def intersect_list(n): ... list_a = range(n) ... list_b = range(n-3, 2 * n) ... start = timeit.default_timer() ... in_both = [] ... for a in list_a: ... if a in list_b: ... in_both.append(a) ... run_time = timeit.default_timer() - start ... return run_time, in_both ... and check if the results is what we expected: >>> intersect_list(10) (1.0189864042331465e-005, [7, 8, 9]) Now, we write a function for sets:
- 128. >>> def intersect_set(n): ... set_a = set(range(n)) ... set_b = set(range(n-3, 2 * n)) ... start = timeit.default_timer() ... in_both = set_a.intersection(set_b) ... run_time = timeit.default_timer() - start ... return run_time, in_both ... We are faster but the result of the intersection is the same: >>> intersect_set(10) (4.0926115616457537e-006, set([8, 9, 7])) Finally, we write a comparison function in which we assert that both results are the same, and calculate the run time ratios. >>> def compare_intersect(n): ... list_time, list_result = intersect_list(n)
- 129. ... set_time, set_result = intersect_set(n) ... assert set_result == set(list_result) ... print 'ratio:', list_time / set_time ... Now we can compare both versions with lists and sets: >>> compare_intersect(10) ratio: 2.75475854866 >>> compare_intersect(100) ratio: 49.3294012578 >>> compare_intersect(1000) ratio: 581.103479374 >>> compare_intersect(10000) ratio: 7447.07128383 Note that the problem with the time for constructing the sets is not included here.
- 130. list vs. deque For certain tasks we can use a deque instead of a list. A deque is a doubly linked list. This data structure allows faster insertion into the middle part. On the other hand, access of elements by index is slow. So far we have instrumented our functions we want to test manually with timing code. It is far more elegant to move this timing code into its own, reusable module. In analogy to the decorator we wrote for profiling memory usage, we write one for speed in seconds and kilo stones: # file: profile_speed.py """Profile the run time of a function with a decorator. """ import functools
- 131. import timeit #1 import pystone_converter #2 speed = {} #3 def profile_speed(function): #4 """The decorator. """ @functools.wraps(function) def _profile_speed(*args, **kwargs): #5 """This replaces the original function. """ start = timeit.default_timer() #6 try: return function(*args, **kwargs) #7 finally: # Will be executed *before* the return. run_time = timeit.default_timer() - start #8 #9 kstones = pystone_converter.kpystone_from_seconds(run_time)
- 132. speed[function.__name__] = {'time': run_time, 'kstones': kstones} #10 return _profile_speed #11 We need the time module (#1) to measure the elapsed time. We also import our converter from seconds to pystones (#2). Again, we use a global dictionary to store our speed profiling results (#3). The decorator function takes function to be speed tested as argument (#4). The nested function takes positional and keyword arguments (#5) that will be supplied to the measured function. We record a time stamp for the start (#6) and call our function with arguments (#7). After this, we calculate the run time (#8) and convert it into kilo pystones (#9). Finally, we store the measured values in the global dictionary (#10) and return our nested function (#11). Now we can use our module at the interactive prompt:
- 133. >>> import profile_speed We decorate a function that takes a list and deletes several elements somewhere in the list by assigning an empty list to the range to be deleted: >>> @profile_speed.profile_speed ... def remove_from_list(my_list, start, end): ... my_list[start:end] = [] ... Now we use a deque to do the same: >>> @profile_speed.profile_speed ... def remove_from_deque(my_deque, start, end): ... my_deque.rotate(-end) ... for counter in range(end - start): ... my_deque.pop()
- 134. ... my_deque.rotate(start) ... We rotate by -end to move the elements that need to be deleted to the end, call pop as many times as needed and rotate back by start. Let's look at this rotating with a small example: We would like to achieve this: >>> L = range(10) >>> L[2:4] = [] >>> L [0, 1, 4, 5, 6, 7, 8, 9] We import deque from the collections module: >>> from collections import deque
- 135. make make a deque: >>> d = deque(range(10)) >>> d deque([0, 1, 2, 3, 4, 5, 6, 7, 8, 9]) Now we rotate by the negative end index: >>> d.rotate(-4) >>> d deque([4, 5, 6, 7, 8, 9, 0, 1, 2, 3]) We remove the last two elements: >>> d.pop() 3 >>> d.pop() 2 and rotate back in the desired order:
- 136. >>> d.rotate(2) >>> d deque([0, 1, 4, 5, 6, 7, 8, 9]) Now, let's test the speed of our implementations. We make a large list: >>> my_list = range(int(1e6)) We make a decque from our list: >>> my_deque = deque(my_list) Now we call both of our decorated functions: >>> remove_from_list(my_list, 100, 105) >>> remove_from_deque(my_deque, 100, 105)
- 137. The speed measuring results are in the global dictionary speed in profile_speed: >>> profile_speed.speed['remove_from_list'] {'kstones': 0.05940467108987868, 'time': 0.0015446220713783987} >>> profile_speed.speed['remove_from_deque'] {'kstones': 0.00090945420190496104, 'time': 2.3647349735256284e-005} To be able to compare the results better, we calculate the ratio of both speeds: >>> (profile_speed.speed['remove_from_list']['kstones'] / ... profile_speed.speed['remove_from_deque']['kstones']) 71.706250305342934 Our deque is considerably faster than our list. But now we increase the range that is to be deleted:
- 138. >>> remove_from_list(my_list, 100, 1000) >>> remove_from_deque(my_deque, 100, 1000) And get a much smaller gain by using a deque: >>> (profile_speed.speed['remove_from_list']['kstones'] / ... profile_speed.speed['remove_from_deque']['kstones']) 4.925948467147018 We make the range even larger: >>> remove_from_list(my_list, 100, 10000) >>> remove_from_deque(my_deque, 100, 10000) Our list eventually becomes faster than the deque: >>> (profile_speed.speed['remove_from_list']['kstones'] / ... profile_speed.speed['remove_from_deque']['kstones']) 0.5219062068409327
- 140. dict vs. defaultdict Since Python 2.5 there is new defaultdict in the module collections. This works similarly to the the defaultdict method of dictionaries. Let's assume we want to count how many of each letter are in the following sentence: >>> s = 'Some letters appear several times in this text.' We can do this in the standard way: >>> d = {} >>> for key in s: ... d.setdefault(key, 0) ... d[key] += 1 ... >>> d
- 141. {'a': 3, ' ': 7, 'e': 8, 'i': 3, 's': 4, 'm': 2, 'l': 2, 'o': 1, 'n': 1, 'p': 2, 'S': 1, 'r': 3, 't': 6, 'v': 1, 'x': 1, 'h': 1, '.': 1} Or we can use the new defaultdict: >>> dd = collections.defaultdict(int) >>> for key in s: ... dd[key] += 1 ... >>> dd defaultdict(<type 'int'>, {'a': 3, ' ': 7, 'e': 8, 'i': 3, 's': 4, 'm': 2, 'l': 2, 'o': 1, 'n': 1, 'p': 2, 'S': 1, 'r': 3, 't': 6, 'v': 1, 'x': 1, 'h': 1, '.': 1}) >>> Let's profile the speed differences. First, a function with our standard dictionary:
- 142. >>> @profile_speed.profile_speed ... def standard_dict(text): ... d = {} ... for key in text: ... d.setdefault(key, 0) ... d[key] += 1 ... And now one for the defaultdict: >>> import collections >>> @profile_speed.profile_speed ... def default_dict(text): ... dd = collections.defaultdict(int) ... for key in text: ... dd[key] += 1 ... We call them both with the same data:
- 143. >>> standard_dict(s) >>> default_dict(s) and compare the results: >>> (profile_speed.speed['standard_dict']['kstones'] / profile_speed.speed['default_dict']['kstones']) 1.0524903876080238 There is not much difference between them: Therefore, we increase the size of our data: >>> s = 'a' * int(1e6) >>> standard_dict(s) >>> default_dict(s) and get a more than twofold speedup:
- 144. >>> (profile_speed.speed['standard_dict']['kstones'] / profile_speed.speed['default_dict']['kstones']) 2.3854284818433915 Let's look at different example from the Python documentation. We have this data structure: >>> data = [('yellow', 1), ('blue', 2), ('yellow', 3), ('blue', 4), ('red', 1)] Our goal is to produce a dictionary that groups all second tuple entries into a list: >>> d.items() [('blue', [2, 4]), ('red', [1]), ('yellow', [1, 3])] Again, we define a decorated function for the two dictionary versions:
- 145. >>> @profile_speed.profile_speed ... def default_dict_group(data): ... dd = collections.defaultdict(list) ... for key, value in data: ... dd[key].append(value) ... >>> @profile_speed.profile_speed ... def standard_dict_group(data): ... d = {} ... for key, value in data: ... d.setdefault(key, []).append(value) ... Call them: >>> default_dict_group(data) >>> standard_dict_group(data) and look at the results:
- 146. >>> (profile_speed.speed['standard_dict_group']['kstones'] / profile_speed.speed['default_dict_group']['kstones']) 0.69018090107868191 The defaultdict seems to be slower. So let's increase th data size: >>> data = data * 10000 >>> standard_dict_group(data) >>> default_dict_group(data) Now we are nearly twice as fast: >>> (profile_speed.speed['standard_dict_group']['kstones'] / profile_speed.speed['default_dict_group']['kstones']) 1.9115965603608458 Making the data even larger makes things only slightly faster:
- 147. >>> data = data * 10 >>> standard_dict_group(data) >>> default_dict_group(data) >>> (profile_speed.speed['standard_dict_group']['kstones'] / profile_speed.speed['default_dict_group']['kstones']) 1.9823501285360818 Another increase by a factor of ten actually produces a less favorable ratio for the defaultdict: >>> data = data * 10 >>> standard_dict_group(data) >>> default_dict_group(data) >>> (profile_speed.speed['standard_dict_group']['kstones'] / profile_speed.speed['default_dict_group']['kstones']) 1.8241023044794571
- 148. Big-O notation and Data Structures Normally, you would want to reduce complexity of your program to make it faster. One frequently used measure for complexity is the so called big-O 5 notation. The following table gives an overview of some notations along with a short description and some examples from Python. Notation Description Python Examples O(1) constant time does not increase with size of data len(my_list), len(my_dict), my_list[i], del my_dict[i], x in dict, x in set, my_list.append(i) O(n) linear time increase linearly with size of data Loops on list, strings, dicts, sets, string methods, x in my_list O(n log n) quasi linear time increases a little faster than linearly my_list.sort() O(n 2 ) quadratic time increases four times for each doubling of data nested loops
- 149. Notation Description Python Examples O(n 3 ) cubic time increases four times for each doubling of data nested nested loops O(n c ) factorial traveling sales man problem (not Python specific) In general, using big-O notation we look only at the order of magnitude. Constant factors are neglected. So O(3*n) and O(20*n) are called O(n). Therefore, O(20*n) might be slower than O(n 2 ) for very small n. But for large n the constant factor has very little influence. Actually we have already compared several of these notations in our examples above. Let's look at some more comparisons of notations.
- 150. O(1) vs. O(n) vs. O(n 2 ) We use our decorator from the module profile_speed: >>> import profile_speed We write a function that takes an iterable and reverses it into a list. Our first implementation uses the method insert to insert every item at the first position: >>> @profile_speed.profile_speed ... def use_on(iterable): ... result = [] ... for item in iterable: ... result.insert(0, item) ... return result ...
- 151. Our second implementation uses append and reverse the list after all items are appended: >>> @profile_speed.profile_speed ... def use_o1(iterable): ... result = [] ... for item in iterable: ... result.append(item) ... result.reverse() ... return result ... Now we compare both functions in terms for runtime: >>> def compare_on_o1(n): ... r1 = use_on(range(n)) ... r2 = use_o1(range(n)) ... assert r1 == r2 ... print (profile_speed.speed['use_on']['kstones'] / ... profile_speed.speed['use_o1']['kstones'])
- 152. ... >>> compare_on_o1(10) 1.6353049525 >>> compare_on_o1(100) 2.01816718953 >>> compare_on_o1(1000) 4.04768995537 >>> compare_on_o1(10000) 27.2673621812 >>> compare_on_o1(100000) 156.635364154 >>> compare_on_o1(int(1e6)) # this might take a while 2355.86619878 The speed differences are growing rapidly with increasing data sizes. The method append is O(1) and reverse is O(n). Even though insert is also O(n) it is called n times whereas reverse is called only once. Because we loop over all items of
- 153. our iterable, the first function is O(n + n) but the second is O(n 2 ). Putting this in numbers, we get: >>> for x in [10, 100, 1000, 10000, 100000, 1000000]: ... print x * x / (x + x) ... 5 50 500 5000 50000 500000 Of course instead of appending to a new list we can just convert the iterable into a list and reverse it: >>> @profile_speed.profile_speed ... def use_list(iterable): ... result = list(iterable) ... result.reverse()
- 154. ... return result ... Now we can compare both implementations that have the same big-O notation: >>> def compare_o1_list(n): ... r1 = use_list(range(n)) ... r2 = use_o1(range(n)) ... assert r1 == r2 ... speed = profile_speed.speed ... print (speed['use_o1']['kstones'] / ... speed['use_list']['kstones']) ... >>> compare_o1_list(10) 1.24255753768 >>> compare_o1_list(100) 4.39513352799 >>> compare_o1_list(1000)
- 155. 23.1481811661 >>> compare_o1_list(10000) 54.2245839131 >>> compare_o1_list(100000) 53.132471733 >>> compare_o1_list(1000000) 29.8124806601 Even though the big-O notation is the same, the list version is up to 50 times faster.
- 156. Exercises 1. Write a test program that searches the last number in a long list. Use item in long_list and item in set(long_list). Perform this search 10 and more times. Compare the run times. Hint: You can use timeit.default_timer() to get the time since the last call to this function. Alternatively, you can use the module timeit or the function measureRunTime which you can find in the examples directory in the subdirectory modules.
- 157. Caching
- 158. Reuse before You Recalculate If you find yourself calling the same function with the same arguments many time then caching might help to improve the performance of your program. Instead of doing an expensive calculation, database query, or rendering again and over again, caching just reuses the results of former function calls. Depending on whether the results will be the same for every call to the same function with the same arguments or if the result might change over time, we talk about deterministic or non-deterministic caching. An example for deterministic caching would be numerical calculations that should always produce the same result for the same input. Caching of database queries is non-deterministic because the database content might change. So after some timeout period the query has to be done anew.
- 159. All of the following examples are based on [ZIAD2008].
- 160. Deterministic caching The first thing we need to do, if we want to cache function results, is to uniquely identify the function we want to call: # file: get_key.py # based on Ziade 2008 """Generate a unique key for a function and its arguments. """ def get_key(function, *args, **kw): #1 """Make key from module and function names as well as arguments. """ key = '%s.%s:' % (function.__module__, function.__name__) #2 hash_args = [str(arg) for arg in args] #3 hash_kw = ['%s:%s' % (k, str(v)) for k, v in kw.items()] #4 return '%s::%s::%s' % (key, hash_args, hash_kw) #5
- 161. The function get_key takes a function and its positional and keyword arguments (#1). We extract the module name and function name from the function (#2). Now we convert all positional arguments into a list of strings (#3). We convert the keyword arguments into a list of strings using the keys and the string representation of the values (#4). Finally, we return a string that consists of the three strings we have assembled so far (#5). Now we use our function for a decorator to memoize (a term for the kind of caching we perform) previously calculated results: # file: cache_deterministic.py # form Ziade 2008 """Example for a deterministic cache """ import functools
- 162. from get_key import get_key #1 cache = {} #2 def memoize_deterministic(get_key=get_key, cache=cache): #3 """Parameterized decorator for memoizing. """ def _memoize(function): #4 """This takes the function. """ @functools.wraps(function) def __memoize(*args, **kw): #5 """This replaces the original function. """ key = get_key(function, *args, **kw) #6 try: return cache[key] #7
- 163. except KeyError: value = function(*args, **kw) #8 cache[key] = value #9 return value #10 return __memoize return _memoize We use our function get_key (#1) and define a global dictionary that will be used to store pre-calculated data (#2). Our decorator takes the function and the dictionary as arguments (#3). This allows us to use other functions to retrieve a key and other caches possibly data dictionary-like data stores such as shelve. The second level function takes the function that is to be called as argument (#4). The third level function takes the arguments (#5). Now we retrieve our key (#6) and try to access the result from our cache (#7). If the key is not in the cache, we call our function /#8), store the result in the cache (#9) and return the result (#10).
- 164. Let's try how it works. We import the time modul and our module with the decorator: >>> import time >>> import cache_deterministic We define a new function that adds to numbers and is decorated: >>> @cache_deterministic.memoize_deterministic() ... def add(a, b): ... time.sleep(2) ... return a + b ... We simulate some heavy calculations by delaying everything for two seconds with sleep. Let's call function: >>> add(2, 2) 4
- 165. This took about two seconds. Do it again: >>> add(2, 2) 4 Now the return is immediate. Again: >>> add(3, 3) 6 Two seconds delay. But now: >>> add(3, 3) Instantaneous response.
- 166. Non-deterministic caching For non-deterministic caching, we use an age that the computed value should not exceed: # file: cache_non_deterministic.py # form Ziade 2008 """Example for a cache that expires. """ import functools import time from get_key import get_key cache = {} def memoize_non_deterministic(get_key=get_key, storage=cache, age=0): #1 """Parameterized decorator that takes an expiration age.
- 167. """ def _memoize(function): """This takes the function. """ @functools.wraps(function) def __memoize(*args, **kw): """This replaces the original function. """ key = get_key(function, *args, **kw) try: value_age, value = storage[key] #2 deprecated = (age != 0 and (value_age + age) < time.time()) #3 except KeyError: deprecated = True #4 if not deprecated: return value #5 storage[key] = time.time(), function(*args, **kw) #6 return storage[key][1] #7
- 168. return __memoize return _memoize This decorator is a variation of the deterministic one above. We can supply an age (#1). The value will be recalculated if this age is exceeded. We retrieve an age and a value from our cache (#2). The value will be deprecated, i.e. recalculated if we provide a non-zero age and the old age plus the specified age are smaller than the current time (#3). Note: This means, if you provide no age or an age of zero, the cache will never expire. The value will also be calculated if the key was not found (#4). We return the value if it is still valid (#5). Otherwise, we recalculate it and store it together with current time in the cache (#6) and return the freshly calculated value (#7). Let's see how this works. We import our non-deterministic cache:
- 169. >>> import cache_non_deterministic and define a new function with a maximum cache age of 5 seconds: >>> @cache_non_deterministic.memoize_non_deterministic(age=5) ... def add2(a, b): ... time.sleep(2) ... return a + b ... The first call takes about two seconds: >>> add2(2, 2) 4 Immediately after this we do it again and get the response without delay:
- 170. >>> add2(2, 2) 4 Now we wait for at least 5 seconds ... and do it again: >>> add2(2, 2) 4 This took again two seconds because the cache was not used and the value was recalculated due to the time since the last call being greater than five seconds.
- 171. Least Recently Used Cache Caching is a common task. Therefore, Python starting from 3.2, provides a least recently used cache implementation in the functools module and a backport 6 for Python 2.6 and higher. This implementation is more elaborate than our attempts here. For example, it is thread-safe. The size of the cache is determined by maxsize. There are three distinct case: 1. If maxsize is 0, there is no caching and the function result will calculated every time the function is called. 2. If maxsize is None, it works similarly to our deterministic cache. That is, the LRU functionality is disabled and the cache can grow without limits.
- 172. 3. If maxize is a positive integer, the most recent masxize function results are cached. This is the most interesting case because we actually use the LRU features. Let's try it with a very small cache size of 2 to quickly see the effect of a filled cache: import time @lru_cache(maxsize=2) def add(a, b): time.sleep(2) # wait two seconds return a + b Now we use it: >>> add2(2, 2) # takes two seconds The second time around it returns without the two-second delay:
- 173. >>> add2(2, 2) # returns immediately Now we call the function with two other combinations of arguments: >>> add2(10, 5) # takes two seconds >>> add2(10, 20) # takes two seconds Now our small cache of size 2 is filled with two other results and a call with our original combination will delay again for the first call: >>> add2(2, 2) # takes two seconds >>> add2(2, 2) # returns immediately
- 174. We can look at the original function: >>> add.__wrapped__ <function __main__.add> as well as at the cache: >>> add.cache_info() CacheInfo(hits=6, misses=3, maxsize=2, currsize=2) Clearing the cache sets everything back to zero: >>> add.cache_clear() >>> add.cache_info() CacheInfo(hits=0, misses=0, maxsize=2, currsize=0)
- 175. It is recommended to use functools.lru_cache over own solutions wherever possible. It is likely to be more stable. For example, coming up with your own solution that is thread-safe might be not as simple as it seems at first glance.
- 176. Memcached Memcached 7 is a caching server that is primarily used to speed up database based dynamic web pages. It is very fast, trades RAM for speed, and is very powerful. We don't have time to look at it here. There are several ways to use Memcached from Python. Also the probably most popular web framework Django uses Memcached (Djangos cache 8 ).
- 177. The Example We will use the example of a very simple Monte Carlo simulation to determine pi for all our next topics. The approximate calculation of pi can be done by finding the ratio of points that lie within and outside a circle but inside a square with side length of the circles radius as shown in the figure. We look only at the upper right quarter of the circle. By doing so, we can place the origin of our coordinate system in the center of the circle and still have only positive coordinates.
- 178. The area of the quarter of the circle is calculated as:
- 179. The area of the square is: So their ratio is: Through conversion we get: Assuming an infinite number of points the ratio of points may be used instead of the areas, so:
- 180. Testing Speed Testing the speed of a program or its portions is a difficult task because many external circumstances can influnence the result. Python offers the module timeit that is designed to check small pieces of code at the commandline $ python -mtimeit 'x=0' 'x+=1' 10000000 loops, best of 3: 0.132 usec per loop or from within a module. We use timeit in the module measure_time.py to run all our test functions that calculate pi with the Monte Carlo method. # file: measure_time.py """Measure the run time of functions. """
- 181. from timeit import Timer #1 def measure_run_time(total, names, number=1): #2 """Measure the run times of all functions given with `names`. """ def timeit_runner(name): #3 """Time one function. """ timer = Timer('%s(total)' % name, 'from __main__ import %sntotal=%d' % (name, total)) #4 return timer.timeit(number), name #5 results = [] #6 for name in names: results.append(timeit_runner(name)) #7 results.sort() #8 length = max(len(name) for name in (names)) #9 format1 = '%%-%ds' % length
- 182. header = (format1 + '%s%10s') % ('Function', 'Time'.center(11), 'Ratio') print print header print '=' * len(header) for result in results: ratio = result[0] / results[0][0] print (format1 + '%9.4f s%10.2f') % (result[1], result[0], ratio) if __name__ == '__main__': import time def func1(total): """Test function that waits for `total` seconds. """ time.sleep(total) def func2(total): """Test function that waits for `total` * 2 seconds. """
- 183. time.sleep(total * 2) def test(): """Check if it works. """ measure_run_time(1, ['func1', 'func2']) test() We import the class Timer from the module timeit (#1). The function measure_run_time takes the number of iterations for the Monte Carlo calculation n, the names of the functions to run names and the number of runs. It averages run time speed over number defaulting to 1 (#2). Within this function we have the helper function timeit_runner (#3) that takes only the name of the function. It makes an instance
- 184. of Timer (#4) and runs the function the specified number of times. It returns the runtime and the name of the function (#5). The rest of measure_run_time collects all results in a list (#6, #7), sorts them fastest first (#8), and prints them to the screen in a formatted table (#9 and the following lines). The output looks like this: measure_time.py Function Time Ratio ============================= func1 0.9993 s 1.00 func2 1.9999 s 2.00
- 185. Pure Python Our first algorithm is plain python: # file: plain_pi.py """Calculating pi with Monte Carlo. """ import math #1 import random import sys # make `import measure_time` work sys.path.append('../measuring') import measure_time #2 def pi_plain(total): #3 """Calculate pi with `total` hits. """
- 186. count_inside = 0 #4 for _ in xrange(total): #5 x = random.random() #6 y = random.random() #7 dist = math.sqrt(x * x + y * y) #8 if dist < 1: count_inside += 1 #9 return 4.0 * count_inside / total #10 if __name__ == '__main__': #11 def test(): """Check if it works. """ print 'pi:', pi_plain(int(1e5)) #12 names = ['pi_plain'] #13 total = int(1e5) #14 repeat = 5 #15 measure_time.measure_run_time(total, names, repeat) #16 test()
- 187. We first import the modules random and math (#1), and then our module measure_time explained above (#2). The function pi_plain takes the number of intended iterations as argument (#3). First, we set the counter for the number of points inside the circle to zero (#4). Then we loop over the range from 0 to total (#5). The x and y coordinates are random numbers in the range (0,1) (#6, #7). Following Pythagoras, the distance dist from the origin is the square root of the sum of the squares of the coordinates (#8). If this distance is smaller than 1, we count it as inside the circle (#9). We return the ratio of the inside and total count multiplied by four (#10) after the loop has terminated. Using the Python for the main program (#11), we print the result of the function call to the screen (#12). Now we start our performance test using a list with names of the functions to test. In this case it is only one (#13). We want 100,000 iterations. Because it is easy to
- 188. loose count with all the zeros, we use a notation frequently used in science 1e5. Since this is a float and an integer is needed, we convert it (#14). We want the time to be measured five times (#15). Finally, we start the measurement (#16). The result should be (with different numbers for pi and Time): $ plain_pi.py pi: 3.142032 Function Time Ratio ============================= pi_plain 0.8327 s 1.00 Since we have only one function, the ratio is 1.0. This ratio is always the one for the fastest function and bigger for the slower ones. A ratio of 2.0 means it takes twice as long as the fastest.
- 189. Now we make some small changes to the program. The module math in the Python standard library has the function hypot(x, y), which is equivalent to the sqrt(x*x + x*y). Assuming it is faster, we modify the program: # file: math_pi.py """Variation on `pi_plain` but using `hypot` from the `math` module. """ import math import random def pi_math(total): #1 """Pi calculation using hypot. """ count_inside = 0 for _ in range(total):
- 190. dist = math.hypot(random.random(), #2 random.random()) if dist < 1: count_inside += 1 return 4.0 * count_inside / total if __name__ == '__main__': import plain_pi import measure_time pi_plain = plain_pi.pi_plain def test(): """Check if it works. """ names = ['pi_plain', 'pi_math'] total = int(1e5) repeat = 5 measure_time.measure_run_time(total, names, repeat) test()
- 191. This is very similar to the first program, only the name of the function (#1) and the method to calculate the distance (#2) have changed. Now, we would like to test the performance and compare it with that of the first function. Because we want all functions in separate files, we write a small testing module. The rest of the source is identical with our first program. The output of the program should be like this: $ math_pi.py Function Time Ratio ============================= pi_plain 0.8373 s 1.00 pi_math 1.1272 s 1.35 Obviously, the hypot is slightly slower than our more detailed calculation. This result is not necessarily expected.
- 192. Exercise 1. Use the function pi_plain and replace range with xrange. Time it, applying the same procedure shown above. Compare the results. Vary the numbers n and m. How do results change? 2. Use the power function pow() and ** to calculate the squares, i.e. pow(x, 2) and x**2 instead of x * x. 3. Use local names instead of global variables. For instances, avoid module.function() by making function local before the loop. 4. Suggest more changes to improve performance.
- 193. PyPy: New, Fast, Maturing PyPy is an implementation of Python 2.7. that is faster than the standard CPython for many common tasks. In addition it supports sandboxing to run untrusted code and stackless support besides other features. As long as the code is pure Python and runs with Python 2.7, it should run with PyPy. C code can be accessed via ctypes and there is active development to use Python C extensions. Let's just run our code in PyPy and compare the run time to that of CPython for 1e6 throws: python plain_pi.py pi: 3.1426 Function Time Ratio
- 194. ============================= pi_plain 5.0093 s 1.00 pypy plain_pi.py pi: 3.144164 Function Time Ratio ============================= pi_plain 0.6998 s 1.00 This gives us a 7 times faster execution without doing anything except using pypy instead of python at the command line. The math_pi.py example is about 6 times faster: python math_pi.py Function Time Ratio ============================= pi_math 4.0295 s 1.00
- 195. pypy math_pi.py Function Time Ratio ============================= pi_math 0.6784 s 1.00
- 196. Exercises 1. Use PyPy for the pure Python algorithms for calculating pi. Vary the number of iterations. Compare the results with runs with CPython.
- 197. NumPy for Numeric Arrays Python is used by many scientists who often have to deal with large amounts of data in form of multidimensional arrays. NumPy 9 is a library implemented in C that brings matlab-like numerical processing to Python. We apply NumPy to our example: # file: numpy_pi.py """Calculating pi with Monte Carlo Method and NumPy. """ import numpy #1 def pi_numpy(total): #2 """Compute pi. """ x = numpy.random.rand(total) #3 y = numpy.random.rand(total) #4
- 198. dist = numpy.sqrt(x * x + y * y) #5 count_inside = len(numpy.where(dist < 1)[0]) #6 return 4.0 * count_inside / total if __name__ == '__main__': def test(): """Time the execution. """ import timeit start = timeit.default_timer() print 'pi:', pi_numpy(int(1e6)) print 'run time', timeit.default_timer() - start test() After we import numpy (#1), we define the function numpy_pi that again takes the number of iterations as argument total (#2). The function numpy.random.rand generates an array of random numbers in the range (0,1). So x and y hold such arrays (#3, #4). dist is the array of distances computed from x and y
- 199. (#5). where returns an array with the values for which the condition dist < 1 is true. Its lenght is the number of hits inside the circle (#6). The return value is a tuple with one element. Therefore, we need to index with zero [0].
- 200. Exercise Time numpy_pi applying the same procedure shown above. Compare the results. How do they depend on total and repeat?
- 201. NumPyPy NumPy is widely used by scientists and engineers. Since this group of people would greatly profit from using PyPy, there is a recent effort to rewrite NumPy in PyPy: NumPyPy. This is not an interfacing effort to connect to the existing C code base of NumPy but rather a rewrite of NumPy in PyPy. The task is not complete yet and there are some missing features. Let's try to use NumPyPy for our example. It turns out that in the current release of PyPy (1.8) the module for the random numbers and the where function are still missing. In addition there is still lots of work being done in speeding array construction. So NumPyPy is not ready yet to be compared to NumPy.
- 202. Using Multiple CPUs with multiprocessing The future is parallel. CPUs don't perform so much faster anymore. The trend is towards multiple processors. Hyper threading, dual core, quad core and other terms are ubiquitous. Python has the GIL - the global interpreter lock - that prevents threads in a Python program to take advantage of more than one CPU. Since Python 2.6, the module multiprocessing is a part of the standard library. For older versions of Python there is the module pyprocessing that needs to be installed separately but does the same job. Let's try to speed up our calculation with going parallel: # file: processes_pi.py """Calculation of pi with Monte Carlo and multiprocessing.
- 203. """ import math try: from multiprocessing import Process, Queue #1 except ImportError: from processing import Process, Queue #2 import random import timeit def count_inside(total): #3 """Count the hits inside the circle. This function will be run multiple times in different processes. """ inside_count = 0 for _ in xrange(total): x = random.random() y = random.random()
- 204. dist = math.sqrt(x * x + y * y) if dist < 1: inside_count += 1 return inside_count def calc_pi(total): #4 """Determine pi _without_ multprocessing as refrence. """ return 4 * count_inside(total) / float(total) def count_inside_process(queue, total): #5 """Count the hits inside the circle in a seperate process. """ queue.put(count_inside(total)) def calc_pi_processes(total, process_count): #6 """Calculate pi spread of several processses. We need to split the task into sub tasks before we can hand
- 205. them to other processes. """ min_n = total // process_count #7 counters = [min_n] * process_count #8 reminder = total % process_count #9 for count in xrange(reminder): #10 counters[count] += 1 #11 queues_processes = [] #12 for counter in counters: #13 queue = Queue() #14 process = Process(target=count_inside_process, args=(queue, counter)) #15 process.start() #16 queues_processes.append((queue, process)) #17 inside_count = sum(process[0].get() for process in queues_processes) #18 for queue_process in queues_processes: #19 queue_process[1].join() #20 return 4 * inside_count / float(total) #21
- 206. We need Process and Queue from multiprocessing (#1) or from pyprocessing (#2) if we work with pre 2.6 versions of Python. We use our method for counting the points inside the circle (#3). We use the non-parallel calculation of pi as reference (#4). We write a wrapper around this function that outs the calculated result into a queue (#5). Our function for calculating pi in parallel takes the number of points to investigate and the number of processes the calculation should be performed on as arguments (#6). We determine which share each process should calculate. The goal is to distribute the load evenly. Therefore, dived all tries (n) by the number of processes (#7) and put this result in list (#8). We calculate the reminder (#9). If there is a reminder, we have to add the remaining numbers starting from the first list element (#10 and #11).
- 207. We use a list for storing our queues and processes (#12). Going through all counters (#13), we create a new queue (#14) and start a new process (#15) with our function count_inside_process that will be called in each process with queue and the counter as arguments. Every step gets started (#16) and we append the process and the queues to our list (#17) to make them accessible for later use. We get the calculated result from each queue and sum them up (#18). Now we go through all processes (#19) and wait for them to finish (#20). Finally, we can calculate our pi using the result (#21). if __name__ == '__main__': def test(): """Check if it works. """ process_count = 2 #22
- 208. total = int(1e3) #23 print 'number of tries: %2.0e' % total #24 start = timeit.default_timer() #25 print 'pi:', calc_pi(total) one_time = timeit.default_timer() - start print 'run time one process:', one_time start = timeit.default_timer() #26 pi_value = calc_pi_processes(total, process_count) #27 print 'pi', pi_value two_time = timeit.default_timer() - start print 'run time %d processes:' % process_count, two_time print 'ratio:', no_time / two_time #28 print 'diff:', two_time - no_time test() We test our implementation with two processes (#22) and a number of tries (#23). Now we print the number of tries on the
- 209. screen (#24). The test code for our non-process version is straight forward (#25). We do the same thing for our process version (#26). The only difference is to use the wrapper function (#27). Finally, we show time ratios and time difference between the process and non-process version (#28). On a computer with a dual core we get the following results: processes_pi.py number of tries: 1e+003 pi: 3.196 run time no processes: 0.00268888923 pi 3.14 run time 2 processes: 0.929015838605 ratio: 0.00289434164478 diff: 0.926326949375 processes_pi.py
- 210. number of tries: 1e+006 pi: 3.139364 run time no processes: 1.18375324238 pi 3.146548 run time 2 processes: 1.61413168433 ratio: 0.73336844439 diff: 0.430378441953 processes_pi.py number of tries: 1e+007 pi: 3.1408952 run time no processes: 11.9309476484 pi 3.1422716 run time 2 processes: 7.79187159262 ratio: 1.53120434629 diff: -4.13907605576 processes_pi.py number of tries: 1e+008 pi: 3.14183468 run time no processes: 118.451061238 pi 3.14122748
- 211. run time 2 processes: 71.0664637545 ratio: 1.66676453253 diff: -47.3845974838 We get a speedup of a factor of up to 1.6 for large numbers of iterations. On a different machine with an i5 processor that gives 4 cores according to cpu_count, the best speedup comes with 10 million iterations and three processes with more than double the speed of a single process: number of tries: 1e+07 pi: 3.1412816 run time no processes: 8.22669792175 pi 3.1421968 run time 4 processes: 3.52357602119 ratio: 2.33475817529 diff: -4.70312190056
- 212. There are more possibilities to work with multiprocessing. For our use case, a pool is a good alternative: # file pool_pi.py """Multiprocessing with a pool of workers. """ import math try: from multiprocessing import Pool, cpu_count #1 except ImportError: from processing import Pool, cpu_count #2 import random import timeit def count_inside(total): """Count the hits inside the circle. This function will be run multiple times in different
- 213. processes. """ inside_count = 0 for _ in xrange(total): x = random.random() y = random.random() dist = math.sqrt(x * x + y * y) if dist < 1: inside_count += 1 return inside_count def calc_pi(total): """Determine pi _without_ multprocessing as refrence. """ return 4 * count_inside(total) / float(total) def calc_pi_workers(total, workers=None): #3 """Calculate pi spread of several processses with workers. We need to split the task into sub tasks before we can hand
- 214. them to other process that run workers """ if not workers: workers = cpu_count() #4 min_n = total // workers counters = [min_n] * workers reminder = total % workers for count in xrange(reminder): counters[count] += 1 pool = Pool(processes=workers) #5 results = [pool.apply_async(count_inside, (counter,)) for counter in counters] #6 inside_count = sum(result.get() for result in results) #7 return 4 * inside_count / float(total) #8 if __name__ == '__main__': def test(): """Check if it works. """ workers = 2
- 215. total = int(1e3) print 'number of tries: %2.0e' % total start = timeit.default_timer() print 'pi:', calc_pi(total) no_time = timeit.default_timer() - start print 'run time no workers:', no_time start = timeit.default_timer() pi_value = calc_pi_workers(total, workers) print 'pi', pi_value two_time = timeit.default_timer() - start print 'run time %d workers:' % workers, two_time print 'ratio:', no_time / two_time print 'diff:', two_time - no_time test() There are only a few changes compared to the version above. We need to import Pool and cpuCount from multiprocessing (#1) or processing (#2). Our function that will run in parallel
- 216. now takes the number of workers as second argument (#3). If we don't provide the number of workers, we use as many workers as available CPUs are determined by multiprocessing (#4). We create a new pool (#5) with specified number of workers. We call apply_async for each worker and store all results (#6). Now we get the values of the results and sum them up (#7). Finally, we calculate our pi as usual (#8). Again, on a dual core machine the parallel implementation is up to 1.8 times faster than the one-process version: pool_pi.py number of tries: 1e+003 pi: 3.208 run time no workers: 0.00241594951314 pi 3.084 run time 2 workers: 0.734127661477 ratio: 0.0032909119761
- 217. diff: 0.731711711963 pool_pi.py number of tries: 1e+006 pi: 3.141976 run time no workers: 1.19714572662 pi 3.14252 run time 2 workers: 1.55787928354 ratio: 0.768445757813 diff: 0.360733556919 pool_pi.py number of tries: 1e+007 pi: 3.1412288 run time no workers: 11.8663374814 pi 3.1407312 run time 2 workers: 7.29266065939 ratio: 1.62716161298 diff: -4.57367682205 pool_pi.py number of tries: 1e+008
- 218. pi: 3.1413308 run time no workers: 119.62180333 pi 3.141572 run time 2 workers: 66.502250705 ratio: 1.79876323074 diff: -53.1195526247
- 219. Combination of Optimization Strategies We can combine several of the techniques we used. Let's use NumPy in conjunction with the parallel approach: #file: pool_numpy_pi.py """Combining NumPy and multiprocessing. """ try: from multiprocessing import Pool, cpu_count except ImportError: from processing import Pool, cpu_count import numpy def count_inside(total): #1 """Count hits inside the circle. """
- 220. x = numpy.random.rand(total) y = numpy.random.rand(total) dist = numpy.sqrt(x * x + y * y) return len(numpy.where(dist < 1)[0]) #2 def calc_pi(total): """Calcualte pi from the hits inside and the total hits. """ return 4 * count_inside(total) / float(total) def calc_pi_workers_numpy(total, workers=None): """Spread the work over several processes. """ if not workers: workers = cpu_count() min_n = total // workers counters = [min_n] * workers reminder = total % workers for count in xrange(reminder): counters[count] += 1
- 221. pool = Pool(processes=workers) results = [pool.apply_async(count_inside, [counter]) for counter in counters] inside_count = sum(result.get() for result in results) return 4 * inside_count / float(total) if __name__ == '__main__': def test(): """Run some performamce tests. """ import timeit workers = 2 total = int(1e3) print 'number of tries: %2.0e' % total start = timeit.default_timer() print 'pi:', calc_pi(total) no_time = timeit.default_timer() - start print 'run time no workers:', no_time
- 222. start = timeit.default_timer() pi_value = calc_pi_workers_numpy(total, workers) print 'pi', pi_value two_time = timeit.default_timer() - start print 'run time %d workers:' % workers, two_time print 'ratio:', no_time / two_time print 'diff:', two_time - no_time test() The only difference to pool_pi.py is the use of NumPy in count_inside (#1). We just return the number of points inside the circle (#2). Now we measure the performance of all our implementations: # file: montecarlo_pi.py #!/usr/bin/env python
- 223. """Test runner for all implementations. """ import sys sys.path.append('../pi') #1 sys.path.append('../multiprocessing') has_psyco = False try: import psyco #2 has_psyco = True except ImportError: print 'No psyco found doing tests without it.' has_numpy = False try: import numpy #3 has_numpy = True except ImportError: print 'No numpy found doing tests without it.'
- 224. import measure_time #4 from plain_pi import pi_plain #5 from math_pi import pi_math from pool_pi import calc_pi_workers if has_numpy: from numpy_pi import pi_numpy from pool_numpy_pi import calc_pi_workers_numpy if has_psyco: psyco_pi_plain = psyco.proxy(pi_plain) #6 psyco_pi_math = psyco.proxy(pi_math) psyco_calc_pi_workers = psyco.proxy(calc_pi_workers) if has_numpy: psyco_pi_numpy = psyco.proxy(pi_numpy) psyco_calc_pi_workers_numpy = psyco.proxy(calc_pi_workers_numpy) def main():
- 225. """Run all tests that could be found. """ total = int(float(sys.argv[1])) #7 repeat = int(sys.argv[2]) #8 names = ['pi_plain', 'pi_math', 'calc_pi_workers'] #9 if has_numpy: names.extend(['pi_numpy', 'calc_pi_workers_numpy']) #10 if has_psyco: names.extend(['psyco_pi_plain', 'psyco_pi_math', #11 'psyco_calc_pi_workers']) if has_numpy: names.extend(['psyco_pi_numpy', 'psyco_calc_pi_workers_numpy']) #12 measure_time.measure_run_time(total, names, repeat) #13 if __name__ == '__main__': main()
- 226. We add the paths that hold our libraries to sys.path so that we can import them (#1). We try to import psyco (#2) and numpy (#3), but their use is optional because Psyco is only available for 32-bit PC system with Python <= 2.6 and NumPy is still incomplete for PyPy. We now import our run time measuring module (#4) as well as all our modules we want to test (#5). We bind new function with Psyco only if it is available (#6). We use two command line arguments to stir our test. The number of iterations total (#7) and the number how often the test are supposed to run repeat (#8). We use a list of function names (#9) that we eventually hand over to our measurement function along with total and repeat (#13). Depending on the availability of NumPy (10, 12) and Psyco (#12), we add more function names.
- 227. Finally, we compare the run times of our work: montecarlo_pi.py 1e4 1 Function Time Ratio ================================================ pi_numpy 0.0023 s 1.00 psyco_pi_numpy 0.0023 s 1.00 psyco_pi_plain 0.0032 s 1.40 psyco_pi_math 0.0064 s 2.80 pi_plain 0.0121 s 5.27 pi_math 0.0146 s 6.40 calc_pi_workers_numpy 1.1274 s 493.27 psyco_calc_pi_workers_numpy 1.1309 s 494.82 psyco_calc_pi_workers 1.1472 s 501.94 calc_pi_workers 1.2358 s 540.73 The parallel computations are very much slower than all others if we use only 1e4 iterations.
- 228. Using three orders of magnitude more iterations gives a different result: montecarlo_pi.py 1e7 1 Function Time Ratio ================================================ psyco_pi_numpy 1.8983 s 1.00 pi_numpy 2.1135 s 1.11 psyco_calc_pi_workers_numpy 2.4557 s 1.29 calc_pi_workers_numpy 2.4921 s 1.31 psyco_pi_plain 2.8003 s 1.48 psyco_pi_math 6.1471 s 3.24 psyco_calc_pi_workers 7.7396 s 4.08 calc_pi_workers 7.8426 s 4.13 pi_plain 12.0987 s 6.37 pi_math 14.7275 s 7.76 Doubling the iterations makes the parallel versions the fastest:
- 229. montecarlo_pi.py 2e7 2 Function Time Ratio ================================================ calc_pi_workers_numpy 3.4627 s 1.00 psyco_calc_pi_workers_numpy 3.4844 s 1.01 psyco_pi_numpy 3.8041 s 1.10 pi_numpy 4.2014 s 1.21 psyco_pi_plain 5.6769 s 1.64 psyco_pi_math 12.4210 s 3.59 psyco_calc_pi_workers 14.1498 s 4.09 calc_pi_workers 14.1824 s 4.10 pi_plain 24.8832 s 7.19 pi_math 29.5806 s 8.54 Your results may look somewhat different, depending on your compiler and your platform. In conclusion, the fastest are the parallel NumPy versions followed by the serial plain NumPy versions. Applying psyco to NumPy has
- 230. little effect. psyco_pi_plain is next in the ranking. Here psyco does good job. The parallel version (no NumPy) seems not to profit from psyco. The slowest implementation is about 8 times lower than the fastest. These numbers are only valid for this very example. Other programs that may involve more complicated algorithms and data structures are likely to exhibit a different ranking of the versions. In particular, if we can make use of Python built-in data structures, such as dictionary, the performance of pure Python can be much better. This is especially true if we combine it with Psyco.
- 231. Exercise Run the comparison with different values for total and repeat. Use very small and very large numbers. Compare the ratios between the versions. Explain the differences. Use PyPy for the tests. Change the number of used processes in the multiprocessing examples.
- 232. Compilation of Tools for Speedup and Extending There are many more ways to extend Python. Therefore, a short compilation of methods and tools for this purpose is given here. The compilation is by no means exhaustive. Method/Tool Remarks Link algorithmic improvements try this first http://www.python.org Numpy matlab like array processing http://numpy.scipy.org Psyco JIT, very little to do http://psyco.sourceforge.net PyPy fast Python implementation http://pypy.org/ Cython C with Python syntax http://cython.org/ ctypes call DLLs directly Pythons's standard library cffi new interface to C for CPython and PyPy https://cffi.readthedocs.org
- 233. Method/Tool Remarks Link Numba compile to LLVM code http://numba.pydata.org/ C extensions by hand lots of work http://docs.python.org/ext/ext.html SWIG mature, stable, widely used http://www.swig.org Boost.Python C ++ template based, elegant http://www.boost.org/libs/python/doc PyCXX/CXX last update August 2005 http://cxx.sourceforge.net SCXX last update 2002 http://davidf.sjsoft.com/mirrors/mcmillan-inc/scxx.html SIP developed for Qt, fast http://www.riverbankcomputing.co.uk/sip Babel unite C/C++, F77/90, Py, Java http://www.llnl.gov/CASC/components Weave inline C++ in Python http://scipy.org/Weave PyInline inline other languages (alpha) http://pyinline.sourceforge.net
- 234. Method/Tool Remarks Link f2py stable Fortran extensions http://cens.ioc.ee/projects/f2py2e pyFort F77 only, last update 2004 http://pyfortran.sourceforge.net PyCUDA Python on GPGPUs http://mathema.tician.de/software/pycuda PyOpenCL Python on GPGPUs http://mathema.tician.de/software/pyopencl Copperhead Python on GPGPUs http://code.google.com/p/copperhead/ COM/DCOM, CORBA, XML-RPC, ILU middleware various
- 235. End
- 236. Colophon This material is written in reStructuredText and has been converted into PDF using rst2pdf. All Python files are dynamically included from the development directory.
- 237. Links
- 238. Current Trainings Modules - Python Academy As of February 2014 Module Topic Length (days) in-house open Python for Programmers 3 yes yes Python for Non-Programmers 4 yes yes Python for Programmers in Italian 3 yes yes Python for Scientists and Engineers 3 yes yes Python for Data Analysis 3 yes yes HPC with Python 3 yes yes Cython in Depth 2 yes yes Advanced Python 3 yes yes Introduction to Django 4 yes yes Advanced Django 3 yes yes Professional Testing with Python 3 yes yes
- 239. Module Topic Length (days) in-house open Twisted 3 yes yes Plone 2 yes yes Introduction to wxPython 2 yes yes Introduction to PySide/PyQt 2 yes yes SQLAlchemy 1 yes yes High Performance XML with Python 1 yes yes Camelot 1 yes yes Optimizing Python Programs 1 yes yes Python Extensions with Other Languages 1 yes no Data Storage with Python 1 yes no Introduction to Software Engineering with Python 1 yes no Overview of the Python Standard Library 1 yes no Threads and Processes in Python 1 yes no
- 240. Module Topic Length (days) in-house open Windows Programming with Python 1 yes no Network Programming with Python 1 yes no Introduction to IronPython 1 yes no We always customize and extend training modules as needed. We offer consulting services such as code review, custom programming and tailor-made workshops. More Information: www.python-academy.com
- 241. Current Open Courses - Python Academy As of February 2014 Location Date Course Language Leipzig March 20 - 21, 2014 Cython in Depth English Montréal April 09, 2014 Descriptors and Metaclasses Tutorial at PyCon 2014 English Montréal April 10, 2014 Optimization Tutorial at PyCon 2014 English Freiburg June 02 - 04, 2014 Professional Testing with Python English Leipzig June 13, 2014 SQLAlchemy Course English Leipzig June 16 - 20, 2014 High-Performance Computing with Python English Leipzig June 29 - July 02, 2014 Python für Nichtprogrammierer German Leipzig June 30 - July 02, 2014 Python für Programmierer German
- 242. Location Date Course Language Leipzig July 03 - 05, 2014 Python für Wissenschaftler und Ingenieure German Herentals September 19, 2014 SQLAlchemy Course English Herentals September 20, 2014 Camelot Course English Leipzig September 21 - 24, 2014 Python for Non-Programmers English Leipzig September 22 - 24, 2014 Python for Programmers English Leipzig September 25 - 27, 2014 Python for Scientists and Engineers English Leipzig September 29, 2014 SQLAlchemy Course English Leipzig September 30, 2014 Camelot Course English Leipzig October 16 - 17, 2014 Cython in Depth English Herentals October 31, 2014 SQLAlchemy Course English Herentals November 03 - 05, 2014 Python for Programmers English
- 243. Location Date Course Language Freiburg November 24 - 26, 2014 Professional Testing with Python English Freiburg, Germany Herentals, Belgium Leipzig, Germany Montréal, Canada LANG2006 Hans Petter Lantangen, Python Scripting for Computational Science, Second Edition, Springer Berlin, Heidelberg, 2006.
- 244. MART2005 Alex Martelli et al., Python Cookbook, O'Reilly,2nd Edition, 2005. MART2006 Alex Martelli, Python in a Nutshell, O'Reilly, 2nd Edition, 2006. ZIAD2008 Tarek Ziadè, Expert Python Programming: Best practices for designing, coding, and distributing your Python software, Packt 2008. 1 http://aspn.activestate.com/ASPN/Python/Cookbook 2 http://www.vrplumber.com/programming/runsnakerun/ 3 http://guppy-pe.sourceforge.net 4 http://packages.python.org/Pympler/ 5 http://en.wikipedia.org/wiki/Big_O_notation ttp://code.activestate.com/recipes/578078-py26-and-py30-backport-of-python- 7 http://www.danga.com/memcached/ 8 http://docs.djangoproject.com/en/dev/topics/cache/