Profiling PHP & Javascript
0 likes1,454 views

Dave Ross gave a presentation on profiling PHP and JavaScript performance. He recommended using the Xdebug profiler for PHP, which provides profiling information that can be viewed in tools like Webgrind. For JavaScript profiling, he suggested using the Firebug console to turn profiling on and off and view profiling results within the Firebug interface. The goal of profiling is to identify sections of code to optimize for better speed or lower memory usage.


Profiling PHP & Javascript
- 1. PHP & Javascript Profiling :: Dave Ross :: The West Suburban Chicago PHP Meetup :: March 2009 :: suburbanchicagophp.org PHP & Javascript Profiling Dave Ross The West Suburban Chicago PHP Meetup March 5, 2009
- 2. PHP & Javascript Profiling :: Dave Ross :: The West Suburban Chicago PHP Meetup :: March 2009 :: suburbanchicagophp.org Dave Ross “ I grew up around computers, fell in love with the Internet way back in 1994, and built a successful career around my interests in computers and business. My career focus has been on e-commerce, and in my personal time I study issues related to digital identity, trust, and reputation tracking. I’m also a cat shelter volunteer, a small business owner, an avid Scrabble player, a vintage computer enthusiast, and a b-movie junkie.” Ten years professional development experience. PHP Developer, certified Java developer LinkedIn Profile: http://www.linkedin.com/in/daverossfromchicago
- 3. PHP & Javascript Profiling :: Dave Ross :: The West Suburban Chicago PHP Meetup :: March 2009 :: suburbanchicagophp.org Software Profiling In software engineering, performance analysis, more commonly today known as profiling, is the investigation of a program's behavior using information gathered as the program executes (i.e. it is a form of dynamic program analysis, as opposed to static code analysis). The usual goal of performance analysis is to determine which sections of a program to optimize — usually either to increase its speed or decrease its memory requirement (or sometimes both). - Wikipedia
- 4. PHP & Javascript Profiling :: Dave Ross :: The West Suburban Chicago PHP Meetup :: March 2009 :: suburbanchicagophp.org Webgrind Output
- 5. PHP & Javascript Profiling :: Dave Ross :: The West Suburban Chicago PHP Meetup :: March 2009 :: suburbanchicagophp.org PHP Options For Profiling DBG (http://www.php-debugger.com/dbg/)
- 6. Xdebug (http://www.xdebug.org/) Xdebug is free (as in beer and speech), actively maintained, and well-supported. I highly recommend it.
- 7. PHP & Javascript Profiling :: Dave Ross :: The West Suburban Chicago PHP Meetup :: March 2009 :: suburbanchicagophp.org Installing Xdebug Put xdebug.so somewhere on your system Add something like this to php.ini: ; xdebug config Mac OS X zend_extension=/Applications/MAMP/Library/share/php/xdebug.so xdebug.remote_enable=1 xdebug.remote_handler=dbgp xdebug.remote_mode=req xdebug.remote_host=127.0.0.1 xdebug.remote_port=9000 xdebug.idekey= xdebug.profiler_enable =1 xdebug.profiler_output_dir=/Applications/MAMP/logs/xdebug ...and then restart Apache (you might have disable Zend Optimizer too)
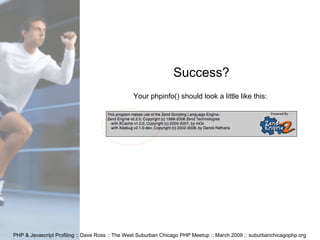
- 8. PHP & Javascript Profiling :: Dave Ross :: The West Suburban Chicago PHP Meetup :: March 2009 :: suburbanchicagophp.org Success? Your phpinfo() should look a little like this:
- 9. PHP & Javascript Profiling :: Dave Ross :: The West Suburban Chicago PHP Meetup :: March 2009 :: suburbanchicagophp.org And you'll start getting these cachegrind.out.##### files left in your xdebug.profiler_output_dir every time you load a PHP page...
- 10. PHP & Javascript Profiling :: Dave Ross :: The West Suburban Chicago PHP Meetup :: March 2009 :: suburbanchicagophp.org What does it mean? You don't need to know. This guy needs to know (Derick Rethans, father of Xdebug)
- 11. PHP & Javascript Profiling :: Dave Ross :: The West Suburban Chicago PHP Meetup :: March 2009 :: suburbanchicagophp.org You need a “callgrind” program Wingrind (Windows)
- 15. PHP & Javascript Profiling :: Dave Ross :: The West Suburban Chicago PHP Meetup :: March 2009 :: suburbanchicagophp.org
- 16. PHP & Javascript Profiling :: Dave Ross :: The West Suburban Chicago PHP Meetup :: March 2009 :: suburbanchicagophp.org “ Cost” When *grind refers to a function call's “cost”, it's measuring the assembly language instructions for that call. This is mostly meaningless to us in a high-level language. What's important is the relative cost. If some function call is “costing” a lot more than other calls, and it doesn't do a whole lot, that's where you need to optimize.
- 17. PHP & Javascript Profiling :: Dave Ross :: The West Suburban Chicago PHP Meetup :: March 2009 :: suburbanchicagophp.org Now, let's profile some Javascript! Download Firebug for Firefox @ http://getfirebug.com/ Why aren't you using it already?
- 18. PHP & Javascript Profiling :: Dave Ross :: The West Suburban Chicago PHP Meetup :: March 2009 :: suburbanchicagophp.org console.profile() turns on the profiler console.profileEnd() turns it off
- 19. PHP & Javascript Profiling :: Dave Ross :: The West Suburban Chicago PHP Meetup :: March 2009 :: suburbanchicagophp.org Firebug Profiling
- 20. PHP & Javascript Profiling :: Dave Ross :: The West Suburban Chicago PHP Meetup :: March 2009 :: suburbanchicagophp.org Links xdebug http://www.xdebug.org/ xdebug binaries (from Komodo) http://aspn.activestate.com/ASPN/Downloads/Komodo/RemoteDebugging Webgrind http://code.google.com/p/webgrind/ Firebug http://getfirebug.com/ “ Introducing xdebug” article http://devzone.zend.com/article/2803-Introducing-xdebug