SlideShare a Scribd company logo
What’s New with
Spark Performance Monitoring
in Apache Spark 3.0
Luca Canali
Data Engineer, CERN
Agenda
Intro and Motivations
Spark Monitoring
▪ Recap of the available instrumentation
Spark 3.0 Improvements
▪ Memory monitoring
▪ Plugins for custom monitoring
▪ Web UI: SQL tab, Streaming monitoring
Outlook and Community
About Luca
3#UnifiedDataAnalytics #SparkAISummit
• Data Engineer at CERN
– Hadoop and Spark service, database services
– 20+ years with databases and data engineering
– Performance engineering
• Blog, tools, contributions to Apache Spark
– @LucaCanaliDB – http://cern.ch/canali
Data at the Large Hadron Collider: Exabyte Scale
LHC experiments raw data: >300 PB
Computing jobs on the WLCG Grid: using ~1M cores
4
Apache Spark Clusters at CERN
• Spark running on clusters:
– YARN/Hadoop -> established
– Spark on Kubernetes -> growing adoption
Accelerator logging
(part of LHC
infrastructure)
Hadoop - YARN - 30 nodes
(Cores - 1200, Mem - 13 TB, Storage – 7.5 PB)
General Purpose Hadoop - YARN, 39 nodes
(Cores – 1.7k, Mem – 18 TB, Storage – 12 PB)
Cloud containers Kubernetes on Openstack VMs, Cores - 270, Mem – 2 TB
Storage: remote HDFS or custom storage (CERN EOS, for
physics data, S3 on Ceph also available).
Note: GPU resources available.
5
Analytics Platform Outlook
HEP software
Experiments storage
HDFS
Personal storage
Integrating with existing
infrastructure:
• Software
• Data
Jupyter notebooks are a
common interface for
accessing data
• CERN has
established on-
demand notebooks
via “Swan”
Other Cloud storage,
S3 on Ceph
GPUs
Monitoring, Measuring and Troubleshooting
▪ Collect and expose metrics (Spark, Cluster, OS)
▪ For troubleshooting and insights on performance
Workload monitoring data +
Spark architectural knowledge
Application
Info on application
architecture
Info on computing
environment
Agent produces:
insights + actions
Monitoring Features in Apache Spark,
a Recap
Web UI
• First and main point of access to monitor Spark applications
• Details on jobs, stages, tasks, SQL, streaming, etc
• Default URL: http://driver_host:4040
• New doc in Spark 3.0: https://spark.apache.org/docs/latest/web-
ui.html
9
Spark Metrics with the REST API
…
10
Spark Listeners: @DeveloperApi
• Custom class, extends SparkListener
• Methods react on events to collect data, example:
• Attach custom Listener class to Spark Session
--conf spark.extraListeners=..
11
SparkMeasure Architecture
12#UnifiedDataAnalytics #SparkAISummit
Tooling: sparkMeasure
13#UnifiedDataAnalytics #SparkAISummit
• bin/spark-shell --packages ch.cern.sparkmeasure:spark-
measure_2.12:0.17
• bin/spark-shell --packages ch.cern.sparkmeasure:spark-
measure_2.12:0.17
• val stageMetrics = ch.cern.sparkmeasure.StageMetrics(spark)
•
• bin/spark-shell --packages ch.cern.sparkmeasure:spark-
measure_2.12:0.17
• val stageMetrics = ch.cern.sparkmeasure.StageMetrics(spark)
•
• val myQuery = "select count(*) from range(1000) cross join
range(1000) cross join range(1000)"
• stageMetrics.runAndMeasure(spark.sql(myQuery).show())
Task Metrics Measured with sparkMeasure
14#UnifiedDataAnalytics #SparkAISummit
• Spark Context default degree of parallelism = 8
• Aggregated Spark stage metrics:
• numStages => 3
• numTasks => 17
• elapsedTime => 13520 (14 s)
• stageDuration => 13411 (13 s)
• executorRunTime => 100020 (1.7 min)
• executorCpuTime => 98899 (1.6 min)
• executorDeserializeTime => 4358 (4 s)
• executorDeserializeCpuTime => 1887 (2 s)
• resultSerializationTime => 2 (2 ms)
• jvmGCTime => 56 (56 ms)
• shuffleFetchWaitTime => 0 (0 ms)
• shuffleWriteTime => 11 (11 ms)
• resultSize => 19955 (19.0 KB)
• diskBytesSpilled => 0 (0 Bytes)
• memoryBytesSpilled => 0 (0 Bytes)
• peakExecutionMemory => 0
• recordsRead => 2000
• bytesRead => 0 (0 Bytes)
• recordsWritten => 0
• bytesWritten => 0 (0 Bytes)
• shuffleRecordsRead => 8
• shuffleTotalBlocksFetched => 8
• shuffleLocalBlocksFetched => 8
• shuffleRemoteBlocksFetched => 0
• shuffleTotalBytesRead => 472 (472 Bytes)
• shuffleLocalBytesRead => 472 (472 Bytes)
• shuffleRemoteBytesRead => 0 (0 Bytes)
• shuffleRemoteBytesReadToDisk => 0 (0 Bytes)
• shuffleBytesWritten => 472 (472 Bytes)
• shuffleRecordsWritten => 8
Further Instrumentation in Spark:
the Spark Metrics System
▪ Bullet 1
▪ Sub-bullet
▪ Sub-bullet
▪ Bullet 2
▪ Sub-bullet
▪ Sub-bullet
▪ Bullet 3
▪ Sub-bullet
▪ Sub-bullet
Send Spark Metrics to a Sink
16#UnifiedDataAnalytics #SparkAISummit
• $ SPARK_HOME/bin/spark-shell 
• --conf "spark.metrics.conf.driver.sink.graphite.class"="org.apache.spark.metrics.sink.GraphiteSink"
• --conf "spark.metrics.conf.executor.sink.graphite.class"="org.apache.spark.metrics.sink.GraphiteSink"
• --conf "spark.metrics.conf.*.sink.graphite.host"="graphiteEndPoint_influxDB_hostName>" 
• --conf "spark.metrics.conf.*.sink.graphite.port"=<graphite_listening_port> 
• --conf "spark.metrics.conf.*.sink.graphite.period"=10 
• --conf "spark.metrics.conf.*.sink.graphite.unit"=seconds 
• --conf "spark.metrics.conf.*.sink.graphite.prefix"="lucatest" 
• --conf "spark.metrics.conf.*.source.jvm.class"="org.apache.spark.metrics.source.JvmSource"
• Edit $SPARK_HOME/conf/metrics.properties
• Alternative: use the config parameters spark.metrics.conf.*
Spark Grafana Dashboard
• Visualize Spark metrics
– In real time and historical data
– Summaries and time series of key metrics
• Data for drill-down and root-cause analysis
17#UnifiedDataAnalytics #SparkAISummit
What’s New in Apache Spark 3.0
Memory Usage Monitoring in Spark 3.0
▪ The problem we want to solve
▪ Memory is key for the performance and stability of Spark jobs
▪ Java OOM (out of memory) errors can be hard to troubleshoot
▪ We want to allocate the needed memory, not overshooting/wasting
▪ New “Executor Metrics” in Spark 3.0
▪ Measure details of memory usage by memory component
▪ Peak values measurements (you get OOM on peak allocation not average)
▪ Spark Metrics System: report memory metrics as time series
"peakMemoryMetrics" : {
"JVMHeapMemory" : 29487812552,
"JVMOffHeapMemory" : 149957200,
"OnHeapExecutionMemory" : 12458956272,
"OffHeapExecutionMemory" : 0,
"OnHeapStorageMemory" : 83578970,
"OffHeapStorageMemory" : 0,
"OnHeapUnifiedMemory" : 12540212490,
"OffHeapUnifiedMemory" : 0,
"DirectPoolMemory" : 66809076,
"MappedPoolMemory" : 0,
"ProcessTreeJVMVMemory" : 38084534272,
"ProcessTreeJVMRSSMemory" : 36998328320,
"ProcessTreePythonVMemory" : 0,
"ProcessTreePythonRSSMemory" : 0,
"ProcessTreeOtherVMemory" : 0,
"ProcessTreeOtherRSSMemory" : 0,
"MinorGCCount" : 561,
"MinorGCTime" : 49918,
"MajorGCCount" : 0,
"MajorGCTime" : 0
},
REST API:
peak memory usage values per executor
WebUI URL +
/api/v1/applications/<application_id>/executors
Extra tunables:
spark.executor.processTreeMetrics.enabled=true
spark.executor.metrics.pollingInterval=<time in ms>
Executor Metrics, REST API
Spark Memory Allocations
▪ Bullet 1
▪ Sub-bullet
▪ Sub-bullet
▪ Bullet 2
▪ Sub-bullet
▪ Sub-bullet
▪ Bullet 3
▪ Sub-bullet
▪ Sub-bullet
Memory Monitoring Graphs in the Dashboard
Memory metrics as
time series
Dashboard:
Visualize memory
usage over time
Details of on-heap,
unified memory, etc
Compare with other
metrics
Correlate with jobs/sql
start time
Custom Monitoring with Spark Plugins
▪ Spark 3.0 Plugins
▪ Plugins are executed at the startup of executors and the driver
▪ Plugins allow to extend Spark metrics with custom code and
instrumentation
▪ Examples of monitoring enhancements with plugins
▪ Cloud Storage monitoring (S3A, GS, WASBS, OCI, CERN’s ROOT, etc)
▪ Improved HDFS monitoring
▪ OS metrics: cgroup metrics for Spark on Kubernetes
▪ Custom application metrics
Plugins Extend Spark Metrics
▪ Custom metrics for instrumentation or debugging
▪ Metrics from libraries/packages on top of Apache Spark
▪ Spark Plugins provide:
▪ API for integrating custom instrumentation with the rest of the Spark monitoring
ExecutorPackage
Plugin
Plugin registers extra
metrics using package
API
Extra metrics join the
Spark metrics stream
JVM
Metrics
Sink
Spark Plugins API
▪ Code snippets
Spark 3.0 Plugin API
This is how you hook to the Spark Metrics instrumentation
Getting Started with Spark Plugins
▪ From https://github.com/cerndb/SparkPlugins
▪ Plugins for demo + plugins for Cloud I/O and OS monitoring
▪ RunOSCommandPlugin runs an OS command at executor startup
▪ DemoMetricsPlugin show how to integrate with Spark Metrics
• bin/spark-shell –master yarn
• --packages ch.cern.sparkmeasure:spark-plugins_2.12:0.1 
• --conf spark.plugins=ch.cern.RunOSCommandPlugin,
• ch.cern.DemoMetricsPlugin
Measuring OS and Container Metrics
▪ Example of how to measure OS metrics from cgroup instrumentation
▪ Useful for Spark on K8S
▪ Brings together OS metrics with other Spark-workload metrics
▪ By default Apache Spark instruments only CPU usage
bin/spark-shell --master k8s://https://<K8S URL>:6443 
--packages ch.cern.sparkmeasure:spark-plugins_2.12:0.1 
--conf spark.kubernetes.container.image=<registry>/spark:v310-SNAP 
--conf spark.plugins=ch.cern.CgroupMetrics 
...
Cgroups Metrics – Use for Spark on K8S
▪ Metrics implemented (gauges), with prefix ch.cern.CgroupMetrics:
▪ CPUTimeNanosec: CPU time used by the processes in the cgroup
▪ this includes CPU used in Python
▪ MemoryRss: number of bytes of anonymous and swap cache memory.
▪ MemorySwap: number of bytes of swap usage.
▪ MemoryCache: number of bytes of page cache memory.
▪ NetworkBytesIn: network traffic inbound.
▪ NetworkBytesOut: network traffic outbound.
• docker run --network=host -d lucacanali/spark-dashboard:v01
• bin/spark-shell --master k8s://https:...
• --packages ch.cern.sparkmeasure:spark-plugins_2.12:0.1 
• --conf spark.plugins=ch.cern.CgroupMetrics 
• --conf
"spark.metrics.conf.*.sink.graphite.class"="org.apache.spark.
metrics.sink.GraphiteSink" 
• --conf "spark.metrics.conf.*.sink.graphite.host"=`hostname` 
• --conf "spark.metrics.conf.*.sink.graphite.port"=2003 
• --conf "spark.metrics.conf.*.sink.graphite.period"=10 
• --conf "spark.metrics.conf.*.sink.graphite.unit"=seconds 
• --conf "spark.metrics.conf.*.sink.graphite.prefix"="luca"
Example: Dashboard for Spark on K8S
Network bytes (in) vs. time
Measuring S3A and other Cloud Filesystems
▪ Example of how to measure S3A throughput metrics
▪ Note: Apache Spark instruments only HDFS and local filesystem
▪ Plugins uses HDFS client API for Hadoop Compatible filesystems
▪ Metrics: bytesRead, bytesWritten, readOps, writeOps
--conf spark.plugins=ch.cern.CloudFSMetrics
--conf spark.cernSparkPlugin.cloudFsName=<name of the filesystem>
(example: "s3a", "gs", "wasbs", "oci", "root", etc.)
S3A bytes read vs. time
Experimental: Measuring I/O Time
▪ Plugins used to measure I/O read time with HDFS and S3A
▪ Use for advanced troubleshooting
▪ Also example of plugins used to instrument custom libraries
▪ Plugin: --conf
spark.plugins=ch.cern.experimental.S3ATimeInstrumentation
▪ Custom S3A jar with time instrumentation:
https://github.com/LucaCanali/hadoop/tree/s3aAndHDFSTimeInstrumentation
▪ Metrics: S3AReadTimeMuSec, S3ASeekTimeMuSec,
S3AGetObjectMetadataMuSec
SQL Monitoring Improvements in Spark 3.0
▪ Improved SQL Metrics and SQL tab execution plan visualization
▪ Improved SQL metrics instrumentation
▪ SQL metrics documented at https://spark.apache.org/docs/latest/web-
ui.html#sql-metrics
▪ Improved execution plan visualization and available metrics
Improved metrics list for
shuffle operations
Added Codegen IdImproved stats visualization +
info on max value
More Monitoring Improvements in Spark 3.0
▪ Spark Streaming tab
▪ Metrics and graphs
▪ New Structured Streaming UI (SPARK-29543)
▪ Experimental support for Prometheus
▪ REST API: /metrics/executors/Prometheus conditional to
spark.ui.prometheus.enabled=true
▪ Improved documentation
▪ New: Web UI doc https://spark.apache.org/docs/latest/web-ui.html
▪ Monitoring doc: https://spark.apache.org/docs/latest/monitoring.html
Outlook and Community
Community Effort
What You Can Do To Improve Spark Monitoring
▪ (developers) Tooling: Improving Spark Metrics and instrumentation
▪ Sink for InfluxDB and Prometheus
▪ Further instrument Spark core and ecosystem (ex: I/O time, Python UDF)
▪ Develop and share plugins: instrument libraries, OS metrics (GPUs), etc
▪ (product experts) Methods: root-cause performance analysis
▪ Use metrics and graphs for troubleshooting and root-cause analysis
▪ Adopt tools and methods to your platform/users
▪ (innovators) Holy Grail of Monitoring:
▪ Building automated (AI) systems that can perform root-cause analysis and
autotune data/database systems
Improvements Expected in Spark 3.1 and WIP
▪ [SPARK-27142] New SQL REST API
▪ [SPARK-32119] Plugins can be distributed with –-jars and –packages on YARN,
this adds support for K8S and Standalone
▪ [SPARK-33088] Enhance Executor Plugin API to include callbacks on task start
and end events
▪ [SPARK-23431] Expose stage level peak executor metrics via REST API
▪ [SPARK-30985] Support propagating SPARK_CONF_DIR files to driver and
executor pods
▪ [SPARK-31711] Executor metrics in local mode
▪ WIP [SPARK-30306] Python execution time instrumentation
▪ WIP on Hadoop (targeting Hadoop 3.4)
▪ [HADOOP-16830] Add public IOStatistics API
Conclusions
▪ Monitoring and instrumentation improvements:
▪ One more reason to upgrade to Apache Spark 3.0
▪ Memory monitoring with Executor Metrics in Spark 3.0
▪ Help troubleshooting and preventing OOM
▪ Spark Plugin API
▪ Use to measure Cloud FileSystems I/O, OS and container metrics
▪ Use to build your custom application metrics
▪ Build and share!
▪ Web UI, streaming and Spark SQL monitoring also improved
Acknowledgements and Links
• Thanks to colleagues at CERN, Hadoop and Spark service
• Thanks to Apache Spark committers and community
– For their help with JIRAs and PRs: SPARK-26928, SPARK-27189, SPARK-
28091, SPARK-29654, SPARK-30041, SPARK-30775
• Links:
– Executor Metrics and memory monitoring: SPARK-23429 and SPARK-27189
– Spark Plugins: SPARK-29397, SPARK-28091
– https://db-blog.web.cern.ch/blog/luca-canali/2020-08-spark3-memory-
monitoring
– https://github.com/LucaCanali/sparkMeasure
– https://github.com/cerndb/spark-dashboard
– https://github.com/cerndb/SparkPlugins
Feedback
Your feedback is important to us.
Don’t forget to rate
and review the sessions.
Ad

Recommended

Performance Troubleshooting Using Apache Spark Metrics
Databricks
 
Scaling Apache Spark on Kubernetes at Lyft
Databricks
 
Spark + Parquet In Depth: Spark Summit East Talk by Emily Curtin and Robbie S...
Spark Summit
 
The columnar roadmap: Apache Parquet and Apache Arrow
DataWorks Summit
 
Redis + Apache Spark = Swiss Army Knife Meets Kitchen Sink
Databricks
 
The Parquet Format and Performance Optimization Opportunities
Databricks
 
Apache Spark At Scale in the Cloud
Databricks
 
Making Apache Spark Better with Delta Lake
Databricks
 
Parquet performance tuning: the missing guide
Ryan Blue
 
Introducing BinarySortedMultiMap - A new Flink state primitive to boost your ...
Flink Forward
 
Fine Tuning and Enhancing Performance of Apache Spark Jobs
Databricks
 
Apache Arrow Flight: A New Gold Standard for Data Transport
Wes McKinney
 
Efficient Data Storage for Analytics with Apache Parquet 2.0
Cloudera, Inc.
 
Optimizing Apache Spark UDFs
Databricks
 
Application Timeline Server - Past, Present and Future
VARUN SAXENA
 
Improving SparkSQL Performance by 30%: How We Optimize Parquet Pushdown and P...
Databricks
 
Monitor Apache Spark 3 on Kubernetes using Metrics and Plugins
Databricks
 
From AWS Data Pipeline to Airflow - managing data pipelines in Nielsen Market...
Itai Yaffe
 
Producer Performance Tuning for Apache Kafka
Jiangjie Qin
 
Performance Tuning RocksDB for Kafka Streams’ State Stores
confluent
 
Building a SIMD Supported Vectorized Native Engine for Spark SQL
Databricks
 
Parquet Hadoop Summit 2013
Julien Le Dem
 
Best Practice of Compression/Decompression Codes in Apache Spark with Sophia...
Databricks
 
Spark SQL - The internal -
NTT DATA OSS Professional Services
 
The Apache Spark File Format Ecosystem
Databricks
 
Exactly-Once Financial Data Processing at Scale with Flink and Pinot
Flink Forward
 
Understanding Query Plans and Spark UIs
Databricks
 
Webinar: Deep Dive on Apache Flink State - Seth Wiesman
Ververica
 
Spark Summit EU talk by Luca Canali
Spark Summit
 
Running Apache Spark on Kubernetes: Best Practices and Pitfalls
Databricks
 

More Related Content

What's hot (20)

Parquet performance tuning: the missing guide
Ryan Blue
 
Introducing BinarySortedMultiMap - A new Flink state primitive to boost your ...
Flink Forward
 
Fine Tuning and Enhancing Performance of Apache Spark Jobs
Databricks
 
Apache Arrow Flight: A New Gold Standard for Data Transport
Wes McKinney
 
Efficient Data Storage for Analytics with Apache Parquet 2.0
Cloudera, Inc.
 
Optimizing Apache Spark UDFs
Databricks
 
Application Timeline Server - Past, Present and Future
VARUN SAXENA
 
Improving SparkSQL Performance by 30%: How We Optimize Parquet Pushdown and P...
Databricks
 
Monitor Apache Spark 3 on Kubernetes using Metrics and Plugins
Databricks
 
From AWS Data Pipeline to Airflow - managing data pipelines in Nielsen Market...
Itai Yaffe
 
Producer Performance Tuning for Apache Kafka
Jiangjie Qin
 
Performance Tuning RocksDB for Kafka Streams’ State Stores
confluent
 
Building a SIMD Supported Vectorized Native Engine for Spark SQL
Databricks
 
Parquet Hadoop Summit 2013
Julien Le Dem
 
Best Practice of Compression/Decompression Codes in Apache Spark with Sophia...
Databricks
 
Spark SQL - The internal -
NTT DATA OSS Professional Services
 
The Apache Spark File Format Ecosystem
Databricks
 
Exactly-Once Financial Data Processing at Scale with Flink and Pinot
Flink Forward
 
Understanding Query Plans and Spark UIs
Databricks
 
Webinar: Deep Dive on Apache Flink State - Seth Wiesman
Ververica
 
Parquet performance tuning: the missing guide
Ryan Blue
 
Introducing BinarySortedMultiMap - A new Flink state primitive to boost your ...
Flink Forward
 
Fine Tuning and Enhancing Performance of Apache Spark Jobs
Databricks
 
Apache Arrow Flight: A New Gold Standard for Data Transport
Wes McKinney
 
Efficient Data Storage for Analytics with Apache Parquet 2.0
Cloudera, Inc.
 
Optimizing Apache Spark UDFs
Databricks
 
Application Timeline Server - Past, Present and Future
VARUN SAXENA
 
Improving SparkSQL Performance by 30%: How We Optimize Parquet Pushdown and P...
Databricks
 
Monitor Apache Spark 3 on Kubernetes using Metrics and Plugins
Databricks
 
From AWS Data Pipeline to Airflow - managing data pipelines in Nielsen Market...
Itai Yaffe
 
Producer Performance Tuning for Apache Kafka
Jiangjie Qin
 
Performance Tuning RocksDB for Kafka Streams’ State Stores
confluent
 
Building a SIMD Supported Vectorized Native Engine for Spark SQL
Databricks
 
Parquet Hadoop Summit 2013
Julien Le Dem
 
Best Practice of Compression/Decompression Codes in Apache Spark with Sophia...
Databricks
 
The Apache Spark File Format Ecosystem
Databricks
 
Exactly-Once Financial Data Processing at Scale with Flink and Pinot
Flink Forward
 
Understanding Query Plans and Spark UIs
Databricks
 
Webinar: Deep Dive on Apache Flink State - Seth Wiesman
Ververica
 

Similar to What is New with Apache Spark Performance Monitoring in Spark 3.0 (20)

Spark Summit EU talk by Luca Canali
Spark Summit
 
Running Apache Spark on Kubernetes: Best Practices and Pitfalls
Databricks
 
Apache Spark for RDBMS Practitioners: How I Learned to Stop Worrying and Lov...
Databricks
 
Getting Started with Apache Spark on Kubernetes
Databricks
 
Apache Spark Performance Troubleshooting at Scale, Challenges, Tools, and Met...
Databricks
 
Native support of Prometheus monitoring in Apache Spark 3
Dongjoon Hyun
 
Native Support of Prometheus Monitoring in Apache Spark 3.0
Databricks
 
End-to-End Data Pipelines with Apache Spark
Burak Yavuz
 
Operational Tips For Deploying Apache Spark
Databricks
 
Spark Hsinchu meetup
Yung-An He
 
Jumpstart on Apache Spark 2.2 on Databricks
Databricks
 
Jump Start on Apache® Spark™ 2.x with Databricks
Databricks
 
Apache Spark - A High Level overview
Karan Alang
 
Dr. Elephant for Monitoring and Tuning Apache Spark Jobs on Hadoop with Carl ...
Databricks
 
Introduction to Apache Spark and MLlib
pumaranikar
 
Jump Start with Apache Spark 2.0 on Databricks
Anyscale
 
03 2014 Apache Spark Serving: Unifying Batch, Streaming, and RESTful Serving
Databricks
 
Spark Saturday: Spark SQL & DataFrame Workshop with Apache Spark 2.3
Databricks
 
Typesafe spark- Zalando meetup
Stavros Kontopoulos
 
Building Spark as Service in Cloud
InMobi Technology
 
Spark Summit EU talk by Luca Canali
Spark Summit
 
Running Apache Spark on Kubernetes: Best Practices and Pitfalls
Databricks
 
Apache Spark for RDBMS Practitioners: How I Learned to Stop Worrying and Lov...
Databricks
 
Getting Started with Apache Spark on Kubernetes
Databricks
 
Apache Spark Performance Troubleshooting at Scale, Challenges, Tools, and Met...
Databricks
 
Native support of Prometheus monitoring in Apache Spark 3
Dongjoon Hyun
 
Native Support of Prometheus Monitoring in Apache Spark 3.0
Databricks
 
End-to-End Data Pipelines with Apache Spark
Burak Yavuz
 
Operational Tips For Deploying Apache Spark
Databricks
 
Spark Hsinchu meetup
Yung-An He
 
Jumpstart on Apache Spark 2.2 on Databricks
Databricks
 
Jump Start on Apache® Spark™ 2.x with Databricks
Databricks
 
Apache Spark - A High Level overview
Karan Alang
 
Dr. Elephant for Monitoring and Tuning Apache Spark Jobs on Hadoop with Carl ...
Databricks
 
Introduction to Apache Spark and MLlib
pumaranikar
 
Jump Start with Apache Spark 2.0 on Databricks
Anyscale
 
03 2014 Apache Spark Serving: Unifying Batch, Streaming, and RESTful Serving
Databricks
 
Spark Saturday: Spark SQL & DataFrame Workshop with Apache Spark 2.3
Databricks
 
Building Spark as Service in Cloud
InMobi Technology
 
Ad

More from Databricks (20)

DW Migration Webinar-March 2022.pptx
Databricks
 
Data Lakehouse Symposium | Day 1 | Part 1
Databricks
 
Data Lakehouse Symposium | Day 1 | Part 2
Databricks
 
Data Lakehouse Symposium | Day 2
Databricks
 
Data Lakehouse Symposium | Day 4
Databricks
 
5 Critical Steps to Clean Your Data Swamp When Migrating Off of Hadoop
Databricks
 
Democratizing Data Quality Through a Centralized Platform
Databricks
 
Learn to Use Databricks for Data Science
Databricks
 
Why APM Is Not the Same As ML Monitoring
Databricks
 
The Function, the Context, and the Data—Enabling ML Ops at Stitch Fix
Databricks
 
Stage Level Scheduling Improving Big Data and AI Integration
Databricks
 
Simplify Data Conversion from Spark to TensorFlow and PyTorch
Databricks
 
Scaling your Data Pipelines with Apache Spark on Kubernetes
Databricks
 
Scaling and Unifying SciKit Learn and Apache Spark Pipelines
Databricks
 
Sawtooth Windows for Feature Aggregations
Databricks
 
Re-imagine Data Monitoring with whylogs and Spark
Databricks
 
Raven: End-to-end Optimization of ML Prediction Queries
Databricks
 
Processing Large Datasets for ADAS Applications using Apache Spark
Databricks
 
Massive Data Processing in Adobe Using Delta Lake
Databricks
 
Machine Learning CI/CD for Email Attack Detection
Databricks
 
Ad

Recently uploaded (20)

Prescriptive Process Monitoring Under Uncertainty and Resource Constraints: A...
Mahmoud Shoush
 
11_L2_Defects_and_Trouble_Shooting_2014[1].pdf
gun3awan88
 
PPT1_CB_VII_CS_Ch3_FunctionsandChartsinCalc.ppsx
animaroy81
 
Shifting Focus on AI: How it Can Make a Positive Difference
1508 A/S
 
Reliability Monitoring of Aircrfat commerce
Rizk2
 
最新版美国芝加哥大学毕业证(UChicago毕业证书)原版定制
taqyea
 
最新版美国威斯康星大学河城分校毕业证(UWRF毕业证书)原版定制
taqyea
 
All the DataOps, all the paradigms .
Lars Albertsson
 
Measurecamp Copenhagen - Consent Context
Human37
 
美国毕业证范本中华盛顿大学学位证书CWU学生卡购买
Taqyea
 
NVIDIA Triton Inference Server, a game-changing platform for deploying AI mod...
Tamanna36
 
英国毕业证范本利物浦约翰摩尔斯大学成绩单底纹防伪LJMU学生证办理学历认证
taqyed
 
最新版美国佐治亚大学毕业证(UGA毕业证书)原版定制
Taqyea
 
Daily, Weekly, Monthly Report MTC March 2025.pptx
PanjiDewaPamungkas1
 
Camuflaje Tipos Características Militar 2025.ppt
e58650738
 
ilide.info-tg-understanding-culture-society-and-politics-pr_127f984d2904c57ec...
jed P
 
RESEARCH-FINAL-GROUP-3, about the final .pptx
gwapokoha1
 
最新版意大利米兰大学毕业证(UNIMI毕业证书)原版定制
taqyea
 
Microsoft Power BI - Advanced Certificate for Business Intelligence using Pow...
Prasenjit Debnath
 
Model Evaluation & Visualisation part of a series of intro modules for data ...
brandonlee626749
 

What is New with Apache Spark Performance Monitoring in Spark 3.0

  • 1. What’s New with Spark Performance Monitoring in Apache Spark 3.0 Luca Canali Data Engineer, CERN
  • 2. Agenda Intro and Motivations Spark Monitoring ▪ Recap of the available instrumentation Spark 3.0 Improvements ▪ Memory monitoring ▪ Plugins for custom monitoring ▪ Web UI: SQL tab, Streaming monitoring Outlook and Community
  • 3. About Luca 3#UnifiedDataAnalytics #SparkAISummit • Data Engineer at CERN – Hadoop and Spark service, database services – 20+ years with databases and data engineering – Performance engineering • Blog, tools, contributions to Apache Spark – @LucaCanaliDB – http://cern.ch/canali
  • 4. Data at the Large Hadron Collider: Exabyte Scale LHC experiments raw data: >300 PB Computing jobs on the WLCG Grid: using ~1M cores 4
  • 5. Apache Spark Clusters at CERN • Spark running on clusters: – YARN/Hadoop -> established – Spark on Kubernetes -> growing adoption Accelerator logging (part of LHC infrastructure) Hadoop - YARN - 30 nodes (Cores - 1200, Mem - 13 TB, Storage – 7.5 PB) General Purpose Hadoop - YARN, 39 nodes (Cores – 1.7k, Mem – 18 TB, Storage – 12 PB) Cloud containers Kubernetes on Openstack VMs, Cores - 270, Mem – 2 TB Storage: remote HDFS or custom storage (CERN EOS, for physics data, S3 on Ceph also available). Note: GPU resources available. 5
  • 6. Analytics Platform Outlook HEP software Experiments storage HDFS Personal storage Integrating with existing infrastructure: • Software • Data Jupyter notebooks are a common interface for accessing data • CERN has established on- demand notebooks via “Swan” Other Cloud storage, S3 on Ceph GPUs
  • 7. Monitoring, Measuring and Troubleshooting ▪ Collect and expose metrics (Spark, Cluster, OS) ▪ For troubleshooting and insights on performance Workload monitoring data + Spark architectural knowledge Application Info on application architecture Info on computing environment Agent produces: insights + actions
  • 8. Monitoring Features in Apache Spark, a Recap
  • 9. Web UI • First and main point of access to monitor Spark applications • Details on jobs, stages, tasks, SQL, streaming, etc • Default URL: http://driver_host:4040 • New doc in Spark 3.0: https://spark.apache.org/docs/latest/web- ui.html 9
  • 10. Spark Metrics with the REST API … 10
  • 11. Spark Listeners: @DeveloperApi • Custom class, extends SparkListener • Methods react on events to collect data, example: • Attach custom Listener class to Spark Session --conf spark.extraListeners=.. 11
  • 13. Tooling: sparkMeasure 13#UnifiedDataAnalytics #SparkAISummit • bin/spark-shell --packages ch.cern.sparkmeasure:spark- measure_2.12:0.17 • bin/spark-shell --packages ch.cern.sparkmeasure:spark- measure_2.12:0.17 • val stageMetrics = ch.cern.sparkmeasure.StageMetrics(spark) • • bin/spark-shell --packages ch.cern.sparkmeasure:spark- measure_2.12:0.17 • val stageMetrics = ch.cern.sparkmeasure.StageMetrics(spark) • • val myQuery = "select count(*) from range(1000) cross join range(1000) cross join range(1000)" • stageMetrics.runAndMeasure(spark.sql(myQuery).show())
  • 14. Task Metrics Measured with sparkMeasure 14#UnifiedDataAnalytics #SparkAISummit • Spark Context default degree of parallelism = 8 • Aggregated Spark stage metrics: • numStages => 3 • numTasks => 17 • elapsedTime => 13520 (14 s) • stageDuration => 13411 (13 s) • executorRunTime => 100020 (1.7 min) • executorCpuTime => 98899 (1.6 min) • executorDeserializeTime => 4358 (4 s) • executorDeserializeCpuTime => 1887 (2 s) • resultSerializationTime => 2 (2 ms) • jvmGCTime => 56 (56 ms) • shuffleFetchWaitTime => 0 (0 ms) • shuffleWriteTime => 11 (11 ms) • resultSize => 19955 (19.0 KB) • diskBytesSpilled => 0 (0 Bytes) • memoryBytesSpilled => 0 (0 Bytes) • peakExecutionMemory => 0 • recordsRead => 2000 • bytesRead => 0 (0 Bytes) • recordsWritten => 0 • bytesWritten => 0 (0 Bytes) • shuffleRecordsRead => 8 • shuffleTotalBlocksFetched => 8 • shuffleLocalBlocksFetched => 8 • shuffleRemoteBlocksFetched => 0 • shuffleTotalBytesRead => 472 (472 Bytes) • shuffleLocalBytesRead => 472 (472 Bytes) • shuffleRemoteBytesRead => 0 (0 Bytes) • shuffleRemoteBytesReadToDisk => 0 (0 Bytes) • shuffleBytesWritten => 472 (472 Bytes) • shuffleRecordsWritten => 8
  • 15. Further Instrumentation in Spark: the Spark Metrics System ▪ Bullet 1 ▪ Sub-bullet ▪ Sub-bullet ▪ Bullet 2 ▪ Sub-bullet ▪ Sub-bullet ▪ Bullet 3 ▪ Sub-bullet ▪ Sub-bullet
  • 16. Send Spark Metrics to a Sink 16#UnifiedDataAnalytics #SparkAISummit • $ SPARK_HOME/bin/spark-shell • --conf "spark.metrics.conf.driver.sink.graphite.class"="org.apache.spark.metrics.sink.GraphiteSink" • --conf "spark.metrics.conf.executor.sink.graphite.class"="org.apache.spark.metrics.sink.GraphiteSink" • --conf "spark.metrics.conf.*.sink.graphite.host"="graphiteEndPoint_influxDB_hostName>" • --conf "spark.metrics.conf.*.sink.graphite.port"=<graphite_listening_port> • --conf "spark.metrics.conf.*.sink.graphite.period"=10 • --conf "spark.metrics.conf.*.sink.graphite.unit"=seconds • --conf "spark.metrics.conf.*.sink.graphite.prefix"="lucatest" • --conf "spark.metrics.conf.*.source.jvm.class"="org.apache.spark.metrics.source.JvmSource" • Edit $SPARK_HOME/conf/metrics.properties • Alternative: use the config parameters spark.metrics.conf.*
  • 17. Spark Grafana Dashboard • Visualize Spark metrics – In real time and historical data – Summaries and time series of key metrics • Data for drill-down and root-cause analysis 17#UnifiedDataAnalytics #SparkAISummit
  • 18. What’s New in Apache Spark 3.0
  • 19. Memory Usage Monitoring in Spark 3.0 ▪ The problem we want to solve ▪ Memory is key for the performance and stability of Spark jobs ▪ Java OOM (out of memory) errors can be hard to troubleshoot ▪ We want to allocate the needed memory, not overshooting/wasting ▪ New “Executor Metrics” in Spark 3.0 ▪ Measure details of memory usage by memory component ▪ Peak values measurements (you get OOM on peak allocation not average) ▪ Spark Metrics System: report memory metrics as time series
  • 20. "peakMemoryMetrics" : { "JVMHeapMemory" : 29487812552, "JVMOffHeapMemory" : 149957200, "OnHeapExecutionMemory" : 12458956272, "OffHeapExecutionMemory" : 0, "OnHeapStorageMemory" : 83578970, "OffHeapStorageMemory" : 0, "OnHeapUnifiedMemory" : 12540212490, "OffHeapUnifiedMemory" : 0, "DirectPoolMemory" : 66809076, "MappedPoolMemory" : 0, "ProcessTreeJVMVMemory" : 38084534272, "ProcessTreeJVMRSSMemory" : 36998328320, "ProcessTreePythonVMemory" : 0, "ProcessTreePythonRSSMemory" : 0, "ProcessTreeOtherVMemory" : 0, "ProcessTreeOtherRSSMemory" : 0, "MinorGCCount" : 561, "MinorGCTime" : 49918, "MajorGCCount" : 0, "MajorGCTime" : 0 }, REST API: peak memory usage values per executor WebUI URL + /api/v1/applications/<application_id>/executors Extra tunables: spark.executor.processTreeMetrics.enabled=true spark.executor.metrics.pollingInterval=<time in ms> Executor Metrics, REST API
  • 21. Spark Memory Allocations ▪ Bullet 1 ▪ Sub-bullet ▪ Sub-bullet ▪ Bullet 2 ▪ Sub-bullet ▪ Sub-bullet ▪ Bullet 3 ▪ Sub-bullet ▪ Sub-bullet
  • 22. Memory Monitoring Graphs in the Dashboard Memory metrics as time series Dashboard: Visualize memory usage over time Details of on-heap, unified memory, etc Compare with other metrics Correlate with jobs/sql start time
  • 23. Custom Monitoring with Spark Plugins ▪ Spark 3.0 Plugins ▪ Plugins are executed at the startup of executors and the driver ▪ Plugins allow to extend Spark metrics with custom code and instrumentation ▪ Examples of monitoring enhancements with plugins ▪ Cloud Storage monitoring (S3A, GS, WASBS, OCI, CERN’s ROOT, etc) ▪ Improved HDFS monitoring ▪ OS metrics: cgroup metrics for Spark on Kubernetes ▪ Custom application metrics
  • 24. Plugins Extend Spark Metrics ▪ Custom metrics for instrumentation or debugging ▪ Metrics from libraries/packages on top of Apache Spark ▪ Spark Plugins provide: ▪ API for integrating custom instrumentation with the rest of the Spark monitoring ExecutorPackage Plugin Plugin registers extra metrics using package API Extra metrics join the Spark metrics stream JVM Metrics Sink
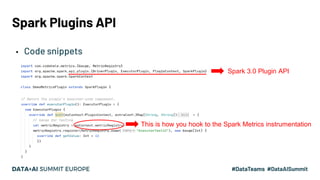
  • 25. Spark Plugins API ▪ Code snippets Spark 3.0 Plugin API This is how you hook to the Spark Metrics instrumentation
  • 26. Getting Started with Spark Plugins ▪ From https://github.com/cerndb/SparkPlugins ▪ Plugins for demo + plugins for Cloud I/O and OS monitoring ▪ RunOSCommandPlugin runs an OS command at executor startup ▪ DemoMetricsPlugin show how to integrate with Spark Metrics • bin/spark-shell –master yarn • --packages ch.cern.sparkmeasure:spark-plugins_2.12:0.1 • --conf spark.plugins=ch.cern.RunOSCommandPlugin, • ch.cern.DemoMetricsPlugin
  • 27. Measuring OS and Container Metrics ▪ Example of how to measure OS metrics from cgroup instrumentation ▪ Useful for Spark on K8S ▪ Brings together OS metrics with other Spark-workload metrics ▪ By default Apache Spark instruments only CPU usage bin/spark-shell --master k8s://https://<K8S URL>:6443 --packages ch.cern.sparkmeasure:spark-plugins_2.12:0.1 --conf spark.kubernetes.container.image=<registry>/spark:v310-SNAP --conf spark.plugins=ch.cern.CgroupMetrics ...
  • 28. Cgroups Metrics – Use for Spark on K8S ▪ Metrics implemented (gauges), with prefix ch.cern.CgroupMetrics: ▪ CPUTimeNanosec: CPU time used by the processes in the cgroup ▪ this includes CPU used in Python ▪ MemoryRss: number of bytes of anonymous and swap cache memory. ▪ MemorySwap: number of bytes of swap usage. ▪ MemoryCache: number of bytes of page cache memory. ▪ NetworkBytesIn: network traffic inbound. ▪ NetworkBytesOut: network traffic outbound.
  • 29. • docker run --network=host -d lucacanali/spark-dashboard:v01 • bin/spark-shell --master k8s://https:... • --packages ch.cern.sparkmeasure:spark-plugins_2.12:0.1 • --conf spark.plugins=ch.cern.CgroupMetrics • --conf "spark.metrics.conf.*.sink.graphite.class"="org.apache.spark. metrics.sink.GraphiteSink" • --conf "spark.metrics.conf.*.sink.graphite.host"=`hostname` • --conf "spark.metrics.conf.*.sink.graphite.port"=2003 • --conf "spark.metrics.conf.*.sink.graphite.period"=10 • --conf "spark.metrics.conf.*.sink.graphite.unit"=seconds • --conf "spark.metrics.conf.*.sink.graphite.prefix"="luca" Example: Dashboard for Spark on K8S Network bytes (in) vs. time
  • 30. • docker run --network=host -d lucacanali/spark-dashboard:v01 • bin/spark-shell --master k8s://https:... • --packages ch.cern.sparkmeasure:spark-plugins_2.12:0.1 • --conf spark.plugins=ch.cern.CgroupMetrics • --conf "spark.metrics.conf.*.sink.graphite.class"="org.apache.spark. metrics.sink.GraphiteSink" • --conf "spark.metrics.conf.*.sink.graphite.host"=`hostname` • --conf "spark.metrics.conf.*.sink.graphite.port"=2003 • --conf "spark.metrics.conf.*.sink.graphite.period"=10 • --conf "spark.metrics.conf.*.sink.graphite.unit"=seconds • --conf "spark.metrics.conf.*.sink.graphite.prefix"="luca" Example: Dashboard for Spark on K8S Network bytes (in) vs. time
  • 31. Measuring S3A and other Cloud Filesystems ▪ Example of how to measure S3A throughput metrics ▪ Note: Apache Spark instruments only HDFS and local filesystem ▪ Plugins uses HDFS client API for Hadoop Compatible filesystems ▪ Metrics: bytesRead, bytesWritten, readOps, writeOps --conf spark.plugins=ch.cern.CloudFSMetrics --conf spark.cernSparkPlugin.cloudFsName=<name of the filesystem> (example: "s3a", "gs", "wasbs", "oci", "root", etc.) S3A bytes read vs. time
  • 32. Measuring S3A and other Cloud Filesystems ▪ Example of how to measure S3A throughput metrics ▪ Note: Apache Spark instruments only HDFS and local filesystem ▪ Plugins uses HDFS client API for Hadoop Compatible filesystems ▪ Metrics: bytesRead, bytesWritten, readOps, writeOps --conf spark.plugins=ch.cern.CloudFSMetrics --conf spark.cernSparkPlugin.cloudFsName=<name of the filesystem> (example: "s3a", "gs", "wasbs", "oci", "root", etc.) S3A bytes read vs. time
  • 33. Experimental: Measuring I/O Time ▪ Plugins used to measure I/O read time with HDFS and S3A ▪ Use for advanced troubleshooting ▪ Also example of plugins used to instrument custom libraries ▪ Plugin: --conf spark.plugins=ch.cern.experimental.S3ATimeInstrumentation ▪ Custom S3A jar with time instrumentation: https://github.com/LucaCanali/hadoop/tree/s3aAndHDFSTimeInstrumentation ▪ Metrics: S3AReadTimeMuSec, S3ASeekTimeMuSec, S3AGetObjectMetadataMuSec
  • 34. SQL Monitoring Improvements in Spark 3.0 ▪ Improved SQL Metrics and SQL tab execution plan visualization ▪ Improved SQL metrics instrumentation ▪ SQL metrics documented at https://spark.apache.org/docs/latest/web- ui.html#sql-metrics ▪ Improved execution plan visualization and available metrics Improved metrics list for shuffle operations Added Codegen IdImproved stats visualization + info on max value
  • 35. More Monitoring Improvements in Spark 3.0 ▪ Spark Streaming tab ▪ Metrics and graphs ▪ New Structured Streaming UI (SPARK-29543) ▪ Experimental support for Prometheus ▪ REST API: /metrics/executors/Prometheus conditional to spark.ui.prometheus.enabled=true ▪ Improved documentation ▪ New: Web UI doc https://spark.apache.org/docs/latest/web-ui.html ▪ Monitoring doc: https://spark.apache.org/docs/latest/monitoring.html
  • 37. Community Effort What You Can Do To Improve Spark Monitoring ▪ (developers) Tooling: Improving Spark Metrics and instrumentation ▪ Sink for InfluxDB and Prometheus ▪ Further instrument Spark core and ecosystem (ex: I/O time, Python UDF) ▪ Develop and share plugins: instrument libraries, OS metrics (GPUs), etc ▪ (product experts) Methods: root-cause performance analysis ▪ Use metrics and graphs for troubleshooting and root-cause analysis ▪ Adopt tools and methods to your platform/users ▪ (innovators) Holy Grail of Monitoring: ▪ Building automated (AI) systems that can perform root-cause analysis and autotune data/database systems
  • 38. Improvements Expected in Spark 3.1 and WIP ▪ [SPARK-27142] New SQL REST API ▪ [SPARK-32119] Plugins can be distributed with –-jars and –packages on YARN, this adds support for K8S and Standalone ▪ [SPARK-33088] Enhance Executor Plugin API to include callbacks on task start and end events ▪ [SPARK-23431] Expose stage level peak executor metrics via REST API ▪ [SPARK-30985] Support propagating SPARK_CONF_DIR files to driver and executor pods ▪ [SPARK-31711] Executor metrics in local mode ▪ WIP [SPARK-30306] Python execution time instrumentation ▪ WIP on Hadoop (targeting Hadoop 3.4) ▪ [HADOOP-16830] Add public IOStatistics API
  • 39. Conclusions ▪ Monitoring and instrumentation improvements: ▪ One more reason to upgrade to Apache Spark 3.0 ▪ Memory monitoring with Executor Metrics in Spark 3.0 ▪ Help troubleshooting and preventing OOM ▪ Spark Plugin API ▪ Use to measure Cloud FileSystems I/O, OS and container metrics ▪ Use to build your custom application metrics ▪ Build and share! ▪ Web UI, streaming and Spark SQL monitoring also improved
  • 40. Acknowledgements and Links • Thanks to colleagues at CERN, Hadoop and Spark service • Thanks to Apache Spark committers and community – For their help with JIRAs and PRs: SPARK-26928, SPARK-27189, SPARK- 28091, SPARK-29654, SPARK-30041, SPARK-30775 • Links: – Executor Metrics and memory monitoring: SPARK-23429 and SPARK-27189 – Spark Plugins: SPARK-29397, SPARK-28091 – https://db-blog.web.cern.ch/blog/luca-canali/2020-08-spark3-memory- monitoring – https://github.com/LucaCanali/sparkMeasure – https://github.com/cerndb/spark-dashboard – https://github.com/cerndb/SparkPlugins
  • 41. Feedback Your feedback is important to us. Don’t forget to rate and review the sessions.