SlideShare a Scribd company logo
An Interactive Introduction to RNovember 2009Michael E. Driscoll, Ph.D.med@dataspora.comhttp://www.dataspora.comDaniel Murphy FCAS, MAAAdmurphy@trinostics.com
January 6, 2009
An Interactive Introduction To R (Programming Language For Statistics)
R is a tool for…Data Manipulationconnecting to data sourcesslicing & dicing dataModeling & Computationstatistical modelingnumerical simulationData Visualizationvisualizing fit of modelscomposing statistical graphics
R is an environment
Its interface is plain
Let’s take a tour of some claim datain R
Let’s take a tour of some claim datain R## load in some Insurance Claim datalibrary(MASS)data(Insurance)Insurance <- edit(Insurance)head(Insurance)dim(Insurance)## plot it nicely using the ggplot2 packagelibrary(ggplot2)qplot(Group, Claims/Holders,      data=Insurance,geom="bar",      stat='identity',      position="dodge",      facets=District ~ .,      fill=Age,ylab="Claim Propensity",xlab="Car Group")## hypothesize a relationship between Age ~ Claim Propensity## visualize this hypothesis with a boxplotx11()library(ggplot2)qplot(Age, Claims/Holders,      data=Insurance,geom="boxplot",      fill=Age)## quantify the hypothesis with linear modelm <- lm(Claims/Holders ~ Age + 0, data=Insurance)summary(m)
R is “an overgrown calculator”sum(rgamma(rpois(1,lambda=2),shape=49,scale=.2)))
R is “an overgrown calculator”simple math> 2+24storing results in variables> x <- 2+2    ## ‘<-’ is R syntax for ‘=’ or assignment> x^2 16vectorized math> weight <- c(110, 180, 240)      ## three weights> height <- c(5.5, 6.1, 6.2)      ## three heights> bmi <- (weight*4.88)/height^2   ## divides element-wise17.7  23.6  30.4
R is “an overgrown calculator”basic statisticsmean(weight) 	   sd(weight)		sqrt(var(weight))176.6             65.0			65.0  # same as sdset functionsunion		   intersect		 setdiffadvanced statistics   > pbinom(40, 100, 0.5)  ##  P that a coin tossed 100 times   0.028##  that comes up 40 heads is ‘fair’   > pshare <- pbirthday(23, 365, coincident=2)   0.530  ## probability that among 23 people, two share a birthday
Try It! #1 Overgrown Calculatorbasic calculations> 2 + 2       [Hit ENTER]> log(100)    [Hit ENTER]calculate the value of $100 after 10 years at 5%> 100 * exp(0.05*10) [Hit ENTER]construct a vector & do a vectorized calculation> year <- (1,2,5,10,25)  [Hit ENTER]   this returns an error.  why?> year <- c(1,2,5,10,25) [Hit ENTER]> 100 * exp(0.05*year)   [Hit ENTER]
R is a numerical simulator built-in functions for classical probability distributions
let’s simulate 10,000 trials of 100 coin flips.  what’s the distribution of heads?> heads <- rbinom(10^5,100,0.50)> hist(heads)
Functions for Probability Distributions> pnorm(0) 	0.05 > qnorm(0.9) 	1.28> rnorm(100) 	vector of length 100
Functions for Probability DistributionsHow to find the functions for lognormal distribution?  1) Use the double question mark ‘??’ to search> ??lognormal2) Then identify the package > ?Lognormal3) Discover the dist functions  dlnorm, plnorm, qlnorm, rlnorm
Try It! #2 Numerical Simulationsimulate 1m policy holders from which we expect 4 claims> numclaims <- rpois(n, lambda)(hint: use ?rpoisto understand the parameters)verify the mean & variance are reasonable> mean(numclaims)> var(numclaims)visualize the distribution of claim counts> hist(numclaims)
Getting Data In	- from Files> Insurance <- read.csv(“Insurance.csv”,header=TRUE)	  from Databases> con <- dbConnect(driver,user,password,host,dbname)> Insurance <- dbSendQuery(con, “SELECT * FROM claims”)	  from the Web> con <- url('http://labs.dataspora.com/test.txt')> Insurance <- read.csv(con, header=TRUE)	   from R objects> load(‘Insurance.RData’)
Getting Data Outto Fileswrite.csv(Insurance,file=“Insurance.csv”)to Databasescon <- dbConnect(dbdriver,user,password,host,dbname)dbWriteTable(con, “Insurance”, Insurance)     to R Objectssave(Insurance, file=“Insurance.RData”)
Navigating within the R environmentlisting all variables> ls()examining a variable ‘x’> str(x)> head(x)> tail(x)> class(x)removing variables> rm(x)> rm(list=ls())    # remove everything
Try It! #3 Data Processing load data & view itlibrary(MASS)head(Insurance)  ## the first 7 rowsdim(Insurance)   ## number of rows & columnswrite it outwrite.csv(Insurance,file=“Insurance.csv”, row.names=FALSE)getwd()  ## where am I?view it in Excel, make a change, save it	 remove the first districtload it back in to R & plot itInsurance <- read.csv(file=“Insurance.csv”)plot(Claims/Holders ~ Age, data=Insurance)
A Swiss-Army Knife for Data
A Swiss-Army Knife for DataIndexingThree ways to index into a data framearray of integer indicesarray of character namesarray of logical BooleansExamples:df[1:3,]df[c(“New York”, “Chicago”),]df[c(TRUE,FALSE,TRUE,TRUE),]df[city == “New York”,]
A Swiss-Army Knife for Datasubset – extract subsets meeting some criteriasubset(Insurance, District==1)subset(Insurance, Claims < 20)transform – add or alter a column of a data frametransform(Insurance, Propensity=Claims/Holders)cut – cut a continuous value into groups   cut(Insurance$Claims, breaks=c(-1,100,Inf), labels=c('lo','hi'))  Put it all together: create a new, transformed data frametransform(subset(Insurance, District==1),  ClaimLevel=cut(Claims, breaks=c(-1,100,Inf),      labels=c(‘lo’,’hi’)))
A Statistical ModelerR’s has a powerful modeling syntaxModels are specified with formulae, like 			y ~ x	growth ~ sun + watermodel relationships between continuous and categorical variables.Models are also guide the visualization of relationships in a graphical form
A Statistical ModelerLinear modelm <- lm(Claims/Holders ~ Age, data=Insurance)Examine it	summary(m)Plot it	plot(m)
A Statistical ModelerLogistic model	m <- glm(Age ~ Claims/Holders, data=Insurance,         family=binomial(“logit”)))Examine it	summary(m)Plot it	plot(m)
Try It! #4 Statistical Modelingfit a linear modelm <- lm(Claims/Holders ~ Age + 0, data=Insurance) examine it summary(m)plot itplot(m)
Visualization:  Multivariate Barplotlibrary(ggplot2)qplot(Group, Claims/Holders,      data=Insurance,      geom="bar",      stat='identity',      position="dodge",      facets=District ~ .,       fill=Age)
Visualization:  Boxplotslibrary(ggplot2)qplot(Age, Claims/Holders,   data=Insurance,  geom="boxplot“)library(lattice)bwplot(Claims/Holders ~ Age,   data=Insurance)
Visualization: Histogramslibrary(ggplot2)qplot(Claims/Holders,  data=Insurance,  facets=Age ~ ., geom="density")library(lattice)densityplot(~ Claims/Holders | Age, data=Insurance, layout=c(4,1)
Try It! #5 Data Visualizationsimple line chart> x <- 1:10> y <- x^2> plot(y ~ x)box plot> library(lattice)> boxplot(Claims/Holders ~ Age, data=Insurance)visualize a linear fit> abline()
Getting Help with RHelp within R itself for a function> help(func)> ?funcFor a topic> help.search(topic)> ??topicsearch.r-project.orgGoogle Code Search  www.google.com/codesearchStack Overflow  http://stackoverflow.com/tags/RR-help list http://www.r-project.org/posting-guide.html
Six Indispensable Books on RLearning RData ManipulationVisualizationStatistical Modeling
Extending R with PackagesOver one thousand user-contributed packages are available on CRAN – the Comprehensive R Archive Networkhttp://cran.r-project.orgInstall a package from the command-line> install.packages(‘actuar’)Install a package from the GUI menu“Packages”--> “Install packages(s)”
Final Try It!Simulate a TweedieSimulate the number of claims from a Poisson distribution with λ=2 (NB: mean poisson = λ, variance poisson = λ)
For as many claims as were randomly simulated, simulate a severity from a gamma distribution with shape α=49 and scale θ=0.2 (NB: mean gamma = αθ, variance gamma = αθ2)
Is the total simulated claim amount close to expected?
Calculate usual parameterization (μ,p,φ)of this Tweedie distribution
Extra credit:
Repeat the above 10000 times.
Does your histogram look like Glenn Meyers’?http://www.casact.org/newsletter/index.cfm?fa=viewart&id=5756Final Try It!Simulate a Tweedie- ANSWERSSimulate the number of claims from a Poisson distribution with λ=2 (NB: mean poisson = λ, variance poisson = λ)rpois(1,lambda=2)For as many claims as were randomly simulated, simulate a severity from a gamma distribution with shape α=49 and scale θ=0.2rgamma(rpois(1,lambda=2),shape=49,scale=.2)Is the total simulated claim amount close to expected?  sum(rgamma(rpois(1,lambda=2),shape=49,scale=.2))     Repeat the above 10000 times  replicate(10000,    sum(rgamma(rpois(1,lambda=2),shape=49,scale=.2)))    Visualize the distributionhist(replicate(10000,    sum(rgamma(rpois(1,lambda=2),shape=49,scale=.2))),    breaks=200, freq=FALSE)
P&C Actuarial ModelsDesign • Construction Collaboration • Education Valuable • Transparent Daniel Murphy, FCAS, MAAAdmurphy@trinostics.com925.381.9869From Data to DecisionBig Data • Analytics • Visualizationwww.dataspora.comMichael E. Driscoll, Ph.D.med@dataspora.com415.860.434737Contact Us
AppendicesR as a Programming LanguageAdvanced VisualizationEmbedding R in a Server Environment
R as a Programming Languagefibonacci <- function(n) {  fib <- numeric(n)  fib [1:2] <- 1  for (i in 3:n) {       fib[i] <- fib[i-1] + fib[i-2]  }  return(fib[n])}Image from cover of Abelson & Sussman’stextThe Structure and Interpretation of Computer Languages
Assignmentx <- c(1,2,6)x		 a variable x<-	 R’s assignment operator, equivalent to ‘=‘ c(	 a function c which combines its arguments into a vectory <- c(‘apples’,’oranges’)z <- c(TRUE,FALSE)	c(TRUE,FALSE) -> zThese are also valid assignment statements.
Function CallsThere are ~ 1100 built-in commands in the R “base” package, which can be executed on the command-line.  The basic structure of a call is thus:output <- function(arg1, arg2, …)Arithmetic Operations +  -  *  /  ^R functions are typically vectorized		x <- x/3	works whether x is a one or many-valued vector
Data Structures in Rnumericx <- c(0,2:4)vectorsCharactery <- c(“alpha”, “b”, “c3”, “4”)logicalz <- c(1, 0, TRUE, FALSE)> class(x)[1] "numeric"> x2 <- as.logical(x)> class(x2)[1] “logical”
Data Structures in Rlistslst <- list(x,y,z)objectsmatricesM <- matrix(rep(x,3),ncol=3)data frames*df <- data.frame(x,y,z)> class(df)[1] “data.frame"
Summary of Data Structures?matricesvectorsdata frames*lists
Advanced Visualizationlattice, ggplot2, and colorspace
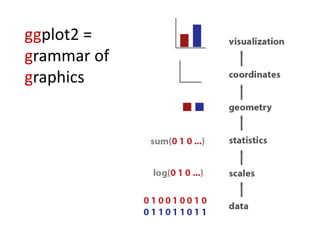
ggplot2 =grammar of graphics
ggplot2 =grammar ofgraphics
qplot(log(carat), log(price), data = diamonds, alpha=I(1/20)) + facet_grid(. ~ color)Achieving small multiples with “facets”
lattice = trellis(source: http://lmdvr.r-forge.r-project.org )
list of latticefunctionsdensityplot(~ speed | type, data=pitch)
visualizing six dimensionsof MLB pitches with lattice
xyplot(x ~ y | type, data=pitch,fill.color = pitch$color,panel = function(x,y, fill.color, …, subscripts) {  fill <- fill.color[subscripts]panel.xyplot(x, y, fill= fill, …) })
Beautiful Colors with Colorspacelibrary(“Colorspace”)red <- LAB(50,64,64)blue <- LAB(50,-48,-48)mixcolor(10, red, blue)
efficient plotting with hexbinplothexbinplot(log(price)~log(carat),data=diamonds,xbins=40)
Ad

Recommended

PDF
Software Testing and Quality Assurance Assignment 2
Gurpreet singh
 
PDF
Introduction to data analysis using R
Victoria López
 
PPTX
Software Reliability
Gurkamal Rakhra
 
PPT
Software Process Improvement
Bilal Shah
 
PPTX
2. R-basics, Vectors, Arrays, Matrices, Factors
krishna singh
 
PPTX
Software quality
Sara Mehmood
 
PPTX
Unit1 principle of programming language
Vasavi College of Engg
 
PDF
Software reliability models error seeding model and failure model-iv
Gurbakash Phonsa
 
PPT
R programming slides
Pankaj Saini
 
PPTX
Introduction to formal methods lecture notes
JikAlvin
 
PPT
Software Testing Strategies
NayyabMirTahir
 
PPTX
Cloud Computing - An Emerging Technology & Cloud Computing Models
VR Talsaniya
 
PDF
Introduction to Recurrent Neural Network
Knoldus Inc.
 
PDF
Project Planning in Software Engineering
Fáber D. Giraldo
 
PDF
Data analytics using R programming
Umang Singh
 
PPT
1.2 Kernel Data Structures.ppt
AKILARANIM
 
PPT
Software quality
jagadeesan
 
PPTX
Data Structure and Algorithms.pptx
Syed Zaid Irshad
 
PPT
Multi-Layer Perceptrons
ESCOM
 
PPTX
Unit 1 - R Programming (Part 2).pptx
Malla Reddy University
 
PPT
Software reliability
Anand Kumar
 
PPT
Pressman ch-3-prescriptive-process-models
saurabhshertukde
 
PPT
Software Configuration Management.ppt
DrTThendralCompSci
 
PPTX
Formal Approaches to SQA.pptx
KarthigaiSelviS3
 
PPTX
Software quality assurance
Aman Adhikari
 
PPT
Software Quality Assurance
Sachithra Gayan
 
PPT
CS8494 SOFTWARE ENGINEERING Unit-2
SIMONTHOMAS S
 
PDF
How to Plug a Leaky Sales Funnel With Facebook Retargeting
Digital Marketer
 
PDF
10 Mobile Marketing Campaigns That Went Viral and Made Millions
Mark Fidelman
 

More Related Content

What's hot (20)

PDF
Software reliability models error seeding model and failure model-iv
Gurbakash Phonsa
 
PPT
R programming slides
Pankaj Saini
 
PPTX
Introduction to formal methods lecture notes
JikAlvin
 
PPT
Software Testing Strategies
NayyabMirTahir
 
PPTX
Cloud Computing - An Emerging Technology & Cloud Computing Models
VR Talsaniya
 
PDF
Introduction to Recurrent Neural Network
Knoldus Inc.
 
PDF
Project Planning in Software Engineering
Fáber D. Giraldo
 
PDF
Data analytics using R programming
Umang Singh
 
PPT
1.2 Kernel Data Structures.ppt
AKILARANIM
 
PPT
Software quality
jagadeesan
 
PPTX
Data Structure and Algorithms.pptx
Syed Zaid Irshad
 
PPT
Multi-Layer Perceptrons
ESCOM
 
PPTX
Unit 1 - R Programming (Part 2).pptx
Malla Reddy University
 
PPT
Software reliability
Anand Kumar
 
PPT
Pressman ch-3-prescriptive-process-models
saurabhshertukde
 
PPT
Software Configuration Management.ppt
DrTThendralCompSci
 
PPTX
Formal Approaches to SQA.pptx
KarthigaiSelviS3
 
PPTX
Software quality assurance
Aman Adhikari
 
PPT
Software Quality Assurance
Sachithra Gayan
 
PPT
CS8494 SOFTWARE ENGINEERING Unit-2
SIMONTHOMAS S
 
Software reliability models error seeding model and failure model-iv
Gurbakash Phonsa
 
R programming slides
Pankaj Saini
 
Introduction to formal methods lecture notes
JikAlvin
 
Software Testing Strategies
NayyabMirTahir
 
Cloud Computing - An Emerging Technology & Cloud Computing Models
VR Talsaniya
 
Introduction to Recurrent Neural Network
Knoldus Inc.
 
Project Planning in Software Engineering
Fáber D. Giraldo
 
Data analytics using R programming
Umang Singh
 
1.2 Kernel Data Structures.ppt
AKILARANIM
 
Software quality
jagadeesan
 
Data Structure and Algorithms.pptx
Syed Zaid Irshad
 
Multi-Layer Perceptrons
ESCOM
 
Unit 1 - R Programming (Part 2).pptx
Malla Reddy University
 
Software reliability
Anand Kumar
 
Pressman ch-3-prescriptive-process-models
saurabhshertukde
 
Software Configuration Management.ppt
DrTThendralCompSci
 
Formal Approaches to SQA.pptx
KarthigaiSelviS3
 
Software quality assurance
Aman Adhikari
 
Software Quality Assurance
Sachithra Gayan
 
CS8494 SOFTWARE ENGINEERING Unit-2
SIMONTHOMAS S
 

Viewers also liked (20)

PDF
How to Plug a Leaky Sales Funnel With Facebook Retargeting
Digital Marketer
 
PDF
10 Mobile Marketing Campaigns That Went Viral and Made Millions
Mark Fidelman
 
PDF
Intro to Facebook Ads
Ximena Sanchez
 
PDF
The Beginners Guide to Startup PR #startuppr
Onboardly
 
PDF
Lean Community Building: Getting the Most Bang for Your Time & Money
Jennifer Lopez
 
PPTX
Some Advanced Remarketing Ideas
Chris Thomas
 
PPTX
The Science behind Viral marketing
David Skok
 
PPTX
Google Analytics Fundamentals: Set Up and Basics for Measurement
Orbit Media Studios
 
PDF
HTML & CSS Masterclass
Bernardo Raposo
 
PDF
How Top Brands Use Referral Programs to Drive Customer Acquisition
Kissmetrics on SlideShare
 
PPTX
LinkedIn Ads Platform Master Class
LinkedIn
 
PPTX
The Science of Marketing Automation
HubSpot
 
PDF
Mastering Google Adwords In 30 Minutes
Nik Cree
 
PDF
A Guide to User Research (for People Who Don't Like Talking to Other People)
Stephanie Wills
 
PPTX
Brenda Spoonemore - A biz dev playbook for startups: Why, when and how to do ...
GeekWire
 
PDF
The Essentials of Community Building by Mack Fogelson
Mackenzie Fogelson
 
PDF
User experience doesn't happen on a screen: It happens in the mind.
John Whalen
 
PDF
No excuses user research
Lily Dart
 
PDF
10 Ways You're Using AdWords Wrong and How to Correct Those Practices
Kissmetrics on SlideShare
 
PDF
Stop Leaving Money on the Table! Optimizing your Site for Users and Revenue
Josh Patrice
 
How to Plug a Leaky Sales Funnel With Facebook Retargeting
Digital Marketer
 
10 Mobile Marketing Campaigns That Went Viral and Made Millions
Mark Fidelman
 
Intro to Facebook Ads
Ximena Sanchez
 
The Beginners Guide to Startup PR #startuppr
Onboardly
 
Lean Community Building: Getting the Most Bang for Your Time & Money
Jennifer Lopez
 
Some Advanced Remarketing Ideas
Chris Thomas
 
The Science behind Viral marketing
David Skok
 
Google Analytics Fundamentals: Set Up and Basics for Measurement
Orbit Media Studios
 
HTML & CSS Masterclass
Bernardo Raposo
 
How Top Brands Use Referral Programs to Drive Customer Acquisition
Kissmetrics on SlideShare
 
LinkedIn Ads Platform Master Class
LinkedIn
 
The Science of Marketing Automation
HubSpot
 
Mastering Google Adwords In 30 Minutes
Nik Cree
 
A Guide to User Research (for People Who Don't Like Talking to Other People)
Stephanie Wills
 
Brenda Spoonemore - A biz dev playbook for startups: Why, when and how to do ...
GeekWire
 
The Essentials of Community Building by Mack Fogelson
Mackenzie Fogelson
 
User experience doesn't happen on a screen: It happens in the mind.
John Whalen
 
No excuses user research
Lily Dart
 
10 Ways You're Using AdWords Wrong and How to Correct Those Practices
Kissmetrics on SlideShare
 
Stop Leaving Money on the Table! Optimizing your Site for Users and Revenue
Josh Patrice
 
Ad

Similar to An Interactive Introduction To R (Programming Language For Statistics) (20)

PDF
R decision tree
Learnbay Datascience
 
PPT
3.pointers in c programming language.ppt
anithachristopher3
 
PDF
ITB Term Paper - 10BM60066
rahulsm27
 
PPTX
Decision Tree.pptx
Ramakrishna Reddy Bijjam
 
PPTX
software engineering modules iii & iv.pptx
rani marri
 
PDF
Data Exploration with Apache Drill: Day 2
Charles Givre
 
PPT
R studio
Kinza Irshad
 
PDF
NCCU: Statistics in the Criminal Justice System, R basics and Simulation - Pr...
The Statistical and Applied Mathematical Sciences Institute
 
PDF
RDataMining slides-regression-classification
Yanchang Zhao
 
PDF
Efficient equity portfolios using mean variance optimisation in R
Gregg Barrett
 
PDF
Introduction to programming c and data-structures
Pradipta Mishra
 
PDF
Introduction to programming c and data structures
Pradipta Mishra
 
PPTX
ExploringPrimsAlgorithmforMinimumSpanningTreesinC.pptx
naufalmaulana43
 
PDF
Forecasting Network Capacity for Global Enterprise Backbone Networks using Ma...
IJCI JOURNAL
 
PDF
Econometria aplicada com dados em painel
Adriano Figueiredo
 
PPT
Chris Mc Glothen Sql Portfolio
clmcglothen
 
DOCX
PorfolioReport
Albert Chu
 
PDF
Pumps, Compressors and Turbine Fault Frequency Analysis
University of Illinois,Chicago
 
PDF
Regression and Classification with R
Yanchang Zhao
 
R decision tree
Learnbay Datascience
 
3.pointers in c programming language.ppt
anithachristopher3
 
ITB Term Paper - 10BM60066
rahulsm27
 
Decision Tree.pptx
Ramakrishna Reddy Bijjam
 
software engineering modules iii & iv.pptx
rani marri
 
Data Exploration with Apache Drill: Day 2
Charles Givre
 
R studio
Kinza Irshad
 
NCCU: Statistics in the Criminal Justice System, R basics and Simulation - Pr...
The Statistical and Applied Mathematical Sciences Institute
 
RDataMining slides-regression-classification
Yanchang Zhao
 
Efficient equity portfolios using mean variance optimisation in R
Gregg Barrett
 
Introduction to programming c and data-structures
Pradipta Mishra
 
Introduction to programming c and data structures
Pradipta Mishra
 
ExploringPrimsAlgorithmforMinimumSpanningTreesinC.pptx
naufalmaulana43
 
Forecasting Network Capacity for Global Enterprise Backbone Networks using Ma...
IJCI JOURNAL
 
Econometria aplicada com dados em painel
Adriano Figueiredo
 
Chris Mc Glothen Sql Portfolio
clmcglothen
 
PorfolioReport
Albert Chu
 
Pumps, Compressors and Turbine Fault Frequency Analysis
University of Illinois,Chicago
 
Regression and Classification with R
Yanchang Zhao
 
Ad

Recently uploaded (20)

PPTX
OBSESSIVE COMPULSIVE DISORDER.pptx IN 5TH SEMESTER B.SC NURSING, 2ND YEAR GNM...
parmarjuli1412
 
PPTX
Tanja Vujicic - PISA for Schools contact Info
EduSkills OECD
 
PPTX
How to Manage Different Customer Addresses in Odoo 18 Accounting
Celine George
 
PPTX
A Visual Introduction to the Prophet Jeremiah
Steve Thomason
 
PPTX
Birnagar High School Platinum Jubilee Quiz.pptx
Sourav Kr Podder
 
PPTX
How to use search fetch method in Odoo 18
Celine George
 
PPT
M&A5 Q1 1 differentiate evolving early Philippine conventional and contempora...
ErlizaRosete
 
PPTX
How to Add New Item in CogMenu in Odoo 18
Celine George
 
PDF
English 3 Quarter 1_LEwithLAS_Week 1.pdf
DeAsisAlyanajaneH
 
PPTX
Wage and Salary Computation.ppt.......,x
JosalitoPalacio
 
PPTX
Peer Teaching Observations During School Internship
AjayaMohanty7
 
PPTX
How to Customize Quotation Layouts in Odoo 18
Celine George
 
PDF
Learning Styles Inventory for Senior High School Students
Thelma Villaflores
 
PPTX
2025 June Year 9 Presentation: Subject selection.pptx
mansk2
 
PDF
Romanticism in Love and Sacrifice An Analysis of Oscar Wilde’s The Nightingal...
KaryanaTantri21
 
PPTX
LAZY SUNDAY QUIZ "A GENERAL QUIZ" JUNE 2025 SMC QUIZ CLUB, SILCHAR MEDICAL CO...
Ultimatewinner0342
 
PDF
VCE Literature Section A Exam Response Guide
jpinnuck
 
PDF
This is why students from these 44 institutions have not received National Se...
Kweku Zurek
 
PDF
THE PSYCHOANALYTIC OF THE BLACK CAT BY EDGAR ALLAN POE (1).pdf
nabilahk908
 
PPTX
Values Education 10 Quarter 1 Module .pptx
JBPafin
 
OBSESSIVE COMPULSIVE DISORDER.pptx IN 5TH SEMESTER B.SC NURSING, 2ND YEAR GNM...
parmarjuli1412
 
Tanja Vujicic - PISA for Schools contact Info
EduSkills OECD
 
How to Manage Different Customer Addresses in Odoo 18 Accounting
Celine George
 
A Visual Introduction to the Prophet Jeremiah
Steve Thomason
 
Birnagar High School Platinum Jubilee Quiz.pptx
Sourav Kr Podder
 
How to use search fetch method in Odoo 18
Celine George
 
M&A5 Q1 1 differentiate evolving early Philippine conventional and contempora...
ErlizaRosete
 
How to Add New Item in CogMenu in Odoo 18
Celine George
 
English 3 Quarter 1_LEwithLAS_Week 1.pdf
DeAsisAlyanajaneH
 
Wage and Salary Computation.ppt.......,x
JosalitoPalacio
 
Peer Teaching Observations During School Internship
AjayaMohanty7
 
How to Customize Quotation Layouts in Odoo 18
Celine George
 
Learning Styles Inventory for Senior High School Students
Thelma Villaflores
 
2025 June Year 9 Presentation: Subject selection.pptx
mansk2
 
Romanticism in Love and Sacrifice An Analysis of Oscar Wilde’s The Nightingal...
KaryanaTantri21
 
LAZY SUNDAY QUIZ "A GENERAL QUIZ" JUNE 2025 SMC QUIZ CLUB, SILCHAR MEDICAL CO...
Ultimatewinner0342
 
VCE Literature Section A Exam Response Guide
jpinnuck
 
This is why students from these 44 institutions have not received National Se...
Kweku Zurek
 
THE PSYCHOANALYTIC OF THE BLACK CAT BY EDGAR ALLAN POE (1).pdf
nabilahk908
 
Values Education 10 Quarter 1 Module .pptx
JBPafin
 

An Interactive Introduction To R (Programming Language For Statistics)

  • 1. An Interactive Introduction to RNovember 2009Michael E. Driscoll, [email protected]://www.dataspora.comDaniel Murphy FCAS, [email protected]
  • 4. R is a tool for…Data Manipulationconnecting to data sourcesslicing & dicing dataModeling & Computationstatistical modelingnumerical simulationData Visualizationvisualizing fit of modelscomposing statistical graphics
  • 5. R is an environment
  • 7. Let’s take a tour of some claim datain R
  • 8. Let’s take a tour of some claim datain R## load in some Insurance Claim datalibrary(MASS)data(Insurance)Insurance <- edit(Insurance)head(Insurance)dim(Insurance)## plot it nicely using the ggplot2 packagelibrary(ggplot2)qplot(Group, Claims/Holders, data=Insurance,geom="bar", stat='identity', position="dodge", facets=District ~ ., fill=Age,ylab="Claim Propensity",xlab="Car Group")## hypothesize a relationship between Age ~ Claim Propensity## visualize this hypothesis with a boxplotx11()library(ggplot2)qplot(Age, Claims/Holders, data=Insurance,geom="boxplot", fill=Age)## quantify the hypothesis with linear modelm <- lm(Claims/Holders ~ Age + 0, data=Insurance)summary(m)
  • 9. R is “an overgrown calculator”sum(rgamma(rpois(1,lambda=2),shape=49,scale=.2)))
  • 10. R is “an overgrown calculator”simple math> 2+24storing results in variables> x <- 2+2 ## ‘<-’ is R syntax for ‘=’ or assignment> x^2 16vectorized math> weight <- c(110, 180, 240) ## three weights> height <- c(5.5, 6.1, 6.2) ## three heights> bmi <- (weight*4.88)/height^2 ## divides element-wise17.7 23.6 30.4
  • 11. R is “an overgrown calculator”basic statisticsmean(weight) sd(weight) sqrt(var(weight))176.6 65.0 65.0 # same as sdset functionsunion intersect setdiffadvanced statistics > pbinom(40, 100, 0.5) ## P that a coin tossed 100 times 0.028## that comes up 40 heads is ‘fair’ > pshare <- pbirthday(23, 365, coincident=2) 0.530 ## probability that among 23 people, two share a birthday
  • 12. Try It! #1 Overgrown Calculatorbasic calculations> 2 + 2 [Hit ENTER]> log(100) [Hit ENTER]calculate the value of $100 after 10 years at 5%> 100 * exp(0.05*10) [Hit ENTER]construct a vector & do a vectorized calculation> year <- (1,2,5,10,25) [Hit ENTER] this returns an error. why?> year <- c(1,2,5,10,25) [Hit ENTER]> 100 * exp(0.05*year) [Hit ENTER]
  • 13. R is a numerical simulator built-in functions for classical probability distributions
  • 14. let’s simulate 10,000 trials of 100 coin flips. what’s the distribution of heads?> heads <- rbinom(10^5,100,0.50)> hist(heads)
  • 15. Functions for Probability Distributions> pnorm(0) 0.05 > qnorm(0.9) 1.28> rnorm(100) vector of length 100
  • 16. Functions for Probability DistributionsHow to find the functions for lognormal distribution? 1) Use the double question mark ‘??’ to search> ??lognormal2) Then identify the package > ?Lognormal3) Discover the dist functions dlnorm, plnorm, qlnorm, rlnorm
  • 17. Try It! #2 Numerical Simulationsimulate 1m policy holders from which we expect 4 claims> numclaims <- rpois(n, lambda)(hint: use ?rpoisto understand the parameters)verify the mean & variance are reasonable> mean(numclaims)> var(numclaims)visualize the distribution of claim counts> hist(numclaims)
  • 18. Getting Data In - from Files> Insurance <- read.csv(“Insurance.csv”,header=TRUE) from Databases> con <- dbConnect(driver,user,password,host,dbname)> Insurance <- dbSendQuery(con, “SELECT * FROM claims”) from the Web> con <- url('http://labs.dataspora.com/test.txt')> Insurance <- read.csv(con, header=TRUE) from R objects> load(‘Insurance.RData’)
  • 19. Getting Data Outto Fileswrite.csv(Insurance,file=“Insurance.csv”)to Databasescon <- dbConnect(dbdriver,user,password,host,dbname)dbWriteTable(con, “Insurance”, Insurance) to R Objectssave(Insurance, file=“Insurance.RData”)
  • 20. Navigating within the R environmentlisting all variables> ls()examining a variable ‘x’> str(x)> head(x)> tail(x)> class(x)removing variables> rm(x)> rm(list=ls()) # remove everything
  • 21. Try It! #3 Data Processing load data & view itlibrary(MASS)head(Insurance) ## the first 7 rowsdim(Insurance) ## number of rows & columnswrite it outwrite.csv(Insurance,file=“Insurance.csv”, row.names=FALSE)getwd() ## where am I?view it in Excel, make a change, save it remove the first districtload it back in to R & plot itInsurance <- read.csv(file=“Insurance.csv”)plot(Claims/Holders ~ Age, data=Insurance)
  • 23. A Swiss-Army Knife for DataIndexingThree ways to index into a data framearray of integer indicesarray of character namesarray of logical BooleansExamples:df[1:3,]df[c(“New York”, “Chicago”),]df[c(TRUE,FALSE,TRUE,TRUE),]df[city == “New York”,]
  • 24. A Swiss-Army Knife for Datasubset – extract subsets meeting some criteriasubset(Insurance, District==1)subset(Insurance, Claims < 20)transform – add or alter a column of a data frametransform(Insurance, Propensity=Claims/Holders)cut – cut a continuous value into groups cut(Insurance$Claims, breaks=c(-1,100,Inf), labels=c('lo','hi')) Put it all together: create a new, transformed data frametransform(subset(Insurance, District==1), ClaimLevel=cut(Claims, breaks=c(-1,100,Inf), labels=c(‘lo’,’hi’)))
  • 25. A Statistical ModelerR’s has a powerful modeling syntaxModels are specified with formulae, like y ~ x growth ~ sun + watermodel relationships between continuous and categorical variables.Models are also guide the visualization of relationships in a graphical form
  • 26. A Statistical ModelerLinear modelm <- lm(Claims/Holders ~ Age, data=Insurance)Examine it summary(m)Plot it plot(m)
  • 27. A Statistical ModelerLogistic model m <- glm(Age ~ Claims/Holders, data=Insurance, family=binomial(“logit”)))Examine it summary(m)Plot it plot(m)
  • 28. Try It! #4 Statistical Modelingfit a linear modelm <- lm(Claims/Holders ~ Age + 0, data=Insurance) examine it summary(m)plot itplot(m)
  • 29. Visualization: Multivariate Barplotlibrary(ggplot2)qplot(Group, Claims/Holders, data=Insurance, geom="bar", stat='identity', position="dodge", facets=District ~ ., fill=Age)
  • 30. Visualization: Boxplotslibrary(ggplot2)qplot(Age, Claims/Holders, data=Insurance, geom="boxplot“)library(lattice)bwplot(Claims/Holders ~ Age, data=Insurance)
  • 31. Visualization: Histogramslibrary(ggplot2)qplot(Claims/Holders, data=Insurance, facets=Age ~ ., geom="density")library(lattice)densityplot(~ Claims/Holders | Age, data=Insurance, layout=c(4,1)
  • 32. Try It! #5 Data Visualizationsimple line chart> x <- 1:10> y <- x^2> plot(y ~ x)box plot> library(lattice)> boxplot(Claims/Holders ~ Age, data=Insurance)visualize a linear fit> abline()
  • 33. Getting Help with RHelp within R itself for a function> help(func)> ?funcFor a topic> help.search(topic)> ??topicsearch.r-project.orgGoogle Code Search www.google.com/codesearchStack Overflow http://stackoverflow.com/tags/RR-help list http://www.r-project.org/posting-guide.html
  • 34. Six Indispensable Books on RLearning RData ManipulationVisualizationStatistical Modeling
  • 35. Extending R with PackagesOver one thousand user-contributed packages are available on CRAN – the Comprehensive R Archive Networkhttp://cran.r-project.orgInstall a package from the command-line> install.packages(‘actuar’)Install a package from the GUI menu“Packages”--> “Install packages(s)”
  • 36. Final Try It!Simulate a TweedieSimulate the number of claims from a Poisson distribution with λ=2 (NB: mean poisson = λ, variance poisson = λ)
  • 37. For as many claims as were randomly simulated, simulate a severity from a gamma distribution with shape α=49 and scale θ=0.2 (NB: mean gamma = αθ, variance gamma = αθ2)
  • 38. Is the total simulated claim amount close to expected?
  • 39. Calculate usual parameterization (μ,p,φ)of this Tweedie distribution
  • 41. Repeat the above 10000 times.
  • 42. Does your histogram look like Glenn Meyers’?http://www.casact.org/newsletter/index.cfm?fa=viewart&id=5756Final Try It!Simulate a Tweedie- ANSWERSSimulate the number of claims from a Poisson distribution with λ=2 (NB: mean poisson = λ, variance poisson = λ)rpois(1,lambda=2)For as many claims as were randomly simulated, simulate a severity from a gamma distribution with shape α=49 and scale θ=0.2rgamma(rpois(1,lambda=2),shape=49,scale=.2)Is the total simulated claim amount close to expected? sum(rgamma(rpois(1,lambda=2),shape=49,scale=.2)) Repeat the above 10000 times replicate(10000, sum(rgamma(rpois(1,lambda=2),shape=49,scale=.2))) Visualize the distributionhist(replicate(10000, sum(rgamma(rpois(1,lambda=2),shape=49,scale=.2))), breaks=200, freq=FALSE)
  • 43. P&C Actuarial ModelsDesign • Construction Collaboration • Education Valuable • Transparent Daniel Murphy, FCAS, [email protected] Data to DecisionBig Data • Analytics • Visualizationwww.dataspora.comMichael E. Driscoll, [email protected] Us
  • 44. AppendicesR as a Programming LanguageAdvanced VisualizationEmbedding R in a Server Environment
  • 45. R as a Programming Languagefibonacci <- function(n) { fib <- numeric(n) fib [1:2] <- 1 for (i in 3:n) { fib[i] <- fib[i-1] + fib[i-2] } return(fib[n])}Image from cover of Abelson & Sussman’stextThe Structure and Interpretation of Computer Languages
  • 46. Assignmentx <- c(1,2,6)x a variable x<- R’s assignment operator, equivalent to ‘=‘ c( a function c which combines its arguments into a vectory <- c(‘apples’,’oranges’)z <- c(TRUE,FALSE) c(TRUE,FALSE) -> zThese are also valid assignment statements.
  • 47. Function CallsThere are ~ 1100 built-in commands in the R “base” package, which can be executed on the command-line. The basic structure of a call is thus:output <- function(arg1, arg2, …)Arithmetic Operations + - * / ^R functions are typically vectorized x <- x/3 works whether x is a one or many-valued vector
  • 48. Data Structures in Rnumericx <- c(0,2:4)vectorsCharactery <- c(“alpha”, “b”, “c3”, “4”)logicalz <- c(1, 0, TRUE, FALSE)> class(x)[1] "numeric"> x2 <- as.logical(x)> class(x2)[1] “logical”
  • 49. Data Structures in Rlistslst <- list(x,y,z)objectsmatricesM <- matrix(rep(x,3),ncol=3)data frames*df <- data.frame(x,y,z)> class(df)[1] “data.frame"
  • 50. Summary of Data Structures?matricesvectorsdata frames*lists
  • 54. qplot(log(carat), log(price), data = diamonds, alpha=I(1/20)) + facet_grid(. ~ color)Achieving small multiples with “facets”
  • 55. lattice = trellis(source: http://lmdvr.r-forge.r-project.org )
  • 56. list of latticefunctionsdensityplot(~ speed | type, data=pitch)
  • 57. visualizing six dimensionsof MLB pitches with lattice
  • 58. xyplot(x ~ y | type, data=pitch,fill.color = pitch$color,panel = function(x,y, fill.color, …, subscripts) { fill <- fill.color[subscripts]panel.xyplot(x, y, fill= fill, …) })
  • 59. Beautiful Colors with Colorspacelibrary(“Colorspace”)red <- LAB(50,64,64)blue <- LAB(50,-48,-48)mixcolor(10, red, blue)
  • 60. efficient plotting with hexbinplothexbinplot(log(price)~log(carat),data=diamonds,xbins=40)
  • 61. Embedding R in a Web ServerUsing Packages & R in a Server Environment

Editor's Notes

  • #3: These two men can help you. They are Robert Gentleman and Ross Ihaka, the creators of R.R is:free, open sourcecreated by statisticians extensible via packages - over 1000 packagesR is an open source programming language for statistical computing, data analysis, and graphical visualization.It has one million users worldwide, and its user base is growing. While most commonly used within academia, in fields such as computational biology and applied statistics, it is gaining currency in commercial areas such as quantitative finance – it is used by Barclay’s – and business intelligence – both Facebook and Google use R within their firms.It was created by two men at the University of Auckland – pictured in the NYT article on the rightOther languages exist that can do some of what R does, but here’s what sets it apart:1. Created by StatisticiansBo Cowgill, who uses R at Google has said: “the great thing about R is that it was created by statisticians.” By this – I can’t speak for him – that R has unparalleled built-in support for statistics. But he also says “the terrible thing about R is… that it was created by statisticians.” The learning curve can be steep, and the documentation for functions is sometimes sparse. Free, open sourcethe importance of this can’t be understated. anyone can improve to the core language, and in fact, a group of few dozen developers around the world do exactly this. the language is constantly vetted, tweaked, and improved.Extensible via packagesthis is related to the open source nature of the language. R has a core set of functions it uses, but just as Excel has ‘add-ons’ and Matlab has ‘toolkits’, it is extensible with ‘packages’. This is where R is most powerful: there are over 1000 different packages that have been written for R. If there’s a new statistical technique or method that has been published, there’s a good chance it has been implemented in R.Audience survey: How many of you use R regularly? Have ever used R? Have ever heard of R?
  • #4: These are the three fundamental steps of a data analyst.