Analyzing .Net Application Memory Usage And Issues
1 like1,516 views

.NET applications can experience memory issues despite having garbage collection. The document discusses the use of profiling tools like .NET Memory Profiler, ANTS Profiler, and CLR Profiler 2.0 to track memory allocations, manage leaks, and analyze memory usage effectively. It also provides resources for further reading and improving .NET application performance.
1 of 16


Ad
Recommended
.NET Memory Primer (Martin Kulov)
.NET Memory Primer (Martin Kulov)ITCamp The document presents key insights from a premium community conference on Microsoft technologies, specifically focusing on .NET memory management. It discusses various aspects of memory limits for x86 and x64 architectures, memory mapping, stack and heap management, and garbage collection in .NET. Additionally, it emphasizes the importance of memory for overall system performance and provides technical details on object roots and generational garbage collection.
.Net memory management ndc london
.Net memory management ndc londonbenemmett The document discusses .NET memory management and garbage collection. It begins by explaining the difference between the stack and heap, with value types stored on the stack and reference types stored on the heap. It then demonstrates how objects are allocated on the heap and referenced from the stack. The document also discusses the garbage collector and generations, and provides examples of how strings are stored. It concludes by covering unmanaged resources and the IDisposable pattern.
Garbage Collection In Micorosoft
Garbage Collection In MicorosoftSmithaNatarajamurthy The document discusses garbage collection in Microsoft .NET, detailing how the garbage collector (GC) operates, including algorithms like mark-sweep and generational GC. It highlights the differences between the stack and heap, gives tips for optimizing garbage collection, and describes the new background garbage collector introduced in CLR 4.0. Key takeaways include the importance of managing objects efficiently and understanding the lifecycle of managed and unmanaged resources.
Memory management
Memory managementRajni Sirohi The document discusses memory management in operating systems. It covers key concepts like logical versus physical addresses, binding logical addresses to physical addresses, and different approaches to allocating memory like contiguous allocation. It also discusses dynamic storage allocation using a buddy system to merge adjacent free spaces, as well as compaction techniques to reduce external fragmentation by moving free memory blocks together. Memory management aims to efficiently share physical memory between processes using mechanisms like partitioning memory and enforcing protection boundaries.
Memory profiler and garbage collector in C#
Memory profiler and garbage collector in C#Wipro The document discusses the necessity and functionality of a memory profiler in .NET applications, explaining concepts such as CLR, garbage collection, memory management, and memory leak issues. It details the steps to use the .NET memory profiler effectively, including how to analyze real-time data and identify memory leaks. Additionally, it outlines the classification of memory problems and the types of warnings that can arise during memory analysis.
JetBrains Day Seoul - Exploring .NET’s memory management – a trip down memory...
JetBrains Day Seoul - Exploring .NET’s memory management – a trip down memory...Maarten Balliauw .NET memory management is primarily handled by the garbage collector (GC), which manages memory allocation in the managed heap and reclaims unused memory. Memory is allocated quickly using pointers, and objects are organized into generations for efficient garbage collection, with special consideration for large objects. Developers are encouraged to optimize allocations and use tools for measurement to prevent performance issues related to memory management.
Exploring .NET memory management - A trip down memory lane - Copenhagen .NET ...
Exploring .NET memory management - A trip down memory lane - Copenhagen .NET ...Maarten Balliauw This document discusses .NET memory management, focusing on the garbage collector (GC) and its mechanisms including memory allocation and release within the managed heap. It explains the concept of generations in the GC process, techniques to optimize memory usage, and approaches to avoid hidden memory allocations. The document also emphasizes the importance of measuring allocations and provides insights on string management and profiling tools.
JetBrains Australia 2019 - Exploring .NET’s memory management – a trip down m...
JetBrains Australia 2019 - Exploring .NET’s memory management – a trip down m...Maarten Balliauw This document discusses .NET memory management and the garbage collector. It explains that the CLR manages memory in a heap and the garbage collector reclaims unused memory. It describes how objects are allocated in generations and discusses how to help the garbage collector perform better by reducing allocations, using value types when possible, and properly disposing of objects. The document also provides examples of hidden allocations and demonstrates tools for analyzing memory usage like ClrMD and dotMemory Unit.
Exploring .NET memory management - JetBrains webinar
Exploring .NET memory management - JetBrains webinarMaarten Balliauw The document outlines a webinar on .NET's memory management, presented by Maarten Balliauw from JetBrains. Key topics include the role and functioning of the garbage collector, the structure of memory allocation, and how to optimize memory usage through techniques such as object pooling and string interning. It emphasizes the importance of measuring memory allocations and avoiding premature optimization to ensure efficient memory management in .NET applications.
DotNetFest - Let’s refresh our memory! Memory management in .NET
DotNetFest - Let’s refresh our memory! Memory management in .NETMaarten Balliauw .NET memory management involves the use of a garbage collector (GC) to manage memory allocation and reclaim unused memory from applications, with a focus on optimizing memory traffic for short-lived objects. The GC organizes memory into generations to efficiently handle memory allocation and deallocation, using strategies like object pooling and string interning to reduce overhead. Profiler tools are recommended for monitoring memory usage and identifying allocation patterns, while developers should avoid unnecessary optimization and measure performance impacts.
.NET Fest 2018. Maarten Balliauw. Let’s refresh our memory! Memory management...
.NET Fest 2018. Maarten Balliauw. Let’s refresh our memory! Memory management...NETFest The document provides an overview of memory management in .NET, focusing on garbage collection (GC) and memory allocation. It explains how the GC operates by reclaiming unused memory through generations and the impact of object lifetimes on performance. Additionally, it covers best practices for optimizing memory usage, such as using object pooling and avoiding unnecessary allocations.
.Net debugging 2017
.Net debugging 2017Tess Ferrandez This document discusses techniques for debugging .NET applications using memory dumps. It describes how to generate memory dumps using Task Manager, ProcDump, and Debug Diagnostics. It then explains how to analyze dumps using WinDbg, Debug Diagnostics, and Visual Studio. Specific issues covered include crashes, performance problems, and memory leaks. Automated analysis of dumps is demonstrated using CLRMD.
ConFoo - Exploring .NET’s memory management – a trip down memory lane
ConFoo - Exploring .NET’s memory management – a trip down memory laneMaarten Balliauw .NET memory management involves garbage collection (GC) which optimally handles memory for short-lived objects in the managed heap while releasing memory from unreachable objects. The memory is segregated into generations to manage allocations efficiently, with a particular focus on avoiding fragmentation and optimizing allocations through strategies like object pooling. Understanding and utilizing string interning and profiling tools is essential for effective memory management in .NET applications.
Memory management
Memory managementLavishMaheshwari The document explains the distinctions and relationships between classes, objects, and references in C#, emphasizing that classes serve as blueprints for objects and that the 'new' keyword allocates objects on the managed heap while returning references. It details garbage collection and memory management, illustrating how the .NET runtime automatically handles memory, identifying unreachable objects for collection based on their reachability from application roots. The document also discusses object generations, describing how objects are categorized and collected based on their longevity in memory, optimizing the garbage collection process.
Kostiantyn Yelisavenko "Mastering Macro Benchmarking in .NET"
Kostiantyn Yelisavenko "Mastering Macro Benchmarking in .NET"LogeekNightUkraine This document discusses macro vs micro benchmarking in .NET. It defines macro benchmarking as measuring the performance of whole applications or parts of applications from a user's perspective, while micro benchmarking involves repeatable measurement of specific sections of code isolated from virtual machine effects. The document also covers topics like when optimization is needed, profiling tools available for .NET like dotTrace and dotMemory, and concludes that profiling can help identify performance bottlenecks and memory leaks, and forecast potential performance gains.
Debugging performance issues, memory issues and crashes in .net applications rev
Debugging performance issues, memory issues and crashes in .net applications revTess Ferrandez This document summarizes tools and techniques for debugging performance issues, memory issues, and crashes in .NET applications. It discusses gathering memory dumps, using SOS.dll to analyze dumps, setting symbols, identifying high CPU vs waiting issues, tracking exceptions, finding memory leaks, and garbage collection. The goal is to provide resources for debugging various common .NET problems.
Look Mommy, no GC! (BrightSource)
Look Mommy, no GC! (BrightSource)Dina Goldshtein The document discusses techniques for optimizing memory usage in software development, focusing on strategies such as avoiding garbage collection, utilizing performance counters, and conducting static code analysis. It emphasizes the importance of understanding memory allocations, using proper data structures, and implementing efficient designs to reduce memory footprint. Additionally, it provides practical tips for memory profiling and avoiding common pitfalls like unnecessary finalization and excessive garbage collection calls.
TechGIG_Memory leaks in_java_webnair_26th_july_2012
TechGIG_Memory leaks in_java_webnair_26th_july_2012Ashish Bhasin Memory leaks in Java can occur due to objects remaining reachable even when no longer needed. The four main causes are unknown references, long-living objects, failure to clean up native resources, and bugs. To detect leaks, one can use verbose GC logging, monitor the Java process, dump the heap to analyze which objects are retaining others, and use profiling tools. Profiling works by insertion of code, sampling, or instrumenting the virtual machine and helps identify where time is being spent and what objects are being allocated.
Garbage collection in C#,important topic
Garbage collection in C#,important topicksks28058 The presentation discusses garbage collection in C#, explaining how the garbage collector automates memory management within the Common Language Runtime (CLR), freeing developers from manual memory handling. It outlines the process of memory allocation on the managed heap, the conditions triggering garbage collection, and the concept of object generations, where objects are promoted based on their longevity. Additionally, the presentation highlights the importance of explicit resource management for unmanaged resources, emphasizing the need for a dispose method to properly release such resources.
Performance In The .Net World
Performance In The .Net WorldVlad Balan This document discusses .NET performance from a developer's perspective. It covers topics like String vs StringBuilder, serialization, reading XML, garbage collection, and JIT compilation. Demos are provided to illustrate performance differences between collections, client-server communication approaches, XML parsing methods, and garbage collection concepts like generations and minimizing overhead. The goal is to help developers understand key .NET performance areas and diagnose memory issues.
Practical lessons in memory analysis
Practical lessons in memory analysisAJohnson1 This document summarizes a presentation on practical lessons for memory analysis. It discusses analyzing memory leaks, heavy requests, and reducing memory footprint. It also covers non-heap memory issues like class loader leaks. The presentation demonstrates analyzing heap dumps with Memory Analyzer to find the largest objects, track object retention, find redundant objects, and analyze class loader leaks. The goal is to provide tips for solving common memory problems using heap analysis tools.
Exploring .NET memory management (iSense)
Exploring .NET memory management (iSense)Maarten Balliauw This document explores .NET memory management, focusing on the role of the garbage collector (GC) in managing memory allocations, releasing unused memory, and handling string objects. It covers the concepts of managed heap, garbage collection generations, large object heap, hidden allocations, and the importance of memory profiling and optimization. The conclusions emphasize the efficiency of GC for short-lived objects, the use of string interning, and the necessity of measurement in memory management practices.
CodeStock - Exploring .NET memory management - a trip down memory lane
CodeStock - Exploring .NET memory management - a trip down memory laneMaarten Balliauw .NET memory management involves garbage collection (GC) for efficient memory allocation and release, specifically through managed heaps and generational collection strategies. The garbage collector reclaims memory from unused objects, optimizing for short-lived object allocation while managing long-lived object behaviors like fragmentation. Developers are encouraged to minimize unnecessary allocations and utilize profiling tools for measuring memory usage and optimizing performance.
Ps ts 4118-304118_230-1_fin_v1
Ps ts 4118-304118_230-1_fin_v1AJohnson1 This document outlines techniques for analyzing common memory-related problems in Java applications using heap dumps and the Memory Analyzer tool. It discusses how to analyze memory leaks by finding the largest objects and determining what keeps them in memory. Heavy requests are analyzed by inspecting thread attributes and stack traces. Reducing memory footprint involves finding inefficient data structures and redundant data. Non-heap memory issues can be caused by too many interned strings or class loaders that are not released properly. The presentation demonstrates these analysis methods on real heap dumps and emphasizes that heap dumps and Memory Analyzer can automate much of the memory investigation process.
01class_object_references & 02Generation_GC.pptx
01class_object_references & 02Generation_GC.pptxssuser95922e The document discusses classes, objects, and references in C#. It explains that the new keyword returns a reference to an object on the heap rather than the actual object. It also covers object lifetime, how the garbage collector determines when an object is no longer needed, and how objects are assigned to generations by the garbage collector to optimize memory management.
Visual Studio Profiler
Visual Studio ProfilerBetclic Everest Group Tech Team The document discusses the Visual Studio Profiler, a tool designed for developers to measure and improve performance issues in applications. It outlines the profiling process, various methods available, and detailed profiling workflows for CPU sampling, instrumentation, memory allocation, and concurrency. Additionally, it highlights the importance of data collection, analysis, and offers insights into optimizing application performance.
.Net Architecture and Performance Tuning
.Net Architecture and Performance TuningGauranG Bajpai The document discusses .NET performance architecture and tuning. It provides an overview of key .NET concepts like the ASP.NET architecture, application types, .NET framework, compilation and execution process. It also discusses various .NET tools and performance counters that can help troubleshoot common performance issues. Several use cases are presented around memory usage, exceptions, application loading speed, and their solutions.
Self-Aware Applications: Automatic Production Monitoring (NDC Sydney 2017)
Self-Aware Applications: Automatic Production Monitoring (NDC Sydney 2017)Dina Goldshtein The document discusses the importance of self-monitoring in applications, emphasizing a hierarchical strategy for monitoring CPU, memory, garbage collection, and deadlocks. It highlights the necessity for both large-scale servers and simpler applications to use customized monitoring tools that meet specific business needs. Additionally, it outlines various performance counters and APIs for effective diagnostics and profiling while acknowledging the complexity and overhead involved in implementing such monitoring systems.
A DSL for Your API
A DSL for Your APIGreg Sohl This document discusses using a domain-specific language (DSL) to add scripting capabilities to applications. It notes that DSLs are custom languages tailored to an application's needs, and that scripting can provide benefits like automation, agility, and testing. It then introduces ANTLR4 as a tool that has improved parsing and makes building DSLs easier compared to traditional compiler approaches. The document concludes by suggesting building a sample language as an example.
.NET Overview
.NET OverviewGreg Sohl .NET is a comprehensive software development framework that includes a common language runtime (CLR) and a framework class library, facilitating the programming of applications in various languages. It addresses key software challenges such as interoperability, security, and installation complexity while supporting both managed and unmanaged code. The document also outlines essential components like ASP.NET for web services and ADO.NET for data access, as well as programming concepts such as assemblies and the common type system.
More Related Content
Similar to Analyzing .Net Application Memory Usage And Issues (20)
Exploring .NET memory management - JetBrains webinar
Exploring .NET memory management - JetBrains webinarMaarten Balliauw The document outlines a webinar on .NET's memory management, presented by Maarten Balliauw from JetBrains. Key topics include the role and functioning of the garbage collector, the structure of memory allocation, and how to optimize memory usage through techniques such as object pooling and string interning. It emphasizes the importance of measuring memory allocations and avoiding premature optimization to ensure efficient memory management in .NET applications.
DotNetFest - Let’s refresh our memory! Memory management in .NET
DotNetFest - Let’s refresh our memory! Memory management in .NETMaarten Balliauw .NET memory management involves the use of a garbage collector (GC) to manage memory allocation and reclaim unused memory from applications, with a focus on optimizing memory traffic for short-lived objects. The GC organizes memory into generations to efficiently handle memory allocation and deallocation, using strategies like object pooling and string interning to reduce overhead. Profiler tools are recommended for monitoring memory usage and identifying allocation patterns, while developers should avoid unnecessary optimization and measure performance impacts.
.NET Fest 2018. Maarten Balliauw. Let’s refresh our memory! Memory management...
.NET Fest 2018. Maarten Balliauw. Let’s refresh our memory! Memory management...NETFest The document provides an overview of memory management in .NET, focusing on garbage collection (GC) and memory allocation. It explains how the GC operates by reclaiming unused memory through generations and the impact of object lifetimes on performance. Additionally, it covers best practices for optimizing memory usage, such as using object pooling and avoiding unnecessary allocations.
.Net debugging 2017
.Net debugging 2017Tess Ferrandez This document discusses techniques for debugging .NET applications using memory dumps. It describes how to generate memory dumps using Task Manager, ProcDump, and Debug Diagnostics. It then explains how to analyze dumps using WinDbg, Debug Diagnostics, and Visual Studio. Specific issues covered include crashes, performance problems, and memory leaks. Automated analysis of dumps is demonstrated using CLRMD.
ConFoo - Exploring .NET’s memory management – a trip down memory lane
ConFoo - Exploring .NET’s memory management – a trip down memory laneMaarten Balliauw .NET memory management involves garbage collection (GC) which optimally handles memory for short-lived objects in the managed heap while releasing memory from unreachable objects. The memory is segregated into generations to manage allocations efficiently, with a particular focus on avoiding fragmentation and optimizing allocations through strategies like object pooling. Understanding and utilizing string interning and profiling tools is essential for effective memory management in .NET applications.
Memory management
Memory managementLavishMaheshwari The document explains the distinctions and relationships between classes, objects, and references in C#, emphasizing that classes serve as blueprints for objects and that the 'new' keyword allocates objects on the managed heap while returning references. It details garbage collection and memory management, illustrating how the .NET runtime automatically handles memory, identifying unreachable objects for collection based on their reachability from application roots. The document also discusses object generations, describing how objects are categorized and collected based on their longevity in memory, optimizing the garbage collection process.
Kostiantyn Yelisavenko "Mastering Macro Benchmarking in .NET"
Kostiantyn Yelisavenko "Mastering Macro Benchmarking in .NET"LogeekNightUkraine This document discusses macro vs micro benchmarking in .NET. It defines macro benchmarking as measuring the performance of whole applications or parts of applications from a user's perspective, while micro benchmarking involves repeatable measurement of specific sections of code isolated from virtual machine effects. The document also covers topics like when optimization is needed, profiling tools available for .NET like dotTrace and dotMemory, and concludes that profiling can help identify performance bottlenecks and memory leaks, and forecast potential performance gains.
Debugging performance issues, memory issues and crashes in .net applications rev
Debugging performance issues, memory issues and crashes in .net applications revTess Ferrandez This document summarizes tools and techniques for debugging performance issues, memory issues, and crashes in .NET applications. It discusses gathering memory dumps, using SOS.dll to analyze dumps, setting symbols, identifying high CPU vs waiting issues, tracking exceptions, finding memory leaks, and garbage collection. The goal is to provide resources for debugging various common .NET problems.
Look Mommy, no GC! (BrightSource)
Look Mommy, no GC! (BrightSource)Dina Goldshtein The document discusses techniques for optimizing memory usage in software development, focusing on strategies such as avoiding garbage collection, utilizing performance counters, and conducting static code analysis. It emphasizes the importance of understanding memory allocations, using proper data structures, and implementing efficient designs to reduce memory footprint. Additionally, it provides practical tips for memory profiling and avoiding common pitfalls like unnecessary finalization and excessive garbage collection calls.
TechGIG_Memory leaks in_java_webnair_26th_july_2012
TechGIG_Memory leaks in_java_webnair_26th_july_2012Ashish Bhasin Memory leaks in Java can occur due to objects remaining reachable even when no longer needed. The four main causes are unknown references, long-living objects, failure to clean up native resources, and bugs. To detect leaks, one can use verbose GC logging, monitor the Java process, dump the heap to analyze which objects are retaining others, and use profiling tools. Profiling works by insertion of code, sampling, or instrumenting the virtual machine and helps identify where time is being spent and what objects are being allocated.
Garbage collection in C#,important topic
Garbage collection in C#,important topicksks28058 The presentation discusses garbage collection in C#, explaining how the garbage collector automates memory management within the Common Language Runtime (CLR), freeing developers from manual memory handling. It outlines the process of memory allocation on the managed heap, the conditions triggering garbage collection, and the concept of object generations, where objects are promoted based on their longevity. Additionally, the presentation highlights the importance of explicit resource management for unmanaged resources, emphasizing the need for a dispose method to properly release such resources.
Performance In The .Net World
Performance In The .Net WorldVlad Balan This document discusses .NET performance from a developer's perspective. It covers topics like String vs StringBuilder, serialization, reading XML, garbage collection, and JIT compilation. Demos are provided to illustrate performance differences between collections, client-server communication approaches, XML parsing methods, and garbage collection concepts like generations and minimizing overhead. The goal is to help developers understand key .NET performance areas and diagnose memory issues.
Practical lessons in memory analysis
Practical lessons in memory analysisAJohnson1 This document summarizes a presentation on practical lessons for memory analysis. It discusses analyzing memory leaks, heavy requests, and reducing memory footprint. It also covers non-heap memory issues like class loader leaks. The presentation demonstrates analyzing heap dumps with Memory Analyzer to find the largest objects, track object retention, find redundant objects, and analyze class loader leaks. The goal is to provide tips for solving common memory problems using heap analysis tools.
Exploring .NET memory management (iSense)
Exploring .NET memory management (iSense)Maarten Balliauw This document explores .NET memory management, focusing on the role of the garbage collector (GC) in managing memory allocations, releasing unused memory, and handling string objects. It covers the concepts of managed heap, garbage collection generations, large object heap, hidden allocations, and the importance of memory profiling and optimization. The conclusions emphasize the efficiency of GC for short-lived objects, the use of string interning, and the necessity of measurement in memory management practices.
CodeStock - Exploring .NET memory management - a trip down memory lane
CodeStock - Exploring .NET memory management - a trip down memory laneMaarten Balliauw .NET memory management involves garbage collection (GC) for efficient memory allocation and release, specifically through managed heaps and generational collection strategies. The garbage collector reclaims memory from unused objects, optimizing for short-lived object allocation while managing long-lived object behaviors like fragmentation. Developers are encouraged to minimize unnecessary allocations and utilize profiling tools for measuring memory usage and optimizing performance.
Ps ts 4118-304118_230-1_fin_v1
Ps ts 4118-304118_230-1_fin_v1AJohnson1 This document outlines techniques for analyzing common memory-related problems in Java applications using heap dumps and the Memory Analyzer tool. It discusses how to analyze memory leaks by finding the largest objects and determining what keeps them in memory. Heavy requests are analyzed by inspecting thread attributes and stack traces. Reducing memory footprint involves finding inefficient data structures and redundant data. Non-heap memory issues can be caused by too many interned strings or class loaders that are not released properly. The presentation demonstrates these analysis methods on real heap dumps and emphasizes that heap dumps and Memory Analyzer can automate much of the memory investigation process.
01class_object_references & 02Generation_GC.pptx
01class_object_references & 02Generation_GC.pptxssuser95922e The document discusses classes, objects, and references in C#. It explains that the new keyword returns a reference to an object on the heap rather than the actual object. It also covers object lifetime, how the garbage collector determines when an object is no longer needed, and how objects are assigned to generations by the garbage collector to optimize memory management.
Visual Studio Profiler
Visual Studio ProfilerBetclic Everest Group Tech Team The document discusses the Visual Studio Profiler, a tool designed for developers to measure and improve performance issues in applications. It outlines the profiling process, various methods available, and detailed profiling workflows for CPU sampling, instrumentation, memory allocation, and concurrency. Additionally, it highlights the importance of data collection, analysis, and offers insights into optimizing application performance.
.Net Architecture and Performance Tuning
.Net Architecture and Performance TuningGauranG Bajpai The document discusses .NET performance architecture and tuning. It provides an overview of key .NET concepts like the ASP.NET architecture, application types, .NET framework, compilation and execution process. It also discusses various .NET tools and performance counters that can help troubleshoot common performance issues. Several use cases are presented around memory usage, exceptions, application loading speed, and their solutions.
Self-Aware Applications: Automatic Production Monitoring (NDC Sydney 2017)
Self-Aware Applications: Automatic Production Monitoring (NDC Sydney 2017)Dina Goldshtein The document discusses the importance of self-monitoring in applications, emphasizing a hierarchical strategy for monitoring CPU, memory, garbage collection, and deadlocks. It highlights the necessity for both large-scale servers and simpler applications to use customized monitoring tools that meet specific business needs. Additionally, it outlines various performance counters and APIs for effective diagnostics and profiling while acknowledging the complexity and overhead involved in implementing such monitoring systems.
More from Greg Sohl (11)
A DSL for Your API
A DSL for Your APIGreg Sohl This document discusses using a domain-specific language (DSL) to add scripting capabilities to applications. It notes that DSLs are custom languages tailored to an application's needs, and that scripting can provide benefits like automation, agility, and testing. It then introduces ANTLR4 as a tool that has improved parsing and makes building DSLs easier compared to traditional compiler approaches. The document concludes by suggesting building a sample language as an example.
.NET Overview
.NET OverviewGreg Sohl .NET is a comprehensive software development framework that includes a common language runtime (CLR) and a framework class library, facilitating the programming of applications in various languages. It addresses key software challenges such as interoperability, security, and installation complexity while supporting both managed and unmanaged code. The document also outlines essential components like ASP.NET for web services and ADO.NET for data access, as well as programming concepts such as assemblies and the common type system.
Cool .NET tools, techniques and libraries
Cool .NET tools, techniques and librariesGreg Sohl The document presents various .NET tools, techniques, and libraries, highlighting open-source options like Gios PDF Split/Merge and Kellerman Software's .NET Object Comparison. It discusses best practices for using NuGet, addressing safety concerns regarding open-source licenses, package trust issues, and repository management. Additional resources include tools for file analysis and logging, with links provided for further exploration.
Net serialization
Net serializationGreg Sohl This document discusses .NET serialization, including:
- Serialization converts objects to bytes for exchange or storage. It is reversible through deserialization.
- Common serializers include BinaryFormatter, XMLSerializer, and DataContractSerializer. They serialize type, member, and value information.
- Attributes like Serializable control serialization behavior. Custom serialization is possible through interfaces like ISerializable.
- Version tolerance allows deserializing objects serialized with previous versions, by ignoring new fields and marking changed ones as optional. Unit tests validate serialization.
RESTful APIs in .NET
RESTful APIs in .NETGreg Sohl The document discusses the design and principles of RESTful APIs, emphasizing the importance of concepts such as resources, representations, and stateless interactions. It highlights the use of URIs and HTTP methods in constructing APIs and contrasts REST with SOAP. Additionally, it covers best practices for API design, response caching, and error handling within the ASP.NET framework.
A great clash of symbols
A great clash of symbolsGreg Sohl This document discusses managing and using symbol files for .NET applications. Symbol files contain debugging information produced by .NET compilers and stored in PDB files. It outlines how Visual Studio and other tools use symbol files, places to store symbols, and keeping symbols with NuGet packages. The document also provides an overview of symbol file creation, types of symbol files, and how Visual Studio finds symbols using a search path that can include local drives, network drives, a symbol server, and a local cache.
What’s new in Visual Studio 2010 debugging
What’s new in Visual Studio 2010 debuggingGreg Sohl The document outlines the new debugging features in Visual Studio 2010, including enhancements in breakpoints, thread window redesign, and Intellitrace functionality. Key updates involve improved search and labeling for breakpoints, loading of dump files, and support for 64-bit debugging. Additional resources and links to related blog posts and videos are also provided for further exploration of these debugging enhancements.
Automated Unit Testing and TDD
Automated Unit Testing and TDDGreg Sohl The document discusses unit testing and test-driven development (TDD). It provides an overview and agenda for the topics, including definitions of unit testing and TDD. It addresses common misconceptions about unit testing and TDD. Benefits of unit testing include making code easier to maintain and understand through automated testing. TDD helps with understanding problems and designing code with test coverage. The document emphasizes the importance of writing good, trustworthy, and maintainable unit tests.
Application Security Part 1 Threat Defense In Client Server Applications ...
Application Security Part 1 Threat Defense In Client Server Applications ...Greg Sohl This document presents an overview of application security, focusing on threat defense in client/server applications, highlighting the various types of attackers and common application vulnerabilities. It emphasizes threat modeling, detailing strategies to identify, rank, and defend against attacks such as authentication failures, SQL injection, cross-site scripting, and buffer overflows. Additionally, it provides resources for best practices, tools, and training to improve application security.
.NET Recommended Resources
.NET Recommended ResourcesGreg Sohl The document provides a comprehensive list of recommended resources, tools, and utilities for .NET development, including links to regular expression tools, text editors, profilers, IDEs, code generation tools, and documentation aids. It covers both free and commercial options, highlighting features and use cases for each. The document also includes references to design patterns and various programming websites, enhancing developers' understanding and efficiency in their work.
Object Oriented Programming In .Net
Object Oriented Programming In .NetGreg Sohl The document discusses object-oriented programming (OOP) principles as applied within the .NET framework, emphasizing the importance of classes, objects, encapsulation, inheritance, and polymorphism. It outlines basic OOP concepts, including class structure, member types, and the differences between abstract classes and interfaces, while explaining how these principles facilitate software development. Additionally, it highlights the necessity of transitioning from procedural to OOP for effective framework usage.
Ad
Recently uploaded (20)
Tech-ASan: Two-stage check for Address Sanitizer - Yixuan Cao.pdf
Tech-ASan: Two-stage check for Address Sanitizer - Yixuan Cao.pdfcaoyixuan2019 A presentation at Internetware 2025.
cnc-processing-centers-centateq-p-110-en.pdf
cnc-processing-centers-centateq-p-110-en.pdfAmirStern2 מרכז עיבודים תעשייתי בעל 3/4/5 צירים, עד 22 החלפות כלים עם כל אפשרויות העיבוד הדרושות. בעל שטח עבודה גדול ומחשב נוח וקל להפעלה בשפה העברית/רוסית/אנגלית/ספרדית/ערבית ועוד..
מסוגל לבצע פעולות עיבוד שונות המתאימות לענפים שונים: קידוח אנכי, אופקי, ניסור, וכרסום אנכי.
"Scaling in space and time with Temporal", Andriy Lupa.pdf
"Scaling in space and time with Temporal", Andriy Lupa.pdfFwdays Design patterns like Event Sourcing and Event Streaming have long become standards for building real-time analytics systems. However, when the system load becomes nonlinear with fast and often unpredictable spikes, it's crucial to respond quickly in order not to lose real-time operating itself.
In this talk, I’ll share my experience implementing and using a tool like Temporal.io. We'll explore the evolution of our system for maintaining real-time report generation and discuss how we use Temporal both for short-lived pipelines and long-running background tasks.
Lessons Learned from Developing Secure AI Workflows.pdf
Lessons Learned from Developing Secure AI Workflows.pdfPriyanka Aash Lessons Learned from Developing Secure AI Workflows
OpenACC and Open Hackathons Monthly Highlights June 2025
OpenACC and Open Hackathons Monthly Highlights June 2025OpenACC The OpenACC organization focuses on enhancing parallel computing skills and advancing interoperability in scientific applications through hackathons and training. The upcoming 2025 Open Accelerated Computing Summit (OACS) aims to explore the convergence of AI and HPC in scientific computing and foster knowledge sharing. This year's OACS welcomes talk submissions from a variety of topics, from Using Standard Language Parallelism to Computer Vision Applications. The document also highlights several open hackathons, a call to apply for NVIDIA Academic Grant Program and resources for optimizing scientific applications using OpenACC directives.
A Constitutional Quagmire - Ethical Minefields of AI, Cyber, and Privacy.pdf
A Constitutional Quagmire - Ethical Minefields of AI, Cyber, and Privacy.pdfPriyanka Aash A Constitutional Quagmire - Ethical Minefields of AI, Cyber, and Privacy
Wenn alles versagt - IBM Tape schützt, was zählt! Und besonders mit dem neust...
Wenn alles versagt - IBM Tape schützt, was zählt! Und besonders mit dem neust...Josef Weingand IBM LTO10
Raman Bhaumik - Passionate Tech Enthusiast
Raman Bhaumik - Passionate Tech EnthusiastRaman Bhaumik A Junior Software Developer with a flair for innovation, Raman Bhaumik excels in delivering scalable web solutions. With three years of experience and a solid foundation in Java, Python, JavaScript, and SQL, she has streamlined task tracking by 20% and improved application stability.
10 Key Challenges for AI within the EU Data Protection Framework.pdf
10 Key Challenges for AI within the EU Data Protection Framework.pdfPriyanka Aash 10 Key Challenges for AI within the EU Data Protection Framework
Coordinated Disclosure for ML - What's Different and What's the Same.pdf
Coordinated Disclosure for ML - What's Different and What's the Same.pdfPriyanka Aash Coordinated Disclosure for ML - What's Different and What's the Same
Mastering AI Workflows with FME by Mark Döring
Mastering AI Workflows with FME by Mark DöringSafe Software Harness the full potential of AI with FME: From creating high-quality training data to optimizing models and utilizing results, FME supports every step of your AI workflow. Seamlessly integrate a wide range of models, including those for data enhancement, forecasting, image and object recognition, and large language models. Customize AI models to meet your exact needs with FME’s powerful tools for training, optimization, and seamless integration
Quantum AI: Where Impossible Becomes Probable
Quantum AI: Where Impossible Becomes ProbableSaikat Basu Imagine combining the "brains" of Artificial Intelligence (AI) with the "super muscles" of Quantum Computing. That's Quantum AI!
It's a new field that uses the mind-bending rules of quantum physics to make AI even more powerful.
WebdriverIO & JavaScript: The Perfect Duo for Web Automation
WebdriverIO & JavaScript: The Perfect Duo for Web Automationdigitaljignect In today’s dynamic digital landscape, ensuring the quality and dependability of web applications is essential. While Selenium has been a longstanding solution for automating browser tasks, the integration of WebdriverIO (WDIO) with Selenium and JavaScript marks a significant advancement in automation testing. WDIO enhances the testing process by offering a robust interface that improves test creation, execution, and management. This amalgamation capitalizes on the strengths of both tools, leveraging Selenium’s broad browser support and WDIO’s modern, efficient approach to test automation. As automation testing becomes increasingly vital for faster development cycles and superior software releases, WDIO emerges as a versatile framework, particularly potent when paired with JavaScript, making it a preferred choice for contemporary testing teams.
Database Benchmarking for Performance Masterclass: Session 2 - Data Modeling ...
Database Benchmarking for Performance Masterclass: Session 2 - Data Modeling ...ScyllaDB Specific best practices and pitfalls for benchmarking popular high-performance databases.
PyCon SG 25 - Firecracker Made Easy with Python.pdf
PyCon SG 25 - Firecracker Made Easy with Python.pdfMuhammad Yuga Nugraha Explore the ease of managing Firecracker microVM with the firecracker-python. In this session, I will introduce the basics of Firecracker microVM and demonstrate how this custom SDK facilitates microVM operations easily. We will delve into the design and development process behind the SDK, providing a behind-the-scenes look at its creation and features. While traditional Firecracker SDKs were primarily available in Go, this module brings a simplicity of Python to the table.
The Future of Product Management in AI ERA.pdf
The Future of Product Management in AI ERA.pdfAlyona Owens Hi, I’m Aly Owens, I have a special pleasure to stand here as over a decade ago I graduated from CityU as an international student with an MBA program. I enjoyed the diversity of the school, ability to work and study, the network that came with being here, and of course the price tag for students here has always been more affordable than most around.
Since then I have worked for major corporations like T-Mobile and Microsoft and many more, and I have founded a startup. I've also been teaching product management to ensure my students save time and money to get to the same level as me faster avoiding popular mistakes. Today as I’ve transitioned to teaching and focusing on the startup, I hear everybody being concerned about Ai stealing their jobs… We’ll talk about it shortly.
But before that, I want to take you back to 1997. One of my favorite movies is “Fifth Element”. It wowed me with futuristic predictions when I was a kid and I’m impressed by the number of these predictions that have already come true. Self-driving cars, video calls and smart TV, personalized ads and identity scanning. Sci-fi movies and books gave us many ideas and some are being implemented as we speak. But we often get ahead of ourselves:
Flying cars,Colonized planets, Human-like AI: not yet, Time travel, Mind-machine neural interfaces for everyone: Only in experimental stages (e.g. Neuralink).
Cyberpunk dystopias: Some vibes (neon signs + inequality + surveillance), but not total dystopia (thankfully).
On the bright side, we predict that the working hours should drop as Ai becomes our helper and there shouldn’t be a need to work 8 hours/day. Nobody knows for sure but we can require that from legislation. Instead of waiting to see what the government and billionaires come up with, I say we should design our own future.
So, we as humans, when we don’t know something - fear takes over. The same thing happened during the industrial revolution. In the Industrial Era, machines didn’t steal jobs—they transformed them but people were scared about their jobs. The AI era is making similar changes except it feels like robots will take the center stage instead of a human. First off, even when it comes to the hottest space in the military - drones, Ai does a fraction of work. AI algorithms enable real-time decision-making, obstacle avoidance, and mission optimization making drones far more autonomous and capable than traditional remote-controlled aircraft. Key technologies include computer vision for object detection, GPS-enhanced navigation, and neural networks for learning and adaptation. But guess what? There are only 2 companies right now that utilize Ai in drones to make autonomous decisions - Skydio and DJI.
The Growing Value and Application of FME & GenAI
The Growing Value and Application of FME & GenAISafe Software With the cost of using Generative AI services dropping exponentially and the array of available models continually expanding, integrating AI into FME workflows has become inexpensive, accessible and effective. This presentation explores how GenAI within FME can cost-effectively transform data workflows by automating data extraction, validation, classification and augmentation tasks. We’ll discuss how FME’s no-code flexibility enables users to combine Generative AI and Computer Vision tools that create efficient workflows tailored to specific challenges. Using recent practical examples, we’ll demonstrate how these integrations can simplify complex tasks, save time and enhance data quality.
Ad
Analyzing .Net Application Memory Usage And Issues
- 1. Analyzing .NET Application Memory Usage and Issues Using Free and Commercial Profiling Tools Presented by Greg Sohl © 2006, Gregory M. Sohl
- 2. Memory Issues? Huh? .NET has Garbage Collection. I don’t have to worry about memory anymore! Users have lots of memory now. I don’t have to worry about using lots of memory anymore! Windows has virtual memory space. I don’t have to worry about using lots of memory anymore!
- 3. Common .NET Memory Issues Too much allocation Memory allocations are long lived Managed memory leaks – reference leaks Work “with” the Garbage Collector. It’s your friend - but only if you are nice to it.
- 4. Why Use a Profiling Tool? To understand how your allocations correspond with the assumptions made by the GC Track unintentional references to instances (leaks) Track references that are being held too long
- 5. 3 Allocation Profilers .NET Memory Profiler – SciTech Commercial – best of breed Ants Profiler – Red Gate Commercial – Useful, but light weight feature set CLR Profiler 2.0 – Microsoft Free – Powerful, but challenging to use Others listed in resources
- 6. Definitions Root – The base object holding references to other objects Examples: A static field, a local variable or a method parameter. Root Path - The path of referees from the selected instance to a root Garbage Collection – The process by which objects with no root (unreachable objects) are cleaned up from the heap.
- 7. Sample - Conway’s Game of Life A simulation of cellular automation. http://en.wikipedia.org/wiki/Conway's_Game_of_Life Pulsar Pattern
- 8. Demo - .NET Memory Profiler Cream of the crop profilers Can attach to running processes Show native memory usage Great real-time view Copy grids to clipboard Low impact mode
- 9. Demo - CLR Profiler 2.0 For the MacGyver in you. A robust tool, without all the modern conveniences.
- 10. Demo - Ants Profiler Good tool with basic features Memory analysis a recent addition to execution analysis No real-time or IDisposble analysis Best thread support
- 11. Resources .NET Memory Profiler http://memprofiler.com/ Ants Profiler http://www.red-gate.com CLR Profiler 2.0 http://www.microsoft.com/downloads/details.aspx?familyid=A362781C-3870-43BE-8926-862B40AA0CD0&displaylang=en Or http://tinyurl.com/ozsgr
- 12. Resources DevPartner Studio Professional Includes a memory profiler http://www.compuware.com/products/devpartner/studio.htm
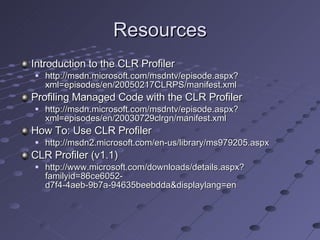
- 13. Resources Introduction to the CLR Profiler http://msdn.microsoft.com/msdntv/episode.aspx?xml=episodes/en/20050217CLRPS/manifest.xml Profiling Managed Code with the CLR Profiler http://msdn.microsoft.com/msdntv/episode.aspx?xml=episodes/en/20030729clrgn/manifest.xml How To: Use CLR Profiler http://msdn2.microsoft.com/en-us/library/ms979205.aspx CLR Profiler (v1.1) http://www.microsoft.com/downloads/details.aspx?familyid=86ce6052-d7f4-4aeb-9b7a-94635beebdda&displaylang=en
- 14. Resources Improving Managed Code Performance (P&P) http://msdn2.microsoft.com/en-us/library/ms998547.aspx Code Review: .NET Application Performance http://msdn2.microsoft.com/en-us/library/ms998574.aspx Checklist: Managed Code Performance http://msdn2.microsoft.com/en-us/library/ms979052.aspx Improving .NET Application Performance and Scalability (full Patterns and Practices book) http://msdn2.microsoft.com/en-us/library/ms998530.aspx
- 15. Resources Rico Mariani's Performance Tidbits (Blog) http://blogs.msdn.com/ricom/default.aspx Garbage Collection: Automatic Memory Management in the Microsoft .NET Framework (Jeffery Richter) http://msdn.microsoft.com/msdnmag/issues/1100/gci/ Garbage Collector Basics and Performance Hints (Rico Mariani) http://msdn2.microsoft.com/en-us/library/ms973837.aspx
- 16. Thank You! Questions?