![Giuliani Donatella
International Journal of Image Processing (IJIP), Volume (12) : Issue (4) : 2018 101
Color Image Segmentation Based On Principal Component
Analysis With Application of Firefly Algorithm And
Gaussian Mixture Model
Giuliani Donatella giulianidonatella@libero.it
University of Bologna
Bologna, Italy
Abstract
In this paper we propose a segmentation method for multi-spectral images in the HSV space,
based on the Principal Component Analysis to generate grayscale images. Then the Firefly
Algorithm has been applied on the gray-level images in a histogram-based research of cluster
centroids. The FA is a metaheuristic optimization algorithm, centered on the flashing behaviour of
fireflies. The Firefly Algorithm is performed to determine automatically the number of clusters and
to select the gray levels for partitioning pixels into homogeneous regions. Successively, these
gray values are employed during the initialization step of a Gaussian Mixture Model for estimation
of parameters, evaluated through the Expectation-Maximization technique. The coefficients of the
linear super-position of Gaussians can be regarded as the prior probabilities of each component.
Applying the Bayes rule, the posterior probabilities have been estimated and their maxima are
used to assign each pixel to the clusters, according to their gray values.
Keywords: Color Image Segmentation, Image Clustering, Firefly Algorithm, Gaussian Mixture
Model.
1. INTRODUCTION
Image segmentation is the process of separating an image into disjoint and homogeneous
components. Because of the enormous variety and complexity of color images, robust and
efficient segmentation approaches are far from satisfying, especially when applied on images of
the real world. Color image segmentation attracts more and more interest, mainly because it
provides a greater amount of information respect to grayscale images. Grayscale image
segmentation methods are categorized recurring to the two properties utilized for partitioning:
discontinuity and similarity, the most common are the region-based and edge-based methods. In
more details, region-based methods are founded on similarity, they segment an image recurring
to low-level features of it, such as intensity, texture or color, assuming that pixels belong to the
same region if they have similar characteristics. Hence they can work for colored images as well.
On the contrary, color image edge-detection techniques are extension of monochromatic
methods, they operate on the three color channels independently combining their final results.
More explicitly, the gradient operators proposed for grayscale segmentation approaches, are
extended to color images by taking the vector sum of gradients for each component [1]. The
paradigms of gray level image segmentation, pixel-based, region-based or edge-based can be
also used for color images. Besides, we must include the so called physics-based methods which
take into account information about the exposure to light during image acquisition processes as
well. In summary, color image segmentation methods may be classified into three different
groups depending on the technique employed: 1) feature-space based techniques; 2) image
domain based techniques; and 3) physics based techniques. The feature-space methods work in
a certain color space, assuming that color is a constant property of the surface of each object
within an image. Thus these methods map pixels into regions having homogenous characteristics
or create some ad hoc histograms upon color features, such as hue. Generally, objects will
appear as clusters or in correspondence of peaks within histograms, in the latter case. The](https://image.slidesharecdn.com/ijip-1171-191010065005/85/Color-Image-Segmentation-Based-On-Principal-Component-Analysis-With-Application-of-Firefly-Algorithm-And-Gaussian-Mixture-Model-1-320.jpg)
![Giuliani Donatella
International Journal of Image Processing (IJIP), Volume (12) : Issue (4) : 2018 102
image-domain based techniques, such as split and merge or region growing methods, perform a
spatial grouping of pixels according to similarity or dissimilarity criteria to guarantee spatial
compactness. Lastly, in the physics-based approach, all algorithms examine the objects
portrayed in color images taking into account light exposure, highlights, and shadows. These
phenomena frequently cause appearance of color variations of uniformly colored surfaces. To
avoid over segmented regions, these algorithms analyze how light interacts with colored
materials [2].
2. PRELIMINARIES
A color is perceived by human beings as a combination of the tri-stimuli captured by three
different kinds of photoreceptors in the retina, called cones, whose spectral responses are
centered on the wavelengths of red, green, blue. Therefore, a digital color image is represented
by a two dimensional array of three dimensional vectors which represent the pixel's red, green
and blue values, the three primary colors which form the color space. Although RGB image
representation is the most often used, it is not adequate for performing color recognition in image
analysis since this space has three independent channels, so any color can be created by
combination of these three color bases. RGB color space is suitable for color display but it is not
good for color scene segmentation and analysis because of the high correlation among the R, G,
B components and the great sensitivity to variations in illumination [3]. For this reason, we have
adopted HSV color space (Hue, Saturation, Value) given that it structures any color in the same
way in which it is perceived by human eyes [4]. More precisely, hue is the color tone, i.e. red or
yellow, saturation defines the amount of each color, i.e. dark green or pale green, finally the
value, also called intensity or lightness, allows to distinguish between a dark or a light color. An
accurate comparison study between different color spaces revealed that the HSV space provides
good results in image segmentation [4].
3. METHODOLOGY
In this paper we propose a segmentation method based on pixel intensity without recurring to
thresholding techniques. Firstly, the proposed segmentation algorithm performs the Principal
Component Analysis on color images. PCA is a standard tool of modern data analysis that
transforms a number of possible correlated variables into a smaller number of uncorrelated ones,
preserving the most relevant information of the original data set. Then we proceeded to a
histogram-based research of cluster centroids applying a meta-heuristic algorithm, the Firefly
Algorithm (FA), belonging to a novel class of non-deterministic optimization methods.
Over the last few decades, researchers started to use metaheuristic algorithms for clustering to
overcome the weakness of the existing conventional methodologies, generally deterministic [5].
Metaheuristic algorithms are a class of approximate methods that allow to discover possible
solutions exploring the search space in order to find near-optimal solutions. Shortly, metaheuristic
algorithms are iteratively processes developed to search a solution that is good enough in a time
that is small enough [6]. These algorithms are frequently nature-inspired, they have the
advantages of finding global optima due to the action of multiple search agents, randomly
generated [7].
Nature inspired metaheuristic algorithms are applied for multilevel thresholding image
segmentation in a comparative study between Particle Swarm Optimization (PSO), Artificial Bee
Colony Optimization (ABC), Ant Colony Optimization (ACO) and Cuckoo Search (CS) algorithms,
that are investigated in partitioning gray-scale images [8]. The well-known K-means clustering
algorithm is applied by an optimization technique based on FA algorithm, with the squared error
as objective function. The performance of the FA is compared with other two nature-inspired
methods, ACO and PSO, and other nine traditional approaches [9]. A bio-inspired segmentation
algorithm is proposed for solving crop type classification problems using a multispectral satellite
image [10]. A colour image partitioning procedure is implemented applying a multi-level
thresholding approach on the three R, G and B histograms, analyzed independently [11]. The
predefined number of optimal thresholds for each colour component are attained by maximizing](https://image.slidesharecdn.com/ijip-1171-191010065005/85/Color-Image-Segmentation-Based-On-Principal-Component-Analysis-With-Application-of-Firefly-Algorithm-And-Gaussian-Mixture-Model-2-320.jpg)
![Giuliani Donatella
International Journal of Image Processing (IJIP), Volume (12) : Issue (4) : 2018 103
Otsu’s between-class variance function, recurring to the Firefly Algorithm. The maximum entropy
thresholding method is widely used in literature, this approach has been performed in partitioning
multi-channels images employing Firefly Algorithm [12], in this context entropy operators yield
high values in regions characterized by drastic chromaticity variations. For an exhaustive review
of the more conventional segmentation methods refer to [13], [14], [15].
In the present work we started with a pre-processing step, during which the original image has
been de-correlated in order to improve its appearance and to enhance the contrast between pixel
colors. Then applying PCA, the image dimensionality has been reduced from the three-
dimensional HSV color space to the one-dimensional gray representation [16]. To this aim, given
a color image
with components , let be the vector mean, expressed by:
the covariance matrix C is evaluated as:
So, if we denote with 1 2 3 and , respectively, the eigenvalues and eigenvectors
of C, the components of de-correlated image may be computed as:
Through PCA, the de-correlated image is projected along the direction of the principal
component in which it has been registered the highest variability, therefore the intensity image
I is generated by:
Once the gray image has been obtained, we proceed in evaluating automatically the number of
clusters and the associated representative levels through a histogram-based segmentation
approach by means the Firefly Algorithm.
The Firefly Algorithm, developed by Yang X.S. [17], employs fireflies as search agents making
use of their idealized flashing characteristics. In describing the Firefly Algorithm, three
fundamental rules may be delineated [18],[19],[20],[21]:
(1) All fireflies are unisex so that one firefly will be attracted to other fireflies regardless of
their sex;
(2) Attractiveness is proportional to their brightness, thus for any two flashing fireflies, the
less bright one will move towards the brighter one. The attractiveness is proportional to
brightness, decreasing as their distance increases. If there is no brighter one, a generic
firefly will move randomly in the search space;
(3) The brightness of a firefly is determined by an objective function. For a maximization
problem, the brightness can simply be proportional to the objective function.
The attractiveness (r) of a firefly is proportional to the brightness and decreases with distance r,
because the light is absorbed in the media, as a consequence luminosity becomes weaker with
the distance from source, so we have:](https://image.slidesharecdn.com/ijip-1171-191010065005/85/Color-Image-Segmentation-Based-On-Principal-Component-Analysis-With-Application-of-Firefly-Algorithm-And-Gaussian-Mixture-Model-3-320.jpg)
![Giuliani Donatella
International Journal of Image Processing (IJIP), Volume (12) : Issue (4) : 2018 104
where is the attractiveness at and γ is the light absorption coefficient. As a firefly i is
attracted to another brighter j, its movement is described at time t by:
(1)
where represents the distance between the two fireflies. The second term is due to the
attraction, while the third term defines the random component through the casual values ,
drawn from a Gaussian distribution at a given iteration. Thus, describes a simple random
walk. The value of expresses the variation of attractiveness, = 0 corresponds to constant
attractiveness and, conversely, as →∞ the attractiveness tends to zero, which is equivalent to a
totally random search. Given the relevant level of variability of gray intensity histograms for real
images, in this unsupervised clustering method, we proposed the Firefly Algorithm because it
fulfils the aim of searching local and global maxima simultaneously, due to the decreasing of
attractiveness (r) with distance. In order to capture the most of significant histogram peaks, the
objective function is defined as the relative change of pixel frequency, therefore a firefly is
attracted towards the others close by it but having meaningfully greater values of pixel frequency.
In the following applications, the fireflies used as search agents are 30, the average scale L is set
equal to 256 which is the number of gray levels, and the light absorption coefficient is set equal
to . In order to avoid an excessive erratic motion in the search space, the random
component is reduced during iterations, as with and . After
evaluating automatically the number K of clusters through the global maxima derived by the FA
algorithm, the corresponding gray-levels intensities have been assigned as initial means
to the Gaussian Mixture Model [22], [23]. The initial standard deviations are
approximately computed through the differ--rences respect to the nearest centroids.
A Gaussian Mixture Model (GMM) is a parametric probability density function represented as a
weighted sum of Gaussian components. In this work GMM parameters are estimated from data
using the iterative Expectation-Maximization (EM) algorithm. Let us recall that a univariate
Gaussian density distribution is expressed by:
where represents a Gaussian distribution of mean and standard deviation A
Gaussian mixture model is a weighted sum of K components of Gaussian densities, analytically
given by:
(2)
Equation (2) represents a linear superposition of probability densities in which the mixing
coefficients indicate the weight of each distribution. According to the first and second axiom of
probability theory, these coefficients must satisfy the following relations:
Thus, a Gaussian mixture model is parametrized by means , variances and the mixture
weights of all components. We can think of the mixing coefficients as prior probabilities
corresponding to each component:](https://image.slidesharecdn.com/ijip-1171-191010065005/85/Color-Image-Segmentation-Based-On-Principal-Component-Analysis-With-Application-of-Firefly-Algorithm-And-Gaussian-Mixture-Model-4-320.jpg)
![Giuliani Donatella
International Journal of Image Processing (IJIP), Volume (12) : Issue (4) : 2018 105
where is the number of image points and are the numbers of data belonging to
the k-th cluster. The GMM parameters have been calculated using the Expectation Maximization
(EM) algorithm. This algorithm is an iterative optimization technique that starts from some initial
estimation of parameters and then proceeds to iteratively update them until convergence is
detected. In short it consists of four basic steps:
1) The Initialization Step: define initial guesses for parameters, in this context they have been
derived by the FA algorithm
2) The Expectation Step: compute the responsibilities Eq. (3), namely the posterior
probabilities of a given gray intensity x to belong to the k-th cluster, according to the Bayes
rule we have:
(3)
3) The Maximization Step: re-estimate the parameters using Eq. (4) and the current
responsabilities, given by Eq. (3):
(4)
4) Compute convergence by the value of log likelihood after each iteration, halting if it does
not change in a significant manner from one iteration to the next:
Iterate Expectation Step (2) and Maximization Step (3) until convergence.
After determining the parameter values with EM technique, we have proceeded to the assignment
of pixels of a given gray level to the cluster by means the evaluation of the maximum value of
responsibilities:
all the pixels with gray level are attributed to the -th cluster, given that, by definition,
represents the probability of the -th GMM’s component to have generated the value . The
proposed segmentation method performs classification of pixels in a straightforward and effective
way reducing greatly the computational costs [24].
4. EXPERIMENTAL RESULTS
In this section we present some experimental results obtained basically with segmentation of test
images extracted from Berkeley Segmentation Dataset BSDS300 [25]. Firstly, we applied our
method on Iris, the test image shown in Fig.1. A de-correlated image has been produced on
HSV space, as we can see in Fig.1 (on the left) the outcome gives prominence to pixel colors,
increasing the level of contrast.](https://image.slidesharecdn.com/ijip-1171-191010065005/85/Color-Image-Segmentation-Based-On-Principal-Component-Analysis-With-Application-of-Firefly-Algorithm-And-Gaussian-Mixture-Model-5-320.jpg)
![Giuliani Donatella
International Journal of Image Processing (IJIP), Volume (12) : Issue (4) : 2018 106
FIGURE 1: Original and De-correlated Images.
Afterwards, the de-correlated image has been projected on the principal component , the
derived image is represented in Fig.2. Given the relevant level of variability of gray intensity
histograms for real images (see the enlarged histogram in Fig.3), in this unsupervised clustering
method we propose the use of a meta-heuristic algorithm, more specifically the Firefly Algorithm
(FA). The FA fulfils the aim of searching simultaneously local and global maxima, due to the
decreasing of attractiveness (r) with distance. In order to capture the most of significant
histogram peaks, the objective function is defined as the relative change of pixel frequency,
therefore a firefly is attracted towards the others close by it but having meaningfully greater
values of pixel frequency. In the present application, the fireflies used as search agents are 30,
the average scale L is set equal to 256 which is the number of gray levels, the light absorption
coefficient is defined as . In order to avoid an excessive erratic motion in the search
space, the random component may be reduced during iterations, so decreases as
with and .
-
FIGURE 2: Iris Grayscale Image with PCA.
After evaluating automatically the number K of clusters through the maxima derived by FA (Fig.3
on then left), the corresponding gray-levels intensities have been assigned as initial means
to the Gaussian Mixture Model [26], [27]. The initial standard deviations are
approximately computed through the differences respect to the nearest centroids, on the contrary
the initial centroids of clusters are issued by FA algorithm.](https://image.slidesharecdn.com/ijip-1171-191010065005/85/Color-Image-Segmentation-Based-On-Principal-Component-Analysis-With-Application-of-Firefly-Algorithm-And-Gaussian-Mixture-Model-6-320.jpg)
![Giuliani Donatella
International Journal of Image Processing (IJIP), Volume (12) : Issue (4) : 2018 107
FIGURE 3: Grayscale Image Histogram and Maxima Computed with FA.
FIGURE 4: Grayscale Histogram and Gaussian Mixture Model.
To evaluate the consistency of this proposed clustering algorithm, the quality of final outcomes is
estimated by using several validation measures, more precisely: the Root Mean Square Error
(RMSE), the Normalized Correlation Coefficient (NK) and finally the Davies-Bouldin (DB) index
[28], [29]. The RMSE is the simplest validity index, a large value of RMSE means that the image
is of poor quality, given an image and the segmented image
, it is defined as:
The normalized correlation coefficient (NK) quantifies in percentage the level of correlation
between the two images and it is expressed as follows:
Finally, for testing the consistency of the method, we have calculated the Davies-Bouldin index,
that is based on similarity measures between clusters, obtained through the dispersion of
each cluster and the dissimilarity measures . Usually, given a partition of an initial dataset I in
disjoint clusters of cardinality , is defined in the following way:](https://image.slidesharecdn.com/ijip-1171-191010065005/85/Color-Image-Segmentation-Based-On-Principal-Component-Analysis-With-Application-of-Firefly-Algorithm-And-Gaussian-Mixture-Model-7-320.jpg)


![Giuliani Donatella
International Journal of Image Processing (IJIP), Volume (12) : Issue (4) : 2018 111
centroids. Their initial estimates, computed by a metaheuristic algorithm, are used as initial
values for evaluating the GMM parameters. The results appear fairly solid and reliable, as can be
inferred by the validation analysis performed on the test image analysed in this paper. A
noteworthy advantage of the proposed methodology derives from the use of the maxima of
responsibilities for pixel assignment, that implies a consistent reduction of computational costs.
6. REFERENCES
[1] S. Di Zenzo, “A note on the gradient of a multi-image”, Comput. Vision and Graph. Image
Process., vol. 36, (1986).
[2] W. Skarbek, A. Koschan, “Colour Image Segmentation: a Survey”, Technical Report,
Technical University Berlin, (1994).
[3] D. Comaniciu and P. Meer, “Robust Analysis of Feature Spaces: Color Image
Segmentation”, IEEE Conference on Computer Vision and Pattern Recognition, (1997).
[4] A. Jurio, M. Pagol, M. Galar, C. Lopez-Molina, D. Paternain, “A Comparative Study of
Different Color Spaces in Clustering Based Image Sementation”, Communications in
Computer and Information Science, Ed. Springer-Verlag, (2010).
[5] I. H. Osman, G. Laporte, “Metaheuristics: a bibliography”, Annals of Operations Research,
Vol. 63, N. 5, pp. 511-623, (1996).
[6] C. Blum, A. Roli, Metaheuristics in combinatorial optimization: Overview and conceptual
comparison, ACM Computing Surveys, Vol. 35, N. 3, pp. 268-308 (2003).
[7] F. Rothlauf, “Design of Modern Heuristics Principles and Application”, Springer (2011).
[8] C. Deepika, J. Nithya “Nature Inspired Metaheuristic Algorithms for Multilevel Thresholding
Image Segmentation - A Survey”, International Journal of Mathematical, Computational,
Physical, Electrical and Computer Engineering, Vol.8, N.10 (2014).
[9] J. Senthilnath, S.M. Okmar, V. Mani, “Clustering using a Firefly Algorithm: Performance
Study”, Swarm and Evolutionary Computation, Vol.1, pp 164-171, (2011).
[10] J. Senthilnath, S. Kulkarni, J.A. Benediktsson, X.S. Yang, “A Novel Approach for
Multispectral Satellite Image Classification Based on the Bat Algorithm”, IEEE Geoscience
and Remote Sensing Letters, (2016).
[11] V. Rajinikantha, M. S. Couceiro,“RGB Histogram based Color Image Segmentation Using
Firefly Algorithm”, Procedia Computer Science, Ed Elsevier, Vol. 46, pp. 1449 –1457,
(2015).
[12] M.H. Horng, T.W. Jiang, “Multilevel Image Thresholding Selection Based on the Firefly
Algorithm”, Proc. IEEE 7th Intern. Conf. on Ubiquitous Intelligence and Computing (2010).
[13] L. Lucchese, S. Mitra, “Color Image Segmentation: A State–of–the–Art Survey”, Image
Processing, Vision, and Pattern Recognition, Proc. of the Indian National Science Academy
(INSA–A), Vol. 67, N. 2, pp. 207–221, (2001).
[14] A.P. Vartak , V, Mankar, “Color Image Segmentation: a Survey”, Intern. Journ. Emerging
Techon. Advanced Engineering., Vol. 3, N. 2., (2013).
[15] N.M. Zaitoun, J.A. Musbah, “Survey on Image Segmentation Techniques”, Proc. Int. Conf.
on Communication, Management and Information Technology, Ed. Elsevier, (2015).](https://image.slidesharecdn.com/ijip-1171-191010065005/85/Color-Image-Segmentation-Based-On-Principal-Component-Analysis-With-Application-of-Firefly-Algorithm-And-Gaussian-Mixture-Model-11-320.jpg)
![Giuliani Donatella
International Journal of Image Processing (IJIP), Volume (12) : Issue (4) : 2018 112
[16] S. Dikbas, T. Arici, Y. Altunbasak, “Chrominance Edge preserving Grayscale Transformation
with approximate First Principal Component for Color Edge Detection”, Proc. IEEE Conf.
Image Process. (ICIP'07), Vol. 9, pp. 497–500, (2007).
[17] X. S. Yang, Nature-inspired Metaheuristic Algorithms, Luniver Press, United Kingdom,
(2008).
[18] X. S. Yang, Firefly Algorithm, Stochastic Test Functions and Design Optimization,
International Journal of Bio-Inspired Computation, Vol. 2, pp. 78-84, (2010).
[19] X.S. Yang, “Firefly Algorithm, Levy Flights and Global Optimization Research and
Development”, Intelligent Systems XXVI (Eds M. Bramer, R. Ellis, M. Petridis), Springer
London, pp. 209-218, (2010).
[20] J. Senthilnath, S. N. Omkar, V. Mani, “Clustering using Firefly Algorithm: Performance
Study”, Swarm and Evolutionary Computation, Elsevier, Vol.1, pp 164–171, (2011).
[21] S. Fong, S. Deb, X.S. Yang, Y. Zhuang, “Towards Enhancement of Performance of K-
Means Clustering Using Nature-Inspired Optimization Algorithms”, The Scientific World
Journal, Vol. 2014, (2014).
[22] B.G. Lindsay, “Mixture Models: Theory, Geometry and Applications”, NFS-CBMS Regional
Conference Series in Probability and Statistics (1995).
[23] G.J. McLachlan, K.E. Basford, Mixture Models: Inference and Applications to Clustering, Ed.
Marcel Dekker, New York, (1988).
[24] D. Giuliani, “A Grayscale Segmentation Approach using the Firefly Algorithm and the
Gaussian Mixture Model”, International Journal of Swarm Intelligence Research, Vol. 9,
Issue 1, Ed. IGI Global (2017).
[25] D. Martin, C. Fowlkes, D. Tal, J. Malik, “A database of human segmented natural images
and its application to evaluating segmentation algorithms and measuring ecological
statistics,” ICCV, (2001).
[26] B.G. Lindsay, “Mixture Models: Theory, Geometry and Applications”, NFS-CBMS Regional
Conference Series in Probability and Statistics, (1995).
[27] G.J. McLachlan, K.E. Basford, Mixture Models: Inference and Applications to Clustering, Ed.
Marcel Dekker, New York, (1988).
[28] K. Jaskirat, A. Sunil, V. Renu, “A comparative analysis of thresholding and edge detection
segmentation techniques”, International Journal of Computer Applications, Vol. 39, (2012).
[29] R.N. Nihar, K.M. Bikram, K.R. Amiya, “A Time Efficient Clustering Algorithm for Gray Scale
Image Segmentation”, International Journal of Computer Vision and Image Processing, Vol.
3, N. 1, pp 22-32, (2013).](https://image.slidesharecdn.com/ijip-1171-191010065005/85/Color-Image-Segmentation-Based-On-Principal-Component-Analysis-With-Application-of-Firefly-Algorithm-And-Gaussian-Mixture-Model-12-320.jpg)
Color Image Segmentation Based On Principal Component Analysis With Application of Firefly Algorithm And Gaussian Mixture Model
- 1. Giuliani Donatella International Journal of Image Processing (IJIP), Volume (12) : Issue (4) : 2018 101 Color Image Segmentation Based On Principal Component Analysis With Application of Firefly Algorithm And Gaussian Mixture Model Giuliani Donatella [email protected] University of Bologna Bologna, Italy Abstract In this paper we propose a segmentation method for multi-spectral images in the HSV space, based on the Principal Component Analysis to generate grayscale images. Then the Firefly Algorithm has been applied on the gray-level images in a histogram-based research of cluster centroids. The FA is a metaheuristic optimization algorithm, centered on the flashing behaviour of fireflies. The Firefly Algorithm is performed to determine automatically the number of clusters and to select the gray levels for partitioning pixels into homogeneous regions. Successively, these gray values are employed during the initialization step of a Gaussian Mixture Model for estimation of parameters, evaluated through the Expectation-Maximization technique. The coefficients of the linear super-position of Gaussians can be regarded as the prior probabilities of each component. Applying the Bayes rule, the posterior probabilities have been estimated and their maxima are used to assign each pixel to the clusters, according to their gray values. Keywords: Color Image Segmentation, Image Clustering, Firefly Algorithm, Gaussian Mixture Model. 1. INTRODUCTION Image segmentation is the process of separating an image into disjoint and homogeneous components. Because of the enormous variety and complexity of color images, robust and efficient segmentation approaches are far from satisfying, especially when applied on images of the real world. Color image segmentation attracts more and more interest, mainly because it provides a greater amount of information respect to grayscale images. Grayscale image segmentation methods are categorized recurring to the two properties utilized for partitioning: discontinuity and similarity, the most common are the region-based and edge-based methods. In more details, region-based methods are founded on similarity, they segment an image recurring to low-level features of it, such as intensity, texture or color, assuming that pixels belong to the same region if they have similar characteristics. Hence they can work for colored images as well. On the contrary, color image edge-detection techniques are extension of monochromatic methods, they operate on the three color channels independently combining their final results. More explicitly, the gradient operators proposed for grayscale segmentation approaches, are extended to color images by taking the vector sum of gradients for each component [1]. The paradigms of gray level image segmentation, pixel-based, region-based or edge-based can be also used for color images. Besides, we must include the so called physics-based methods which take into account information about the exposure to light during image acquisition processes as well. In summary, color image segmentation methods may be classified into three different groups depending on the technique employed: 1) feature-space based techniques; 2) image domain based techniques; and 3) physics based techniques. The feature-space methods work in a certain color space, assuming that color is a constant property of the surface of each object within an image. Thus these methods map pixels into regions having homogenous characteristics or create some ad hoc histograms upon color features, such as hue. Generally, objects will appear as clusters or in correspondence of peaks within histograms, in the latter case. The
- 2. Giuliani Donatella International Journal of Image Processing (IJIP), Volume (12) : Issue (4) : 2018 102 image-domain based techniques, such as split and merge or region growing methods, perform a spatial grouping of pixels according to similarity or dissimilarity criteria to guarantee spatial compactness. Lastly, in the physics-based approach, all algorithms examine the objects portrayed in color images taking into account light exposure, highlights, and shadows. These phenomena frequently cause appearance of color variations of uniformly colored surfaces. To avoid over segmented regions, these algorithms analyze how light interacts with colored materials [2]. 2. PRELIMINARIES A color is perceived by human beings as a combination of the tri-stimuli captured by three different kinds of photoreceptors in the retina, called cones, whose spectral responses are centered on the wavelengths of red, green, blue. Therefore, a digital color image is represented by a two dimensional array of three dimensional vectors which represent the pixel's red, green and blue values, the three primary colors which form the color space. Although RGB image representation is the most often used, it is not adequate for performing color recognition in image analysis since this space has three independent channels, so any color can be created by combination of these three color bases. RGB color space is suitable for color display but it is not good for color scene segmentation and analysis because of the high correlation among the R, G, B components and the great sensitivity to variations in illumination [3]. For this reason, we have adopted HSV color space (Hue, Saturation, Value) given that it structures any color in the same way in which it is perceived by human eyes [4]. More precisely, hue is the color tone, i.e. red or yellow, saturation defines the amount of each color, i.e. dark green or pale green, finally the value, also called intensity or lightness, allows to distinguish between a dark or a light color. An accurate comparison study between different color spaces revealed that the HSV space provides good results in image segmentation [4]. 3. METHODOLOGY In this paper we propose a segmentation method based on pixel intensity without recurring to thresholding techniques. Firstly, the proposed segmentation algorithm performs the Principal Component Analysis on color images. PCA is a standard tool of modern data analysis that transforms a number of possible correlated variables into a smaller number of uncorrelated ones, preserving the most relevant information of the original data set. Then we proceeded to a histogram-based research of cluster centroids applying a meta-heuristic algorithm, the Firefly Algorithm (FA), belonging to a novel class of non-deterministic optimization methods. Over the last few decades, researchers started to use metaheuristic algorithms for clustering to overcome the weakness of the existing conventional methodologies, generally deterministic [5]. Metaheuristic algorithms are a class of approximate methods that allow to discover possible solutions exploring the search space in order to find near-optimal solutions. Shortly, metaheuristic algorithms are iteratively processes developed to search a solution that is good enough in a time that is small enough [6]. These algorithms are frequently nature-inspired, they have the advantages of finding global optima due to the action of multiple search agents, randomly generated [7]. Nature inspired metaheuristic algorithms are applied for multilevel thresholding image segmentation in a comparative study between Particle Swarm Optimization (PSO), Artificial Bee Colony Optimization (ABC), Ant Colony Optimization (ACO) and Cuckoo Search (CS) algorithms, that are investigated in partitioning gray-scale images [8]. The well-known K-means clustering algorithm is applied by an optimization technique based on FA algorithm, with the squared error as objective function. The performance of the FA is compared with other two nature-inspired methods, ACO and PSO, and other nine traditional approaches [9]. A bio-inspired segmentation algorithm is proposed for solving crop type classification problems using a multispectral satellite image [10]. A colour image partitioning procedure is implemented applying a multi-level thresholding approach on the three R, G and B histograms, analyzed independently [11]. The predefined number of optimal thresholds for each colour component are attained by maximizing
- 3. Giuliani Donatella International Journal of Image Processing (IJIP), Volume (12) : Issue (4) : 2018 103 Otsu’s between-class variance function, recurring to the Firefly Algorithm. The maximum entropy thresholding method is widely used in literature, this approach has been performed in partitioning multi-channels images employing Firefly Algorithm [12], in this context entropy operators yield high values in regions characterized by drastic chromaticity variations. For an exhaustive review of the more conventional segmentation methods refer to [13], [14], [15]. In the present work we started with a pre-processing step, during which the original image has been de-correlated in order to improve its appearance and to enhance the contrast between pixel colors. Then applying PCA, the image dimensionality has been reduced from the three- dimensional HSV color space to the one-dimensional gray representation [16]. To this aim, given a color image with components , let be the vector mean, expressed by: the covariance matrix C is evaluated as: So, if we denote with 1 2 3 and , respectively, the eigenvalues and eigenvectors of C, the components of de-correlated image may be computed as: Through PCA, the de-correlated image is projected along the direction of the principal component in which it has been registered the highest variability, therefore the intensity image I is generated by: Once the gray image has been obtained, we proceed in evaluating automatically the number of clusters and the associated representative levels through a histogram-based segmentation approach by means the Firefly Algorithm. The Firefly Algorithm, developed by Yang X.S. [17], employs fireflies as search agents making use of their idealized flashing characteristics. In describing the Firefly Algorithm, three fundamental rules may be delineated [18],[19],[20],[21]: (1) All fireflies are unisex so that one firefly will be attracted to other fireflies regardless of their sex; (2) Attractiveness is proportional to their brightness, thus for any two flashing fireflies, the less bright one will move towards the brighter one. The attractiveness is proportional to brightness, decreasing as their distance increases. If there is no brighter one, a generic firefly will move randomly in the search space; (3) The brightness of a firefly is determined by an objective function. For a maximization problem, the brightness can simply be proportional to the objective function. The attractiveness (r) of a firefly is proportional to the brightness and decreases with distance r, because the light is absorbed in the media, as a consequence luminosity becomes weaker with the distance from source, so we have:
- 4. Giuliani Donatella International Journal of Image Processing (IJIP), Volume (12) : Issue (4) : 2018 104 where is the attractiveness at and γ is the light absorption coefficient. As a firefly i is attracted to another brighter j, its movement is described at time t by: (1) where represents the distance between the two fireflies. The second term is due to the attraction, while the third term defines the random component through the casual values , drawn from a Gaussian distribution at a given iteration. Thus, describes a simple random walk. The value of expresses the variation of attractiveness, = 0 corresponds to constant attractiveness and, conversely, as →∞ the attractiveness tends to zero, which is equivalent to a totally random search. Given the relevant level of variability of gray intensity histograms for real images, in this unsupervised clustering method, we proposed the Firefly Algorithm because it fulfils the aim of searching local and global maxima simultaneously, due to the decreasing of attractiveness (r) with distance. In order to capture the most of significant histogram peaks, the objective function is defined as the relative change of pixel frequency, therefore a firefly is attracted towards the others close by it but having meaningfully greater values of pixel frequency. In the following applications, the fireflies used as search agents are 30, the average scale L is set equal to 256 which is the number of gray levels, and the light absorption coefficient is set equal to . In order to avoid an excessive erratic motion in the search space, the random component is reduced during iterations, as with and . After evaluating automatically the number K of clusters through the global maxima derived by the FA algorithm, the corresponding gray-levels intensities have been assigned as initial means to the Gaussian Mixture Model [22], [23]. The initial standard deviations are approximately computed through the differ--rences respect to the nearest centroids. A Gaussian Mixture Model (GMM) is a parametric probability density function represented as a weighted sum of Gaussian components. In this work GMM parameters are estimated from data using the iterative Expectation-Maximization (EM) algorithm. Let us recall that a univariate Gaussian density distribution is expressed by: where represents a Gaussian distribution of mean and standard deviation A Gaussian mixture model is a weighted sum of K components of Gaussian densities, analytically given by: (2) Equation (2) represents a linear superposition of probability densities in which the mixing coefficients indicate the weight of each distribution. According to the first and second axiom of probability theory, these coefficients must satisfy the following relations: Thus, a Gaussian mixture model is parametrized by means , variances and the mixture weights of all components. We can think of the mixing coefficients as prior probabilities corresponding to each component:
- 5. Giuliani Donatella International Journal of Image Processing (IJIP), Volume (12) : Issue (4) : 2018 105 where is the number of image points and are the numbers of data belonging to the k-th cluster. The GMM parameters have been calculated using the Expectation Maximization (EM) algorithm. This algorithm is an iterative optimization technique that starts from some initial estimation of parameters and then proceeds to iteratively update them until convergence is detected. In short it consists of four basic steps: 1) The Initialization Step: define initial guesses for parameters, in this context they have been derived by the FA algorithm 2) The Expectation Step: compute the responsibilities Eq. (3), namely the posterior probabilities of a given gray intensity x to belong to the k-th cluster, according to the Bayes rule we have: (3) 3) The Maximization Step: re-estimate the parameters using Eq. (4) and the current responsabilities, given by Eq. (3): (4) 4) Compute convergence by the value of log likelihood after each iteration, halting if it does not change in a significant manner from one iteration to the next: Iterate Expectation Step (2) and Maximization Step (3) until convergence. After determining the parameter values with EM technique, we have proceeded to the assignment of pixels of a given gray level to the cluster by means the evaluation of the maximum value of responsibilities: all the pixels with gray level are attributed to the -th cluster, given that, by definition, represents the probability of the -th GMM’s component to have generated the value . The proposed segmentation method performs classification of pixels in a straightforward and effective way reducing greatly the computational costs [24]. 4. EXPERIMENTAL RESULTS In this section we present some experimental results obtained basically with segmentation of test images extracted from Berkeley Segmentation Dataset BSDS300 [25]. Firstly, we applied our method on Iris, the test image shown in Fig.1. A de-correlated image has been produced on HSV space, as we can see in Fig.1 (on the left) the outcome gives prominence to pixel colors, increasing the level of contrast.
- 6. Giuliani Donatella International Journal of Image Processing (IJIP), Volume (12) : Issue (4) : 2018 106 FIGURE 1: Original and De-correlated Images. Afterwards, the de-correlated image has been projected on the principal component , the derived image is represented in Fig.2. Given the relevant level of variability of gray intensity histograms for real images (see the enlarged histogram in Fig.3), in this unsupervised clustering method we propose the use of a meta-heuristic algorithm, more specifically the Firefly Algorithm (FA). The FA fulfils the aim of searching simultaneously local and global maxima, due to the decreasing of attractiveness (r) with distance. In order to capture the most of significant histogram peaks, the objective function is defined as the relative change of pixel frequency, therefore a firefly is attracted towards the others close by it but having meaningfully greater values of pixel frequency. In the present application, the fireflies used as search agents are 30, the average scale L is set equal to 256 which is the number of gray levels, the light absorption coefficient is defined as . In order to avoid an excessive erratic motion in the search space, the random component may be reduced during iterations, so decreases as with and . - FIGURE 2: Iris Grayscale Image with PCA. After evaluating automatically the number K of clusters through the maxima derived by FA (Fig.3 on then left), the corresponding gray-levels intensities have been assigned as initial means to the Gaussian Mixture Model [26], [27]. The initial standard deviations are approximately computed through the differences respect to the nearest centroids, on the contrary the initial centroids of clusters are issued by FA algorithm.
- 7. Giuliani Donatella International Journal of Image Processing (IJIP), Volume (12) : Issue (4) : 2018 107 FIGURE 3: Grayscale Image Histogram and Maxima Computed with FA. FIGURE 4: Grayscale Histogram and Gaussian Mixture Model. To evaluate the consistency of this proposed clustering algorithm, the quality of final outcomes is estimated by using several validation measures, more precisely: the Root Mean Square Error (RMSE), the Normalized Correlation Coefficient (NK) and finally the Davies-Bouldin (DB) index [28], [29]. The RMSE is the simplest validity index, a large value of RMSE means that the image is of poor quality, given an image and the segmented image , it is defined as: The normalized correlation coefficient (NK) quantifies in percentage the level of correlation between the two images and it is expressed as follows: Finally, for testing the consistency of the method, we have calculated the Davies-Bouldin index, that is based on similarity measures between clusters, obtained through the dispersion of each cluster and the dissimilarity measures . Usually, given a partition of an initial dataset I in disjoint clusters of cardinality , is defined in the following way:
- 8. Giuliani Donatella International Journal of Image Processing (IJIP), Volume (12) : Issue (4) : 2018 108 where represents the intra-cluster standard deviation and measures the distance between two different clusters and , through the distance of their centre points. The Davies-Bouldin index estimates the average of similarity between each cluster as: even with this validation index a lower value implies a better clustering segmentation. FIGURE 5: Gray segmented image of Iris. The segmented image with four clusters is displayed in Fig.5, Table 1 reports the GMM parameters and the estimated validation indices, in the last row. We point out that the final value of standard deviations of some clusters are rather different respect to the initial ones. To this end we recall that, during the starting step, variances were evaluated approximately by minimizing the deviations from the initial cluster centroids. TABLE 1: Cluster Parameters Evaluated with GMM. Finally, using the original data set as reference image, we have performed a colorization process on the segmented grayscale image, recurring to the means of the three colour channels computed on pixels belonging to the same cluster, the final result is shown in Fig.6. K = 4 Data Clusters (N. iterations EM =10) N.pixels: 162 x 149 = 24138 k initial 39.00 76.29 183.23 198.05 k final 42.18 71.65 187.63 193.22 k initial 5.66 2.86 4.57 5.32 k final 8.18 4.19 10.43 19.47 k 13255 1804 4338 4741 kfinal 0.574 0.049 0.196 0.179 RMSE 0.069 NK 0.981 DB 2.814
- 9. Giuliani Donatella International Journal of Image Processing (IJIP), Volume (12) : Issue (4) : 2018 109 FIGURE 6: Color Segmented Image of Iris. As a second test image let us consider the butterfly displayed in the training image 138 of Dataset BSDS300: FIGURE 7: Butterfly original image and grayscale image with PCA. Through the FA algorithm the number of derived maxima is K = 5 (Fig. 8) In Table 2 are explicitly specified the initial and final values of centroids. After ten iterations of the Expectation Maximization algorithm, the convergence to final values is reached within a predefined precision level. These values do not present significant differences respect to the initial ones. The validation indices confirm the reliability of this feature-space based method for image segmentation. TABLE 2: Cluster Parameters Evaluated with GMM. K = 5 Data Clusters (N. iterations EM =10) N.pixels: 321x481 = 154401 k initial 86.00 115.73 166.30 208.94 251.68 k final 84.66 115.71 167.39 210.90 246.50 k initial 9.15 4.93 4.77 4.86 2.04 k final 17.91 13.74 12,45 12.81 4.18 k 63476 26001 29369 33012 2543 kfinal 0.408 0.170 0.192 0.213 0.015 RMSE 0.023 NK 0.988 DB 0.198
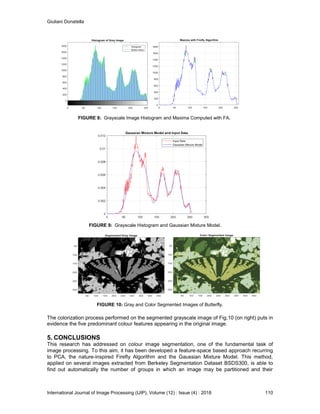
- 10. Giuliani Donatella International Journal of Image Processing (IJIP), Volume (12) : Issue (4) : 2018 110 FIGURE 8: Grayscale Image Histogram and Maxima Computed with FA. FIGURE 9: Grayscale Histogram and Gaussian Mixture Model. FIGURE 10: Gray and Color Segmented Images of Butterfly. The colorization process performed on the segmented grayscale image of Fig.10 (on right) puts in evidence the five predominant colour features appearing in the original image. 5. CONCLUSIONS This research has addressed on colour image segmentation, one of the fundamental task of image processing. To this aim, it has been developed a feature-space based approach recurring to PCA, the nature-inspired Firefly Algorithm and the Gaussian Mixture Model. This method, applied on several images extracted from Berkeley Segmentation Dataset BSDS300, is able to find out automatically the number of groups in which an image may be partitioned and their
- 11. Giuliani Donatella International Journal of Image Processing (IJIP), Volume (12) : Issue (4) : 2018 111 centroids. Their initial estimates, computed by a metaheuristic algorithm, are used as initial values for evaluating the GMM parameters. The results appear fairly solid and reliable, as can be inferred by the validation analysis performed on the test image analysed in this paper. A noteworthy advantage of the proposed methodology derives from the use of the maxima of responsibilities for pixel assignment, that implies a consistent reduction of computational costs. 6. REFERENCES [1] S. Di Zenzo, “A note on the gradient of a multi-image”, Comput. Vision and Graph. Image Process., vol. 36, (1986). [2] W. Skarbek, A. Koschan, “Colour Image Segmentation: a Survey”, Technical Report, Technical University Berlin, (1994). [3] D. Comaniciu and P. Meer, “Robust Analysis of Feature Spaces: Color Image Segmentation”, IEEE Conference on Computer Vision and Pattern Recognition, (1997). [4] A. Jurio, M. Pagol, M. Galar, C. Lopez-Molina, D. Paternain, “A Comparative Study of Different Color Spaces in Clustering Based Image Sementation”, Communications in Computer and Information Science, Ed. Springer-Verlag, (2010). [5] I. H. Osman, G. Laporte, “Metaheuristics: a bibliography”, Annals of Operations Research, Vol. 63, N. 5, pp. 511-623, (1996). [6] C. Blum, A. Roli, Metaheuristics in combinatorial optimization: Overview and conceptual comparison, ACM Computing Surveys, Vol. 35, N. 3, pp. 268-308 (2003). [7] F. Rothlauf, “Design of Modern Heuristics Principles and Application”, Springer (2011). [8] C. Deepika, J. Nithya “Nature Inspired Metaheuristic Algorithms for Multilevel Thresholding Image Segmentation - A Survey”, International Journal of Mathematical, Computational, Physical, Electrical and Computer Engineering, Vol.8, N.10 (2014). [9] J. Senthilnath, S.M. Okmar, V. Mani, “Clustering using a Firefly Algorithm: Performance Study”, Swarm and Evolutionary Computation, Vol.1, pp 164-171, (2011). [10] J. Senthilnath, S. Kulkarni, J.A. Benediktsson, X.S. Yang, “A Novel Approach for Multispectral Satellite Image Classification Based on the Bat Algorithm”, IEEE Geoscience and Remote Sensing Letters, (2016). [11] V. Rajinikantha, M. S. Couceiro,“RGB Histogram based Color Image Segmentation Using Firefly Algorithm”, Procedia Computer Science, Ed Elsevier, Vol. 46, pp. 1449 –1457, (2015). [12] M.H. Horng, T.W. Jiang, “Multilevel Image Thresholding Selection Based on the Firefly Algorithm”, Proc. IEEE 7th Intern. Conf. on Ubiquitous Intelligence and Computing (2010). [13] L. Lucchese, S. Mitra, “Color Image Segmentation: A State–of–the–Art Survey”, Image Processing, Vision, and Pattern Recognition, Proc. of the Indian National Science Academy (INSA–A), Vol. 67, N. 2, pp. 207–221, (2001). [14] A.P. Vartak , V, Mankar, “Color Image Segmentation: a Survey”, Intern. Journ. Emerging Techon. Advanced Engineering., Vol. 3, N. 2., (2013). [15] N.M. Zaitoun, J.A. Musbah, “Survey on Image Segmentation Techniques”, Proc. Int. Conf. on Communication, Management and Information Technology, Ed. Elsevier, (2015).
- 12. Giuliani Donatella International Journal of Image Processing (IJIP), Volume (12) : Issue (4) : 2018 112 [16] S. Dikbas, T. Arici, Y. Altunbasak, “Chrominance Edge preserving Grayscale Transformation with approximate First Principal Component for Color Edge Detection”, Proc. IEEE Conf. Image Process. (ICIP'07), Vol. 9, pp. 497–500, (2007). [17] X. S. Yang, Nature-inspired Metaheuristic Algorithms, Luniver Press, United Kingdom, (2008). [18] X. S. Yang, Firefly Algorithm, Stochastic Test Functions and Design Optimization, International Journal of Bio-Inspired Computation, Vol. 2, pp. 78-84, (2010). [19] X.S. Yang, “Firefly Algorithm, Levy Flights and Global Optimization Research and Development”, Intelligent Systems XXVI (Eds M. Bramer, R. Ellis, M. Petridis), Springer London, pp. 209-218, (2010). [20] J. Senthilnath, S. N. Omkar, V. Mani, “Clustering using Firefly Algorithm: Performance Study”, Swarm and Evolutionary Computation, Elsevier, Vol.1, pp 164–171, (2011). [21] S. Fong, S. Deb, X.S. Yang, Y. Zhuang, “Towards Enhancement of Performance of K- Means Clustering Using Nature-Inspired Optimization Algorithms”, The Scientific World Journal, Vol. 2014, (2014). [22] B.G. Lindsay, “Mixture Models: Theory, Geometry and Applications”, NFS-CBMS Regional Conference Series in Probability and Statistics (1995). [23] G.J. McLachlan, K.E. Basford, Mixture Models: Inference and Applications to Clustering, Ed. Marcel Dekker, New York, (1988). [24] D. Giuliani, “A Grayscale Segmentation Approach using the Firefly Algorithm and the Gaussian Mixture Model”, International Journal of Swarm Intelligence Research, Vol. 9, Issue 1, Ed. IGI Global (2017). [25] D. Martin, C. Fowlkes, D. Tal, J. Malik, “A database of human segmented natural images and its application to evaluating segmentation algorithms and measuring ecological statistics,” ICCV, (2001). [26] B.G. Lindsay, “Mixture Models: Theory, Geometry and Applications”, NFS-CBMS Regional Conference Series in Probability and Statistics, (1995). [27] G.J. McLachlan, K.E. Basford, Mixture Models: Inference and Applications to Clustering, Ed. Marcel Dekker, New York, (1988). [28] K. Jaskirat, A. Sunil, V. Renu, “A comparative analysis of thresholding and edge detection segmentation techniques”, International Journal of Computer Applications, Vol. 39, (2012). [29] R.N. Nihar, K.M. Bikram, K.R. Amiya, “A Time Efficient Clustering Algorithm for Gray Scale Image Segmentation”, International Journal of Computer Vision and Image Processing, Vol. 3, N. 1, pp 22-32, (2013).