


![(c)Dr Umang@ITS
Files Associated with R
➢ *.r - An R script.
➢ *.rmd - An R Markdown file. It is saved in format that enables creation of dynamic
presentation, reports and documents.
➢ *.rnw - An R Sweave file.
➢ *.rds - A file containing a [single] R object; can be created using saveRDS(), and loaded
using readRDS().
➢ *.rdata - A file containing one or more R objects or workspaces; can be created
using save(), and loaded using load().
SUMMARY
R Reference Card](https://image.slidesharecdn.com/dataanalyticsusingrprogramming-200518110004/85/Data-analytics-using-R-programming-17-320.jpg)


![(c)Dr Umang@ITS
2. Transforming Data (2)
To access data as a vector
acs_or[1,3]](https://image.slidesharecdn.com/dataanalyticsusingrprogramming-200518110004/85/Data-analytics-using-R-programming-49-320.jpg)


Data analytics using R programming
- 1. Data Analytics using R Dr Umang Associate Professor Institute of Technology & Science, Ghaziabad Email: [email protected], [email protected] ‘What gets measured, gets managed.’ – Peter Drucker (c)Dr Umang@ITS
- 2. (c)Dr Umang@ITS Data Analytics Process of examining data sets in order to draw conclusions about the information they contain, increasingly with the aid of specialized systems and software.
- 3. (c)Dr Umang@ITS IDC predicts that by 2021, 25% of large enterprises will have supplemented data scientists with data ethnographers to provide contextual interpretations of data by using qualitative research methods that uncover people’s emotions, stories, and perceptions of their world.
- 4. (c)Dr Umang@ITS Hired a Data Scientist Descriptive Analytics -> Predictive Analytics / Optimization -> Automation Beautiful Story………………………………..
- 5. (c)Dr Umang@ITS Data Analytics Data Analytics helps organizations harness their data and use it to identify new opportunities. • Data Mining • Data Management • Statistical Analysis • Data Presentation. Depend on the data being used and the goal of the analysis. Primary steps Extracting data from unstructured data sources. Involves designing and implementing databases How the insights are created from data Allows insights to be shared with stakeholders. Important tool: Data visualization
- 6. (c)Dr Umang@ITS Data Analytics Descriptive Analytics Diagnostic Analytics Predictive Analytics Prescriptive Analytics What has happened? What could happen in the future based on previous trends and patterns? What should business do?Why did it happen Identify anomalies Drill into the analytics (discovery) Determine causal relationships Observations, Case studies, and Surveys An increase in Twitter followers after a particular tweet How should we respond to those potential future events? Send marketing campaigns to customers who are most likely to buy Based on the combination of AI- infused software and the domain expertise of people promise to be the most effective means for answering the question: Why did it happen Google's self-driving car https://dataconomy.com/2015/12/ho w-data-science-is-driving-the- driverless-car/
- 7. (c)Dr Umang@ITS Data Analytics for Connected Cars PATTERM MATCHING Apply to the moment-by-moment driving patterns and road behavior of all individuals who get behind the wheel of a particular vehicle. These patterns can be evaluated, linked to safe or risky behaviors, and combined with other data sources and vehicle information. Assess past patterns and driving behavior to make an informed judgment on the likelihood of various future possibilities. Combines intelligence and issues recommendations, guiding driver behavior to suit the situation based on past experiences. https://ims.tech/opinion/connected-car-analytics/
- 9. (c)Dr Umang@ITS Data Analytics using R Conceptualized & designed by John Tukey It enables data analysts to perform data analysis and visualization. Important coin : Exploratory data analysis - it is an approach of data analysis employed for summarizing and visualizing data set It is examination of data of data and relationships among variables through graphical and numerical methods. Important line of defense against bad data Business decisions are made unpolished visualization that come out of explotary data analysis. https://www.adma.com.au/resources/how-coca-cola-uses-data-to-supercharge-its-superbrand-status https://blog.storagecraft.com/real-data-analytics-success-stories/ https://analyticsindiamag.com/coca-cola-leans-on-data-analytics-ai-for-deeper-industry-insights/
- 10. (c)Dr Umang@ITS http://gfinak.github.io/Talks/RFlowToolsFlowCAP/index.html#1
- 11. Working with R Freely available under the GNU General Public License $R Command Prompt R plays a very important role in Data Science Data Scientists who are proficient in R make more than $117,000 (Rs 80,56,093) on an average per year. If you want to enter the field of Data Science and earn a lucrative salary, then you must definitely learn R. R is used at Facebook for social network analysis. It is being used at Twitter for semantic analysis as well as visualizations. R Shiny package Used for Data Analytics & Data Visualization Example of FLOSS Free /Libre and Open Source Software (c)Dr Umang@ITS
- 12. (c)Dr Umang@ITS Companies using R https://www.youtube.com/watch?v=Uenf8DbOjz0 Company Application/Contribution Twitter Monitor user experience Ford Analyze social media to support design decisions for their cars New York Times Infographics, data journalism Microsoft Released Microsoft R Open, an enhanced R distribution and Microsoft R server after acquiring Revolution Analytics in 2015 Human Rights Data Analysis Group Measure the impact of war Google Created the R style guide for the R user community inside Google, Economic forecasting , Advertisements effectiveness and Big Data Statistical Analysis Microsoft For gaming and Scientific Revenue Bing Social Search Awareness Ford Data Driven Decision Making Use cases NewScientist Data Visualization, Data Analysis for news articles Facebook Bigdata Visualization, human behavior with respect to post and status update Company Application/Contribution
- 13. (c)Dr Umang@ITS Explotary Data Analysis It is examination of data and relationships among variables through graphical and numerical methods. It can lead to insights into the process of building predictive models Business decisions are made unpolished visualization that come out of Explotary Data Analysis.
- 14. (c)Dr Umang@ITS
- 15. (c)Dr Umang@ITS
- 16. (c)Dr Umang@ITS R Studio & R RSTUDIO Free, open source IDE (integrated development environment) for R. You must install R before you can install RStudio. Interface is organized so that the user can clearly view graphs, data tables, R code, and output all at the same time. Offers an Import-Wizard-like feature that allows users to import CSV, Excel, SAS (*.sas), SPSS (*.sav), and Stata (*.dta) files into R without having to write the code to do so. ➢ R ➢ R is a free, open source software program for statistical analysis. ➢ Free and open source. ➢ Available for Windows, Macintosh, and Linux. ➢ Publication-quality graphs. ➢ Rivals, SAS and Stata in terms of availability of advanced statistical methods and algorithms, through availability of user-created packages. ➢ Packages for literate statistical programming - written reports and analysis code in one document. Important Websites. •The R Project for Statistical Computing •RStudio •RStudio Cloud
- 17. (c)Dr Umang@ITS Files Associated with R ➢ *.r - An R script. ➢ *.rmd - An R Markdown file. It is saved in format that enables creation of dynamic presentation, reports and documents. ➢ *.rnw - An R Sweave file. ➢ *.rds - A file containing a [single] R object; can be created using saveRDS(), and loaded using readRDS(). ➢ *.rdata - A file containing one or more R objects or workspaces; can be created using save(), and loaded using load(). SUMMARY R Reference Card
- 19. (c)Dr Umang@ITS Install R Follow the steps below with respect to the operating system you are using For Windows : Download the binary setup file for R from the following link.( R for Windows ) Open the downloaded .exe file and Install R For Mac : Download the appropriate version of .pkg file form the following link. ( R for Mac ) Open the downloaded .pkg file and Install R For Linux : For complete R System installation in Linux, follow the instructions on the following link ( Link ) For Ubuntu with Apt-get installed, execute sudo apt-get install r-base in terminal.
- 20. (c)Dr Umang@ITS
- 21. (c)Dr Umang@ITS R Studio RStudio is an integrated development environment (IDE) for R. It includes a console, syntax-highlighting editor that supports direct code execution, as well as tools for plotting, history, debugging and workspace management. Important Steps for Installation Install R Install R-Studio Install R-Packages (If needed)
- 22. (c)Dr Umang@ITS R Studio :
- 23. (c)Dr Umang@ITS Install R Studio Run R studio Click on the Packages tab in the bottom-right section and then click on install. The following dialog box will appear In the Install Packages dialog, write the package name you want to install under the Packages field and then click install. This will install the package you searched for or give you a list of matching package based on your package text. This completes the installation procedure for R Studio.
- 24. (c)Dr Umang@ITS R Studio on Windows To Install RStudio Go to www.rstudio.com and click on the "Download RStudio" button. Click on "Download RStudio Desktop." Click on the version recommended for your system, or the latest Windows version, and save the executable file. Run the .exe file and follow the installation instructions.
- 25. (c)Dr Umang@ITS Why R?? Many calculations done with vectors R is a vector language, so anyone can add functions to a single Vector without putting in a loop. Hence, R is powerful and faster than other languages. Statistical Language R used in biology, genetics as well as in statistics.
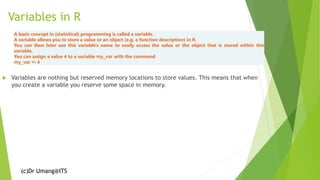
- 26. (c)Dr Umang@ITS Variables in R Variables are nothing but reserved memory locations to store values. This means that when you create a variable you reserve some space in memory. A basic concept in (statistical) programming is called a variable. A variable allows you to store a value or an object (e.g. a function description) in R. You can then later use this variable's name to easily access the value or the object that is stored within this variable. You can assign a value 4 to a variable my_var with the command my_var <- 4
- 27. (c)Dr Umang@ITS Assignment Suppose you have a fruit basket with five apples. As a data analyst in training, you want to store the number of apples in a variable with the name my_apples. Type the following code in the editor: my_apples <- 5. This will assign the value 5 to my_apples. Type: my_apples below the second comment. This will print out the value of my_apples. Click 'Submit Answer', and look at the console: you see that the number 5 is printed. So R now links the variable my_apples to the value 5. •Assign to my_oranges the value 6. •Add the variables my_apples and my_oranges and have R simply print the result. •Assign the result of adding my_apples and my_oranges to a new variable my_fruit.
- 28. (c)Dr Umang@ITS CREATE a Vector c()
- 29. (c)Dr Umang@ITS
- 30. (c)Dr Umang@ITS Single Value Vector
- 31. (c)Dr Umang@ITS
- 32. (c)Dr Umang@ITS
- 33. (c)Dr Umang@ITS
- 34. (c)Dr Umang@ITS
- 35. (c)Dr Umang@ITS
- 36. (c)Dr Umang@ITS
- 37. (c)Dr Umang@ITS
- 38. (c)Dr Umang@ITS
- 39. (c)Dr Umang@ITS
- 40. (c)Dr Umang@ITS
- 41. (c)Dr Umang@ITS
- 42. (c)Dr Umang@ITS
- 43. (c)Dr Umang@ITS
- 45. (c)Dr Umang@ITS Basic Data Analysis through R/R Studio Following steps will be performed to achieve our goal: ➢ Downloading/importing data in R ➢ Transforming Data / Running queries on data ➢ Basic data analysis using statistical averages ➢ Plotting data distribution
- 46. (c)Dr Umang@ITS 1. Importing Data in R Studio Example-1 sample census data set install.packages("readxl") https://readxl.tidyverse.org/
- 47. (c)Dr Umang@ITS 1. Importing Data in R Studio Example-2 National Morbidity and Mortality Air Pollution Study (NMMAPS) install.packages("readxl") https://readxl.tidyverse.org/
- 48. (c)Dr Umang@ITS 2. Transforming Data (1) To access a particular column, Ex. age_husband in our case. acs_or$age_husband
- 49. (c)Dr Umang@ITS 2. Transforming Data (2) To access data as a vector acs_or[1,3]
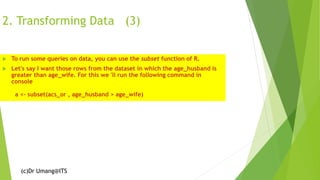
- 50. (c)Dr Umang@ITS 2. Transforming Data (3) To run some queries on data, you can use the subset function of R. Let's say I want those rows from the dataset in which the age_husband is greater than age_wife. For this we 'll run the following command in console a <- subset(acs_or , age_husband > age_wife)
- 51. (c)Dr Umang@ITS 2. Transforming Data (3)
- 52. (c)Dr Umang@ITS Structure of data set str(acs_or)
- 53. (c)Dr Umang@ITS
- 54. (c)Dr Umang@ITS Getting Statistical Averages from data (1) Following functions can be used to calculate the averages of the dataset For mean of any column, run : mean(acs$age_husband) Median, run : median(acs$age_husband) Quantile , run : quantile(acs$age_wife) Variance , run : var(acs$age_wife) Standard Deviation , run : sd(acs$age_wife)
- 55. (c)Dr Umang@ITS Getting Statistical Averages from data
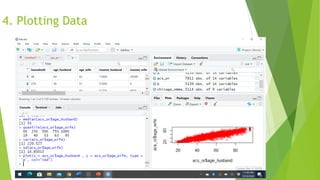
- 56. (c)Dr Umang@ITS 4. Plotting Data
- 57. (c)Dr Umang@ITS
- 58. (c)Dr Umang@ITS
- 59. (c)Dr Umang@ITS boxplot(acs_or$age_husband~acs_or$internet, col="blue") title(main="Husband Age Vs Internet Availability", xlab = "Internet Availability", ylab = "Age of Husband")
- 60. (c)Dr Umang@ITS
- 61. (c)Dr Umang@ITS
- 62. (c)Dr Umang@ITS Linear Regression from beginners https://www.youtube.com/watch?v=xlJyKDzru1o Regression is a statistical tool used to find a relationship between two variables. One Variable is the predictor variable and other is response variable. In linear regression, these variables are related through a general equation, i.e. y=ax+b To find the linear regression we use a function lm() Syntax lm(formula, Data) Formula is the relationship between x and y Data is the set on which formula will be applied
- 63. (c)Dr Umang@ITS
- 64. (c)Dr Umang@ITS
- 65. (c)Dr Umang@ITS
- 66. (c)Dr Umang@ITS Dplyr The dplyr is a powerful R-package to manipulate, clean and summarize unstructured data. In short, it makes data exploration and data manipulation easy and fast in R. Used for applying filter, selecting specific columns, sorting data, adding or deleting columns and aggregating data. dplyr Function Description Equivalent SQL select() Selecting columns (variables) SELECT filter() Filter (subset) rows. WHERE group_by() Group the data GROUP BY summarise() Summarise (or aggregate) data - arrange() Sort the data ORDER BY join() Joining data frames (tables) JOIN mutate() Creating New Variables COLUMN ALIAS Important dplyr Functions to remember
- 67. (c)Dr Umang@ITS Clustering There to analyze the data, find hidden pattern and generate useful patterns. This information could be utilize in business growth. Clustering Assign data into groups Applications
- 68. (c)Dr Umang@ITS Clustering and Classification Clustering is unsupervised form of machine learning Classification is supervised form of machine learning -> goal of the study is established before hand
- 69. (c)Dr Umang@ITS Data Classification, Clustering or Linear Regression from following links: k-NN Classification for beginners Using Airquality Dataset k-means Clustering for beginners Using Iris Dataset Using Airquality Dataset Linear Regression for beginners Using Iris Dataset Using Airquality Dataset
- 70. (c)Dr Umang@ITS Projects Personality Project - Using R for psychological researchIntroduction to using R for psychological research, including introductory and advanced topics (SEM, cluster analysis, item response theory, etc.) Introducing R (UCLA Statistical Consulting Group)Interactive slideshow on how to get started with R and R packages. Introduction to R - Ludwig-Maximilians-Universität MünchenCourse notes and exercises (in English) with sample datasets from Dr. Martin Hutzenthaler and Prof. Dirk Metzler's Introduction to R course. R for Data Science stat545.com: Data wrangling, exploration, and analysis with R