Data Structures for Statistical Computing in Python
26 likes90,459 views

The document discusses statistical data structures in Python. It summarizes that structured arrays are commonly used to store statistical data sets but have limitations. The R data frame is introduced as a flexible alternative that inspired the pandas library in Python. Pandas aims to create intuitive data structures for statistical analysis with labeled axes and automatic data alignment. Its core data structure, the DataFrame, functions similarly to R's data frame.


![Statistical data sets
Statistical data sets commonly arrive in tabular format, i.e. as a
two-dimensional list of observations and names for the fields of each
observation.
array([(’GOOG’, ’2009-12-28’, 622.87, 1697900.0),
(’GOOG’, ’2009-12-29’, 619.40, 1424800.0),
(’GOOG’, ’2009-12-30’, 622.73, 1465600.0),
(’GOOG’, ’2009-12-31’, 619.98, 1219800.0),
(’AAPL’, ’2009-12-28’, 211.61, 23003100.0),
(’AAPL’, ’2009-12-29’, 209.10, 15868400.0),
(’AAPL’, ’2009-12-30’, 211.64, 14696800.0),
(’AAPL’, ’2009-12-31’, 210.73, 12571000.0)],
dtype=[(’item’, ’|S4’), (’date’, ’|S10’),
(’price’, ’<f8’), (’volume’, ’<f8’)])
McKinney () Statistical Data Structures in Python SciPy 2010 6 / 31](https://image.slidesharecdn.com/scipypandas-110721133003-phpapp02/85/Data-Structures-for-Statistical-Computing-in-Python-6-320.jpg)


![pandas DataFrame
Basically a pythonic data.frame, but with automatic data alignment!
Arithmetic operations align on row and column labels.
>>> data = DataFrame.fromcsv(’data’, index_col=None)
date item price volume
0 2009-12-28 GOOG 622.9 1.698e+06
1 2009-12-29 GOOG 619.4 1.425e+06
2 2009-12-30 GOOG 622.7 1.466e+06
3 2009-12-31 GOOG 620 1.22e+06
4 2009-12-28 AAPL 211.6 2.3e+07
5 2009-12-29 AAPL 209.1 1.587e+07
6 2009-12-30 AAPL 211.6 1.47e+07
7 2009-12-31 AAPL 210.7 1.257e+07
>>> df[’ind’] = df[’item’] == ’GOOG’
McKinney () Statistical Data Structures in Python SciPy 2010 11 / 31](https://image.slidesharecdn.com/scipypandas-110721133003-phpapp02/85/Data-Structures-for-Statistical-Computing-in-Python-16-320.jpg)
![How to organize the data?
Especially for larger data sets, we’d rather not pay O(# obs) to select a
subset of the data. O(1)-ish would be preferable
>>> data[data[’item’] == ’GOOG’]
array([(’GOOG’, ’2009-12-28’, 622.87, 1697900.0),
(’GOOG’, ’2009-12-29’, 619.40, 1424800.0),
(’GOOG’, ’2009-12-30’, 622.73, 1465600.0),
(’GOOG’, ’2009-12-31’, 619.98, 1219800.0)],
dtype=[(’item’, ’|S4’), (’date’, ’|S10’),
(’price’, ’<f8’), (’volume’, ’<f8’)])
McKinney () Statistical Data Structures in Python SciPy 2010 12 / 31](https://image.slidesharecdn.com/scipypandas-110721133003-phpapp02/85/Data-Structures-for-Statistical-Computing-in-Python-17-320.jpg)

![How to organize the data?
In this format, grabbing labeled, lower-dimensional slices is easy:
>>> df[’AAPL’]
2009-12-28 211.61
2009-12-29 209.1
2009-12-30 211.64
2009-12-31 210.73
>>> df.xs(’2009-12-28’)
AAPL 211.61
GOOG 622.87
McKinney () Statistical Data Structures in Python SciPy 2010 14 / 31](https://image.slidesharecdn.com/scipypandas-110721133003-phpapp02/85/Data-Structures-for-Statistical-Computing-in-Python-19-320.jpg)


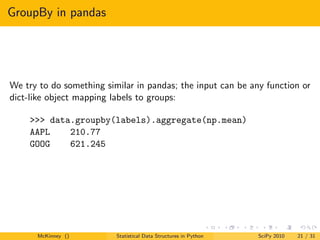
![GroupBy in R
R users are spoiled by having vector recognized as something you might
want to “group by”:
> labels
[1] GOOG GOOG GOOG GOOG AAPL AAPL AAPL AAPL
Levels: AAPL GOOG
> data
[1] 622.87 619.40 622.73 619.98 211.61 209.10
211.64 210.73
> tapply(data, labels, mean)
AAPL GOOG
210.770 621.245
McKinney () Statistical Data Structures in Python SciPy 2010 20 / 31](https://image.slidesharecdn.com/scipypandas-110721133003-phpapp02/85/Data-Structures-for-Statistical-Computing-in-Python-25-320.jpg)


![Manipulating panel (3D) data
What you saw was the “stacked” or tabular format, but the 3D form can
be more useful at times:
>>> wp[’capital’].head()
1935 1936 1937 1938 1939
1 2.8 265 53.8 213.8 97.8
2 52.6 402.2 50.5 132.6 104.4
3 156.9 761.5 118.1 264.8 118
4 209.2 922.4 260.2 306.9 156.2
5 203.4 1020 312.7 351.1 172.6
6 207.2 1099 254.2 357.8 186.6
7 255.2 1208 261.4 342.1 220.9
8 303.7 1430 298.7 444.2 287.8
9 264.1 1777 301.8 623.6 319.9
10 201.6 2226 279.1 669.7 321.3
McKinney () Statistical Data Structures in Python SciPy 2010 28 / 31](https://image.slidesharecdn.com/scipypandas-110721133003-phpapp02/85/Data-Structures-for-Statistical-Computing-in-Python-33-320.jpg)


Data Structures for Statistical Computing in Python
- 1. Data structures for statistical computing in Python Wes McKinney SciPy 2010 McKinney () Statistical Data Structures in Python SciPy 2010 1 / 31
- 2. Environments for statistics and data analysis The usual suspects: R / S+, MATLAB, Stata, SAS, etc. Python being used increasingly in statistical or related applications scikits.statsmodels: linear models and other econometric estimators PyMC: Bayesian MCMC estimation scikits.learn: machine learning algorithms Many interfaces to mostly non-Python libraries (pycluster, SHOGUN, Orange, etc.) And others (look at the SciPy conference schedule!) How can we attract more statistical users to Python? McKinney () Statistical Data Structures in Python SciPy 2010 2 / 31
- 3. What matters to statistical users? Standard suite of linear algebra, matrix operations (NumPy, SciPy) Availability of statistical models and functions More than there used to be, but nothing compared to R / CRAN rpy2 is coming along, but it doesn’t seem to be an “end-user” project Data visualization and graphics tools (matplotlib, ...) Interactive research environment (IPython) McKinney () Statistical Data Structures in Python SciPy 2010 3 / 31
- 4. What matters to statistical users? (cont’d) Easy installation and sources of community support Well-written and navigable documentation Robust input / output tools Flexible data structures and data manipulation tools McKinney () Statistical Data Structures in Python SciPy 2010 4 / 31
- 5. What matters to statistical users? (cont’d) Easy installation and sources of community support Well-written and navigable documentation Robust input / output tools Flexible data structures and data manipulation tools McKinney () Statistical Data Structures in Python SciPy 2010 5 / 31
- 6. Statistical data sets Statistical data sets commonly arrive in tabular format, i.e. as a two-dimensional list of observations and names for the fields of each observation. array([(’GOOG’, ’2009-12-28’, 622.87, 1697900.0), (’GOOG’, ’2009-12-29’, 619.40, 1424800.0), (’GOOG’, ’2009-12-30’, 622.73, 1465600.0), (’GOOG’, ’2009-12-31’, 619.98, 1219800.0), (’AAPL’, ’2009-12-28’, 211.61, 23003100.0), (’AAPL’, ’2009-12-29’, 209.10, 15868400.0), (’AAPL’, ’2009-12-30’, 211.64, 14696800.0), (’AAPL’, ’2009-12-31’, 210.73, 12571000.0)], dtype=[(’item’, ’|S4’), (’date’, ’|S10’), (’price’, ’<f8’), (’volume’, ’<f8’)]) McKinney () Statistical Data Structures in Python SciPy 2010 6 / 31
- 7. Structured arrays Structured arrays are great for many applications, but not always great for general data analysis Pros Fast, memory-efficient, good for loading and saving big data Nested dtypes help manage hierarchical data McKinney () Statistical Data Structures in Python SciPy 2010 7 / 31
- 8. Structured arrays Structured arrays are great for many applications, but not always great for general data analysis Pros Fast, memory-efficient, good for loading and saving big data Nested dtypes help manage hierarchical data Cons Can’t be immediately used in many (most?) NumPy methods Are not flexible in size (have to use or write auxiliary methods to “add” fields) Not too many built-in data manipulation methods Selecting subsets is often O(n)! McKinney () Statistical Data Structures in Python SciPy 2010 7 / 31
- 9. Structured arrays Structured arrays are great for many applications, but not always great for general data analysis Pros Fast, memory-efficient, good for loading and saving big data Nested dtypes help manage hierarchical data Cons Can’t be immediately used in many (most?) NumPy methods Are not flexible in size (have to use or write auxiliary methods to “add” fields) Not too many built-in data manipulation methods Selecting subsets is often O(n)! What can be learned from other statistical languages? McKinney () Statistical Data Structures in Python SciPy 2010 7 / 31
- 10. R’s data.frame One of the core data structures of the R language. In many ways similar to a structured array. > df <- read.csv(’data’) item date price volume 1 GOOG 2009-12-28 622.87 1697900 2 GOOG 2009-12-29 619.40 1424800 3 GOOG 2009-12-30 622.73 1465600 4 GOOG 2009-12-31 619.98 1219800 5 AAPL 2009-12-28 211.61 23003100 6 AAPL 2009-12-29 209.10 15868400 7 AAPL 2009-12-30 211.64 14696800 8 AAPL 2009-12-31 210.73 12571000 McKinney () Statistical Data Structures in Python SciPy 2010 8 / 31
- 11. R’s data.frame Perhaps more like a mutable dictionary of vectors. Much of R’s statistical estimators and 3rd-party libraries are designed to be used with data.frame objects. > df$isgoog <- df$item == "GOOG" > df item date price volume isgoog 1 GOOG 2009-12-28 622.87 1697900 TRUE 2 GOOG 2009-12-29 619.40 1424800 TRUE 3 GOOG 2009-12-30 622.73 1465600 TRUE 4 GOOG 2009-12-31 619.98 1219800 TRUE 5 AAPL 2009-12-28 211.61 23003100 FALSE 6 AAPL 2009-12-29 209.10 15868400 FALSE 7 AAPL 2009-12-30 211.64 14696800 FALSE 8 AAPL 2009-12-31 210.73 12571000 FALSE McKinney () Statistical Data Structures in Python SciPy 2010 9 / 31
- 12. pandas library Began building at AQR in 2008, open-sourced late 2009 Many goals Data structures to make working with statistical or “labeled” data sets easy and intuitive for non-experts Create a both user- and developer-friendly backbone for implementing statistical models Provide an integrated set of tools for common analyses Implement statistical models! McKinney () Statistical Data Structures in Python SciPy 2010 10 / 31
- 13. pandas library Began building at AQR in 2008, open-sourced late 2009 Many goals Data structures to make working with statistical or “labeled” data sets easy and intuitive for non-experts Create a both user- and developer-friendly backbone for implementing statistical models Provide an integrated set of tools for common analyses Implement statistical models! Takes some inspiration from R but aims also to improve in many areas (like data alignment) McKinney () Statistical Data Structures in Python SciPy 2010 10 / 31
- 14. pandas library Began building at AQR in 2008, open-sourced late 2009 Many goals Data structures to make working with statistical or “labeled” data sets easy and intuitive for non-experts Create a both user- and developer-friendly backbone for implementing statistical models Provide an integrated set of tools for common analyses Implement statistical models! Takes some inspiration from R but aims also to improve in many areas (like data alignment) Core idea: ndarrays with labeled axes and lots of methods McKinney () Statistical Data Structures in Python SciPy 2010 10 / 31
- 15. pandas library Began building at AQR in 2008, open-sourced late 2009 Many goals Data structures to make working with statistical or “labeled” data sets easy and intuitive for non-experts Create a both user- and developer-friendly backbone for implementing statistical models Provide an integrated set of tools for common analyses Implement statistical models! Takes some inspiration from R but aims also to improve in many areas (like data alignment) Core idea: ndarrays with labeled axes and lots of methods Etymology: panel data structures McKinney () Statistical Data Structures in Python SciPy 2010 10 / 31
- 16. pandas DataFrame Basically a pythonic data.frame, but with automatic data alignment! Arithmetic operations align on row and column labels. >>> data = DataFrame.fromcsv(’data’, index_col=None) date item price volume 0 2009-12-28 GOOG 622.9 1.698e+06 1 2009-12-29 GOOG 619.4 1.425e+06 2 2009-12-30 GOOG 622.7 1.466e+06 3 2009-12-31 GOOG 620 1.22e+06 4 2009-12-28 AAPL 211.6 2.3e+07 5 2009-12-29 AAPL 209.1 1.587e+07 6 2009-12-30 AAPL 211.6 1.47e+07 7 2009-12-31 AAPL 210.7 1.257e+07 >>> df[’ind’] = df[’item’] == ’GOOG’ McKinney () Statistical Data Structures in Python SciPy 2010 11 / 31
- 17. How to organize the data? Especially for larger data sets, we’d rather not pay O(# obs) to select a subset of the data. O(1)-ish would be preferable >>> data[data[’item’] == ’GOOG’] array([(’GOOG’, ’2009-12-28’, 622.87, 1697900.0), (’GOOG’, ’2009-12-29’, 619.40, 1424800.0), (’GOOG’, ’2009-12-30’, 622.73, 1465600.0), (’GOOG’, ’2009-12-31’, 619.98, 1219800.0)], dtype=[(’item’, ’|S4’), (’date’, ’|S10’), (’price’, ’<f8’), (’volume’, ’<f8’)]) McKinney () Statistical Data Structures in Python SciPy 2010 12 / 31
- 18. How to organize the data? Really we have data on three dimensions: date, item, and data type. We can pay upfront cost to pivot the data and save time later: >>> df = data.pivot(’date’, ’item’, ’price’) >>> df AAPL GOOG 2009-12-28 211.6 622.9 2009-12-29 209.1 619.4 2009-12-30 211.6 622.7 2009-12-31 210.7 620 McKinney () Statistical Data Structures in Python SciPy 2010 13 / 31
- 19. How to organize the data? In this format, grabbing labeled, lower-dimensional slices is easy: >>> df[’AAPL’] 2009-12-28 211.61 2009-12-29 209.1 2009-12-30 211.64 2009-12-31 210.73 >>> df.xs(’2009-12-28’) AAPL 211.61 GOOG 622.87 McKinney () Statistical Data Structures in Python SciPy 2010 14 / 31
- 20. Data alignment Data sets originating from different files or different database tables may not always be homogenous: >>> s1 >>> s2 AAPL 0.044 AAPL 0.025 IBM 0.050 BAR 0.158 SAP 0.101 C 0.028 GOOG 0.113 DB 0.087 C 0.138 F 0.004 SCGLY 0.037 GOOG 0.154 BAR 0.200 IBM 0.034 DB 0.281 VW 0.040 McKinney () Statistical Data Structures in Python SciPy 2010 15 / 31
- 21. Data alignment Arithmetic operations, etc., match on axis labels. Done in Cython so significantly faster than pure Python. >>> s1 + s2 AAPL 0.0686791008184 BAR 0.358165479807 C 0.16586702944 DB 0.367679872693 F NaN GOOG 0.26666583847 IBM 0.0833057542385 SAP NaN SCGLY NaN VW NaN McKinney () Statistical Data Structures in Python SciPy 2010 16 / 31
- 22. Missing data handling Since data points may be deemed “missing” or “masked”, having tools for these makes sense. >>> (s1 + s2).fill(0) AAPL 0.0686791008184 BAR 0.358165479807 C 0.16586702944 DB 0.367679872693 F 0.0 GOOG 0.26666583847 IBM 0.0833057542385 SAP 0.0 SCGLY 0.0 VW 0.0 McKinney () Statistical Data Structures in Python SciPy 2010 17 / 31
- 23. Missing data handling >>> (s1 + s2).valid() AAPL 0.0686791008184 BAR 0.358165479807 C 0.16586702944 DB 0.367679872693 GOOG 0.26666583847 IBM 0.0833057542385 >>> (s1 + s2).sum() 1.3103630754662747 >>> (s1 + s2).count() 6 McKinney () Statistical Data Structures in Python SciPy 2010 18 / 31
- 24. Categorical data and “Group by” Often want to compute descriptive stats on data given group designations: >>> s >>> cats industry AAPL 0.044 AAPL TECH IBM 0.050 IBM TECH SAP 0.101 SAP TECH GOOG 0.113 GOOG TECH C 0.138 C FIN SCGLY 0.037 SCGLY FIN BAR 0.200 BAR FIN DB 0.281 DB FIN VW 0.040 VW AUTO RNO AUTO F AUTO TM AUTO McKinney () Statistical Data Structures in Python SciPy 2010 19 / 31
- 25. GroupBy in R R users are spoiled by having vector recognized as something you might want to “group by”: > labels [1] GOOG GOOG GOOG GOOG AAPL AAPL AAPL AAPL Levels: AAPL GOOG > data [1] 622.87 619.40 622.73 619.98 211.61 209.10 211.64 210.73 > tapply(data, labels, mean) AAPL GOOG 210.770 621.245 McKinney () Statistical Data Structures in Python SciPy 2010 20 / 31
- 26. GroupBy in pandas We try to do something similar in pandas; the input can be any function or dict-like object mapping labels to groups: >>> data.groupby(labels).aggregate(np.mean) AAPL 210.77 GOOG 621.245 McKinney () Statistical Data Structures in Python SciPy 2010 21 / 31
- 27. GroupBy in pandas More fancy things are possible, like “transforming” groups by arbitrary functions: demean = lambda x: x - x.mean() def group_demean(obj, keyfunc): grouped = obj.groupby(keyfunc) return grouped.transform(demean) >>> group_demean(s, ind) AAPL -0.0328370881632 BAR 0.0358663891836 C -0.0261271326111 DB 0.11719543981 GOOG 0.035936259143 IBM -0.0272802815728 SAP 0.024181110593 McKinney () Statistical Data Structures in Python SciPy 2010 22 / 31
- 28. Merging data sets One commonly encounters a group of data sets which are not quite identically-indexed: >>> df1 >>> df2 AAPL GOOG MSFT YHOO 2009-12-24 209 618.5 2009-12-24 31 16.72 2009-12-28 211.6 622.9 2009-12-28 31.17 16.88 2009-12-29 209.1 619.4 2009-12-29 31.39 16.92 2009-12-30 211.6 622.7 2009-12-30 30.96 16.98 2009-12-31 210.7 620 McKinney () Statistical Data Structures in Python SciPy 2010 23 / 31
- 29. Merging data sets By default gluing these together on the row labels seems reasonable: >>> df1.join(df2) AAPL GOOG MSFT YHOO 2009-12-24 209 618.5 31 16.72 2009-12-28 211.6 622.9 31.17 16.88 2009-12-29 209.1 619.4 31.39 16.92 2009-12-30 211.6 622.7 30.96 16.98 2009-12-31 210.7 620 NaN NaN McKinney () Statistical Data Structures in Python SciPy 2010 24 / 31
- 30. Merging data sets Returning to our first example, one might also wish to join on some other key: >>> df.join(cats, on=’item’) date industry item value 0 2009-12-28 TECH GOOG 622.9 1 2009-12-29 TECH GOOG 619.4 2 2009-12-30 TECH GOOG 622.7 3 2009-12-31 TECH GOOG 620 4 2009-12-28 TECH AAPL 211.6 5 2009-12-29 TECH AAPL 209.1 6 2009-12-30 TECH AAPL 211.6 7 2009-12-31 TECH AAPL 210.7 McKinney () Statistical Data Structures in Python SciPy 2010 25 / 31
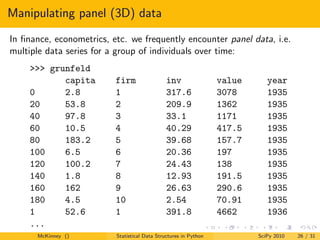
- 31. Manipulating panel (3D) data In finance, econometrics, etc. we frequently encounter panel data, i.e. multiple data series for a group of individuals over time: >>> grunfeld capita firm inv value year 0 2.8 1 317.6 3078 1935 20 53.8 2 209.9 1362 1935 40 97.8 3 33.1 1171 1935 60 10.5 4 40.29 417.5 1935 80 183.2 5 39.68 157.7 1935 100 6.5 6 20.36 197 1935 120 100.2 7 24.43 138 1935 140 1.8 8 12.93 191.5 1935 160 162 9 26.63 290.6 1935 180 4.5 10 2.54 70.91 1935 1 52.6 1 391.8 4662 1936 ... McKinney () Statistical Data Structures in Python SciPy 2010 26 / 31
- 32. Manipulating panel (3D) data What you saw was the “stacked” or tabular format, but the 3D form can be more useful at times: >>> lp = LongPanel.fromRecords(grunfeld, ’year’, ’firm’) >>> wp = lp.toWide() >>> wp <class ’pandas.core.panel.WidePanel’> Dimensions: 3 (items) x 20 (major) x 10 (minor) Items: capital to value Major axis: 1935 to 1954 Minor axis: 1 to 10 McKinney () Statistical Data Structures in Python SciPy 2010 27 / 31
- 33. Manipulating panel (3D) data What you saw was the “stacked” or tabular format, but the 3D form can be more useful at times: >>> wp[’capital’].head() 1935 1936 1937 1938 1939 1 2.8 265 53.8 213.8 97.8 2 52.6 402.2 50.5 132.6 104.4 3 156.9 761.5 118.1 264.8 118 4 209.2 922.4 260.2 306.9 156.2 5 203.4 1020 312.7 351.1 172.6 6 207.2 1099 254.2 357.8 186.6 7 255.2 1208 261.4 342.1 220.9 8 303.7 1430 298.7 444.2 287.8 9 264.1 1777 301.8 623.6 319.9 10 201.6 2226 279.1 669.7 321.3 McKinney () Statistical Data Structures in Python SciPy 2010 28 / 31
- 34. Manipulating panel (3D) data What you saw was the “stacked” or tabular format, but the 3D form can be more useful at times: # mean over time for each firm >>> wp.mean(axis=’major’) capital inv value 1 140.8 98.45 923.8 2 153.9 131.5 1142 3 205.4 134.8 1140 4 244.2 115.8 872.1 5 269.9 109.9 998.9 6 281.7 132.2 1056 7 301.7 169.7 1148 8 344.8 173.3 1068 9 389.2 196.7 1236 10 428.5 197.4 1233 McKinney () Statistical Data Structures in Python SciPy 2010 29 / 31
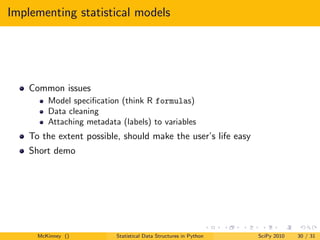
- 35. Implementing statistical models Common issues Model specification (think R formulas) Data cleaning Attaching metadata (labels) to variables To the extent possible, should make the user’s life easy Short demo McKinney () Statistical Data Structures in Python SciPy 2010 30 / 31
- 36. Conclusions Let’s attract more (statistical) users to Python by providing superior tools! Related projects: larry (la), tabular, datarray, others... Come to the BoF today at 6 pm pandas Website: http://pandas.sourceforge.net Contact: [email protected] McKinney () Statistical Data Structures in Python SciPy 2010 31 / 31