DATA VISUALIZATION USING MATPLOTLIB (PYTHON)
0 likes435 views
BARGRAPH, LINE CHART, HISTOGRAM, MULTIPLE BAR CHART, PIE CHART ETC. USING PYTHON LIBRARY-MATPLOTLIB... PPT ON DATA VISUALIZATION USING MATPLOTLIB
1 of 13
Downloaded 16 times


Ad
Recommended
Data Analysis and Visualization using Python
Data Analysis and Visualization using PythonChariza Pladin The document is a presentation about data analysis and visualization using Python libraries. It discusses how data is everywhere and growing exponentially, and introduces a 5-step process for data analysis and decision making. It emphasizes the importance of visualizing data to analyze patterns, discover insights, support stories, and teach others. The presentation then introduces Jupyter Notebook and highlights several Python libraries for data visualization, including matplotlib, seaborn, ggplot, Bokeh, pygal, plotly, and geoplotlib.
Numpy tutorial
Numpy tutorialHarikaReddy115 NumPy is a library for working with multidimensional arrays and matrices in Python. It allows mathematical and logical operations on arrays to be performed. This tutorial explains the basics of NumPy, including its architecture, data types, array attributes, array creation, indexing and slicing, broadcasting, and array manipulation functions. The audience is those looking to learn the basics of NumPy, which is useful for algorithm developers. A basic understanding of Python is recommended.
Python Scipy Numpy
Python Scipy NumpyGirish Khanzode This document provides an overview of the Python programming language. It discusses Python's history and evolution, its key features like being object-oriented, open source, portable, having dynamic typing and built-in types/tools. It also covers Python's use for numeric processing with libraries like NumPy and SciPy. The document explains how to use Python interactively from the command line and as scripts. It describes Python's basic data types like integers, floats, strings, lists, tuples and dictionaries as well as common operations on these types.
Python Matplotlib Tutorial | Matplotlib Tutorial | Python Tutorial | Python T...
Python Matplotlib Tutorial | Matplotlib Tutorial | Python Tutorial | Python T...Edureka! This Edureka Python Matplotlib tutorial (Python Tutorial Blog: https://goo.gl/wd28Zr) explains what is data visualization and how to perform data visualization using Matplotlib. It also explains how to modify your plot and how to plot various types of graphs. Below are the topics covered in this tutorial:
1. Why Data Visualization?
2. What Is Data Visualization?
3. Various Types Of Plots
4. What Is Matplotlib?
6. How To Use Matplotlib?
NUMPY 
NUMPY Global Academy of Technology NumPy is a Python library that provides multidimensional array and matrix objects to perform scientific computing. It contains efficient functions for operations on arrays like arithmetic, aggregation, copying, indexing, slicing, and reshaping. NumPy arrays have advantages over native Python sequences like fixed size and efficient mathematical operations. Common NumPy operations include elementwise arithmetic, aggregation functions, copying and transposing arrays, changing array shapes, and indexing/slicing arrays.
Python libraries
Python librariesProf. Dr. K. Adisesha This document discusses Python libraries and modules. It defines a library as a collection of modules that provide specific functionality. The standard library contains commonly used modules like math and random. Other important libraries mentioned are NumPy, SciPy, and tkinter. A module is a .py file that contains related variables, classes, functions etc. Modules can be imported using import, from, or from * statements. Namespaces and module aliasing are also covered. The document concludes by explaining how to create Python packages and the role of the __init__.py file in making a directory a package.
Data visualization in Python
Data visualization in PythonMarc Garcia This document discusses data visualization tools in Python. It introduces Matplotlib as the first and still standard Python visualization tool. It also covers Seaborn which builds on Matplotlib, Bokeh for interactive visualizations, HoloViews as a higher-level wrapper for Bokeh, and Datashader for big data visualization. Additional tools discussed include Folium for maps, and yt for volumetric data visualization. The document concludes that Python is well-suited for data science and visualization with many options available.
Python Seaborn Data Visualization 
Python Seaborn Data Visualization Sourabh Sahu This document discusses using the Seaborn library in Python for data visualization. It covers installing Seaborn, importing libraries, reading in data, cleaning data, and creating various plots including distribution plots, heatmaps, pair plots, and more. Code examples are provided to demonstrate Seaborn's functionality for visualizing and exploring data.
Machine learning with scikitlearn
Machine learning with scikitlearnPratap Dangeti Machine learning algorithms can adapt and learn from experience. The three main machine learning methods are supervised learning (using labeled training data), unsupervised learning (using unlabeled data), and semi-supervised learning (using some labeled and some unlabeled data). Supervised learning includes classification and regression tasks, while unsupervised learning includes cluster analysis.
Data Visualization(s) Using Python
Data Visualization(s) Using PythonAniket Maithani This document provides an introduction to data visualization using Python libraries like Pandas, Seaborn, NumPy, and SciPy. It begins with an about section for the author and then discusses data and visualization. Several Python libraries for visualization are introduced, including Pandas, Matplotlib, Seaborn, and examples are shown for each. The document concludes by asking for any other questions.
MatplotLib.pptx
MatplotLib.pptxParas Intotech Looking for a computer institute to learn Full Stack development and Digital Marketing? Our institute offers comprehensive courses in both areas, providing students with the skills and knowledge needed to succeed in today's digital landscape
Data Analysis in Python-NumPy
Data Analysis in Python-NumPyDevashish Kumar First in the series of Data Analysis in Python. Upcoming series will cover the concepts of Scipy, Pandas, Metplotlib, StatsModels
pandas - Python Data Analysis
pandas - Python Data AnalysisAndrew Henshaw This document provides an overview of Python for data analysis using the pandas library. It discusses key pandas concepts like Series and DataFrames for working with one-dimensional and multi-dimensional labeled data structures. It also covers common data analysis tasks in pandas such as data loading, aggregation, grouping, pivoting, filtering, handling time series data, and plotting.
Data Analysis in Python
Data Analysis in PythonRichard Herrell This document provides an overview of tools and techniques for data analysis in Python. It discusses popular Python libraries for data analysis like NumPy, pandas, and matplotlib. It also provides examples of importing datasets, working with Series and DataFrames, merging datasets, and using GroupBy to aggregate data. The document is intended as a tutorial for getting started with data analysis and visualization using Python.
Introduction to matplotlib
Introduction to matplotlibPiyush rai This slide is used to do an introduction for the matplotlib library and this will be a very basic introduction. As matplotlib is a very used and famous library for machine learning this will be very helpful to teach a student with no coding background and they can start the plotting of maps from the ending of the slide by there own.
Python - Numpy/Pandas/Matplot Machine Learning Libraries
Python - Numpy/Pandas/Matplot Machine Learning LibrariesAndrew Ferlitsch Abstract: This PDSG workshop introduces the basics of Python libraries used in machine learning. Libraries covered are Numpy, Pandas and MathlibPlot.
Level: Fundamental
Requirements: One should have some knowledge of programming and some statistics.
Scikit-Learn Tutorial | Machine Learning With Scikit-Learn | Sklearn | Python...
Scikit-Learn Tutorial | Machine Learning With Scikit-Learn | Sklearn | Python...Simplilearn This presentation about Scikit-learn will help you understand what is Scikit-learn, what can we achieve using Scikit-learn and a demo on how to use Scikit-learn in Python. Scikit is a powerful and modern machine learning python library. It's a great tool for fully and semi-automated advanced data analysis and information extraction. There are a lot of reasons why Scikit-Learn is a preferred machine learning tool. It has efficient tools to identify and organize problems, such as whether it fits a supervised or unsupervised learning model. It contains many free and open data sets. It has a rich set of built-in libraries for learning and predicting. It provides model support for every problem type. It also has built-in functions such as pickle for model persistence. It is supported by a huge open source community and vendor base. Now, let us get started and understand Sciki-Learn in detail.
Below topics are explained in this Scikit-Learn presentation:
1. What is Scikit-learn?
2. What we can achieve using Scikit-learn
3. Demo
Simplilearn’s Python Training Course is an all-inclusive program that will introduce you to the Python development language and expose you to the essentials of object-oriented programming, web development with Django and game development. Python has surpassed Java as the top language used to introduce U.S. students to programming and computer science. This course will give you hands-on development experience and prepare you for a career as a professional Python programmer.
What is this course about?
The All-in-One Python course enables you to become a professional Python programmer. Any aspiring programmer can learn Python from the basics and go on to master web development & game development in Python. Gain hands-on experience creating a flappy bird game clone & website functionalities in Python.
What are the course objectives?
By the end of this online Python training course, you will be able to:
1. Internalize the concepts & constructs of Python
2. Learn to create your own Python programs
3. Master Python Django & advanced web development in Python
4. Master PyGame & game development in Python
5. Create a flappy bird game clone
The Python training course is recommended for:
1. Any aspiring programmer can take up this bundle to master Python
2. Any aspiring web developer or game developer can take up this bundle to meet their training needs
Learn more at https://www.simplilearn.com/mobile-and-software-development/python-development-training
The matplotlib Library
The matplotlib LibraryHaim Michael The slides I was using when delivering a meetup about the matplotlib library. More info about that meetup can be found at https://www.meetup.com/life-michael/events/271738271/
Introduction to NumPy (PyData SV 2013)
Introduction to NumPy (PyData SV 2013)PyData NumPy is a Python library used for working with multidimensional arrays and matrices for scientific computing. It allows fast operations on arrays through optimized C code and is the foundation of the Python scientific computing stack. NumPy arrays can be created in many ways and support operations like indexing, slicing, broadcasting, and universal functions. NumPy provides many useful features for linear algebra, Fourier transforms, random number generation and more.
Basic of python for data analysis
Basic of python for data analysisPramod Toraskar Python is the choice llanguage for data analysis,
The aim of this slide is to provide a comprehensive learning path to people new to python for data analysis. This path provides a comprehensive overview of the steps you need to learn to use Python for data analysis.
getting started with numpy and pandas.pptx
getting started with numpy and pandas.pptxworkvishalkumarmahat This document provides an overview of NumPy and Pandas libraries in Python. It discusses what NumPy is, its applications, basic concepts like arrays and slicing. It covers initializing and reorganizing NumPy arrays and loading data from files. For Pandas, it defines what a dataframe is, how to load and extract data from a dataframe, fetch specific records, handle null values, concatenate dataframes, and save dataframes to different file formats.
Introduction to Machine learning with Python
Introduction to Machine learning with PythonChariza Pladin This document discusses machine learning with Python. It begins with an introduction to artificial intelligence and machine learning, highlighting key events. It then discusses why machine learning is useful, including developing adaptive systems, data mining, and replacing monotonous tasks. The document introduces Python as a language for machine learning and describes supervised and unsupervised learning algorithms. It provides examples of using supervised learning for classification and unsupervised learning for clustering. The document concludes with a question and answer section.
Python algorithm
Python algorithmProf. Dr. K. Adisesha This document discusses algorithmic efficiency and complexity. It begins by defining an algorithm as a step-by-step procedure for solving a problem in a finite amount of time. It then discusses estimating the complexity of algorithms, including asymptotic notations like Big O, Big Omega, and Theta that are used to describe an algorithm's time and space complexity. The document provides examples of time and space complexity for common algorithms like searching and sorting. It concludes by emphasizing the importance of analyzing algorithms to minimize their cost and maximize efficiency.
pandas: Powerful data analysis tools for Python
pandas: Powerful data analysis tools for PythonWes McKinney Wes McKinney introduced pandas, a Python data analysis library built on NumPy. Pandas provides data structures and tools for cleaning, manipulating, and working with relational and time-series data. Key features include DataFrame for 2D data, hierarchical indexing, merging and joining data, and grouping and aggregating data. Pandas is used heavily in financial applications and has over 1500 unit tests, ensuring stability and reliability. Future goals include better time series handling and integration with other Python data science packages.
Data Structures in Python
Data Structures in PythonDevashish Kumar Data Structures in Python, second in the series of Introduction to Python. Upcoming series will cover Functions and OOPs concept in Python.
Building a performing Machine Learning model from A to Z
Building a performing Machine Learning model from A to ZCharles Vestur A 1-hour read to become highly knowledgeable about Machine learning and the machinery underneath, from scratch!
A presentation introducing to all fundamental concepts of Machine Learning step by step, following a classical approach to build a performing model. Simple examples and illustrations are used all along the presentation to make the concepts easier to grasp.
Introduction to numpy
Introduction to numpyGaurav Aggarwal This document provides an introduction and overview of NumPy, a Python library used for numerical computing. It discusses NumPy's origins and capabilities, how to install NumPy on Linux, key NumPy concepts like the ndarray object, and how NumPy can be used with Matplotlib for plotting. Examples are given of common NumPy operations and functions for arrays, as well as plotting simple graphs with Matplotlib.
Python for Data Science
Python for Data ScienceGabriel Moreira In this presentation its given an introduction about Data Science, Data Scientist role and features, and how Python ecosystem provides great tools for Data Science process (Obtain, Scrub, Explore, Model, Interpret).
For that, an attached IPython Notebook ( http://bit.ly/python4datascience_nb ) exemplifies the full process of a corporate network analysis, using Pandas, Matplotlib, Scikit-learn, Numpy and Scipy.
Data Visualization in Python of b.tech student.pptx
Data Visualization in Python of b.tech student.pptxTelanganaPakkaFolk data visualization in python best slides and ppt download and give best presentation
Python Introduction its a oop language and easy to use
Python Introduction its a oop language and easy to useSrajanCollege1 This document provides an introduction to Python and data visualization using Python. It discusses that Python is a high-level, interpreted, interactive and object-oriented scripting language used for software, website and app development. It then covers why Python is easy to learn and maintain, and has a broad standard library. The document lists different Python versions and popular Python IDEs. It also introduces basic Python programs, data types, operators, functions, conditional statements, loops, lists, tuples, dictionaries, and concludes with examples of data visualization using Matplotlib and collecting historical stock data for visualization.
More Related Content
What's hot (20)
Machine learning with scikitlearn
Machine learning with scikitlearnPratap Dangeti Machine learning algorithms can adapt and learn from experience. The three main machine learning methods are supervised learning (using labeled training data), unsupervised learning (using unlabeled data), and semi-supervised learning (using some labeled and some unlabeled data). Supervised learning includes classification and regression tasks, while unsupervised learning includes cluster analysis.
Data Visualization(s) Using Python
Data Visualization(s) Using PythonAniket Maithani This document provides an introduction to data visualization using Python libraries like Pandas, Seaborn, NumPy, and SciPy. It begins with an about section for the author and then discusses data and visualization. Several Python libraries for visualization are introduced, including Pandas, Matplotlib, Seaborn, and examples are shown for each. The document concludes by asking for any other questions.
MatplotLib.pptx
MatplotLib.pptxParas Intotech Looking for a computer institute to learn Full Stack development and Digital Marketing? Our institute offers comprehensive courses in both areas, providing students with the skills and knowledge needed to succeed in today's digital landscape
Data Analysis in Python-NumPy
Data Analysis in Python-NumPyDevashish Kumar First in the series of Data Analysis in Python. Upcoming series will cover the concepts of Scipy, Pandas, Metplotlib, StatsModels
pandas - Python Data Analysis
pandas - Python Data AnalysisAndrew Henshaw This document provides an overview of Python for data analysis using the pandas library. It discusses key pandas concepts like Series and DataFrames for working with one-dimensional and multi-dimensional labeled data structures. It also covers common data analysis tasks in pandas such as data loading, aggregation, grouping, pivoting, filtering, handling time series data, and plotting.
Data Analysis in Python
Data Analysis in PythonRichard Herrell This document provides an overview of tools and techniques for data analysis in Python. It discusses popular Python libraries for data analysis like NumPy, pandas, and matplotlib. It also provides examples of importing datasets, working with Series and DataFrames, merging datasets, and using GroupBy to aggregate data. The document is intended as a tutorial for getting started with data analysis and visualization using Python.
Introduction to matplotlib
Introduction to matplotlibPiyush rai This slide is used to do an introduction for the matplotlib library and this will be a very basic introduction. As matplotlib is a very used and famous library for machine learning this will be very helpful to teach a student with no coding background and they can start the plotting of maps from the ending of the slide by there own.
Python - Numpy/Pandas/Matplot Machine Learning Libraries
Python - Numpy/Pandas/Matplot Machine Learning LibrariesAndrew Ferlitsch Abstract: This PDSG workshop introduces the basics of Python libraries used in machine learning. Libraries covered are Numpy, Pandas and MathlibPlot.
Level: Fundamental
Requirements: One should have some knowledge of programming and some statistics.
Scikit-Learn Tutorial | Machine Learning With Scikit-Learn | Sklearn | Python...
Scikit-Learn Tutorial | Machine Learning With Scikit-Learn | Sklearn | Python...Simplilearn This presentation about Scikit-learn will help you understand what is Scikit-learn, what can we achieve using Scikit-learn and a demo on how to use Scikit-learn in Python. Scikit is a powerful and modern machine learning python library. It's a great tool for fully and semi-automated advanced data analysis and information extraction. There are a lot of reasons why Scikit-Learn is a preferred machine learning tool. It has efficient tools to identify and organize problems, such as whether it fits a supervised or unsupervised learning model. It contains many free and open data sets. It has a rich set of built-in libraries for learning and predicting. It provides model support for every problem type. It also has built-in functions such as pickle for model persistence. It is supported by a huge open source community and vendor base. Now, let us get started and understand Sciki-Learn in detail.
Below topics are explained in this Scikit-Learn presentation:
1. What is Scikit-learn?
2. What we can achieve using Scikit-learn
3. Demo
Simplilearn’s Python Training Course is an all-inclusive program that will introduce you to the Python development language and expose you to the essentials of object-oriented programming, web development with Django and game development. Python has surpassed Java as the top language used to introduce U.S. students to programming and computer science. This course will give you hands-on development experience and prepare you for a career as a professional Python programmer.
What is this course about?
The All-in-One Python course enables you to become a professional Python programmer. Any aspiring programmer can learn Python from the basics and go on to master web development & game development in Python. Gain hands-on experience creating a flappy bird game clone & website functionalities in Python.
What are the course objectives?
By the end of this online Python training course, you will be able to:
1. Internalize the concepts & constructs of Python
2. Learn to create your own Python programs
3. Master Python Django & advanced web development in Python
4. Master PyGame & game development in Python
5. Create a flappy bird game clone
The Python training course is recommended for:
1. Any aspiring programmer can take up this bundle to master Python
2. Any aspiring web developer or game developer can take up this bundle to meet their training needs
Learn more at https://www.simplilearn.com/mobile-and-software-development/python-development-training
The matplotlib Library
The matplotlib LibraryHaim Michael The slides I was using when delivering a meetup about the matplotlib library. More info about that meetup can be found at https://www.meetup.com/life-michael/events/271738271/
Introduction to NumPy (PyData SV 2013)
Introduction to NumPy (PyData SV 2013)PyData NumPy is a Python library used for working with multidimensional arrays and matrices for scientific computing. It allows fast operations on arrays through optimized C code and is the foundation of the Python scientific computing stack. NumPy arrays can be created in many ways and support operations like indexing, slicing, broadcasting, and universal functions. NumPy provides many useful features for linear algebra, Fourier transforms, random number generation and more.
Basic of python for data analysis
Basic of python for data analysisPramod Toraskar Python is the choice llanguage for data analysis,
The aim of this slide is to provide a comprehensive learning path to people new to python for data analysis. This path provides a comprehensive overview of the steps you need to learn to use Python for data analysis.
getting started with numpy and pandas.pptx
getting started with numpy and pandas.pptxworkvishalkumarmahat This document provides an overview of NumPy and Pandas libraries in Python. It discusses what NumPy is, its applications, basic concepts like arrays and slicing. It covers initializing and reorganizing NumPy arrays and loading data from files. For Pandas, it defines what a dataframe is, how to load and extract data from a dataframe, fetch specific records, handle null values, concatenate dataframes, and save dataframes to different file formats.
Introduction to Machine learning with Python
Introduction to Machine learning with PythonChariza Pladin This document discusses machine learning with Python. It begins with an introduction to artificial intelligence and machine learning, highlighting key events. It then discusses why machine learning is useful, including developing adaptive systems, data mining, and replacing monotonous tasks. The document introduces Python as a language for machine learning and describes supervised and unsupervised learning algorithms. It provides examples of using supervised learning for classification and unsupervised learning for clustering. The document concludes with a question and answer section.
Python algorithm
Python algorithmProf. Dr. K. Adisesha This document discusses algorithmic efficiency and complexity. It begins by defining an algorithm as a step-by-step procedure for solving a problem in a finite amount of time. It then discusses estimating the complexity of algorithms, including asymptotic notations like Big O, Big Omega, and Theta that are used to describe an algorithm's time and space complexity. The document provides examples of time and space complexity for common algorithms like searching and sorting. It concludes by emphasizing the importance of analyzing algorithms to minimize their cost and maximize efficiency.
pandas: Powerful data analysis tools for Python
pandas: Powerful data analysis tools for PythonWes McKinney Wes McKinney introduced pandas, a Python data analysis library built on NumPy. Pandas provides data structures and tools for cleaning, manipulating, and working with relational and time-series data. Key features include DataFrame for 2D data, hierarchical indexing, merging and joining data, and grouping and aggregating data. Pandas is used heavily in financial applications and has over 1500 unit tests, ensuring stability and reliability. Future goals include better time series handling and integration with other Python data science packages.
Data Structures in Python
Data Structures in PythonDevashish Kumar Data Structures in Python, second in the series of Introduction to Python. Upcoming series will cover Functions and OOPs concept in Python.
Building a performing Machine Learning model from A to Z
Building a performing Machine Learning model from A to ZCharles Vestur A 1-hour read to become highly knowledgeable about Machine learning and the machinery underneath, from scratch!
A presentation introducing to all fundamental concepts of Machine Learning step by step, following a classical approach to build a performing model. Simple examples and illustrations are used all along the presentation to make the concepts easier to grasp.
Introduction to numpy
Introduction to numpyGaurav Aggarwal This document provides an introduction and overview of NumPy, a Python library used for numerical computing. It discusses NumPy's origins and capabilities, how to install NumPy on Linux, key NumPy concepts like the ndarray object, and how NumPy can be used with Matplotlib for plotting. Examples are given of common NumPy operations and functions for arrays, as well as plotting simple graphs with Matplotlib.
Python for Data Science
Python for Data ScienceGabriel Moreira In this presentation its given an introduction about Data Science, Data Scientist role and features, and how Python ecosystem provides great tools for Data Science process (Obtain, Scrub, Explore, Model, Interpret).
For that, an attached IPython Notebook ( http://bit.ly/python4datascience_nb ) exemplifies the full process of a corporate network analysis, using Pandas, Matplotlib, Scikit-learn, Numpy and Scipy.
Similar to DATA VISUALIZATION USING MATPLOTLIB (PYTHON) (20)
Data Visualization in Python of b.tech student.pptx
Data Visualization in Python of b.tech student.pptxTelanganaPakkaFolk data visualization in python best slides and ppt download and give best presentation
Python Introduction its a oop language and easy to use
Python Introduction its a oop language and easy to useSrajanCollege1 This document provides an introduction to Python and data visualization using Python. It discusses that Python is a high-level, interpreted, interactive and object-oriented scripting language used for software, website and app development. It then covers why Python is easy to learn and maintain, and has a broad standard library. The document lists different Python versions and popular Python IDEs. It also introduces basic Python programs, data types, operators, functions, conditional statements, loops, lists, tuples, dictionaries, and concludes with examples of data visualization using Matplotlib and collecting historical stock data for visualization.
-python-for-data-science-20240911071905Ss8z.pdf
-python-for-data-science-20240911071905Ss8z.pdfabhishekprasadabhima data science in python programming
PYTHON-Chapter 4-Plotting and Data Science PyLab - MAULIK BORSANIYA
PYTHON-Chapter 4-Plotting and Data Science PyLab - MAULIK BORSANIYAMaulik Borsaniya This document discusses data visualization and Matplotlib. It begins with an introduction to data visualization and its importance. It then covers basic visualization rules like labeling axes and adding titles. It discusses what Matplotlib is and how to install it. It provides examples of common plot types in Matplotlib like sine waves, scatter plots, bar charts, and pie charts. It also discusses working with data science and Pandas, including how to create Pandas Series and DataFrames from various data sources.
Python-Libraries,Numpy,Pandas,Matplotlib.pptx
Python-Libraries,Numpy,Pandas,Matplotlib.pptxanushya2915 This document discusses Python libraries, including popular libraries for data analysis, web development, and machine learning. It provides examples of how to use the Matplotlib and NumPy libraries, describing their features and sample code. The key steps to install and import Python libraries using pip and import statements are also outlined. Overall, the document introduces several essential Python libraries and their applications.

Python for Data Science: A Comprehensive Guide
Python for Data Science: A Comprehensive Guidepriyanka rajput Python’s popularity in data science is undeniable, to sum up. It is the best option for data analysts and scientists because of its simplicity, extensive library environment, and community support. The essential Python tools and best practices have been highlighted in this thorough book, enabling data aficionados to succeed in this fast-paced industry.
Python for Data Science
Python for Data SciencePanimalar Engineering College The document discusses installing Python 3 on Ubuntu and Windows systems. It provides step-by-step instructions for installing Python 3.8 using apt on Ubuntu and downloading/running the installer on Windows. Basic Python data visualization techniques like line plots, bar charts, histograms, box plots, and scatter plots are then introduced using the Matplotlib library. Code examples are given for creating each type of plot.

Machine learning libraries with python
Machine learning libraries with pythonVishalBisht9217 This document discusses machine learning with Python. It provides an overview of Python, highlighting that it is easy to learn, has a vast community and documentation, and is versatile. It then defines machine learning and discusses popular Python libraries for machine learning like NumPy, SciPy, Matplotlib, Pandas, and OpenCV. It provides examples of operations that can be performed with OpenCV, like reading and manipulating images. Overall the document serves as an introduction to machine learning with Python and the main libraries used.
Data-Analysis-and-Visualization-in-Python-1.pptx
Data-Analysis-and-Visualization-in-Python-1.pptxChiragNahata2 DATA ANALYSIS AND VISUALISATION using python
data analytics and visualization CO4_18_Data Types for Plotting.pptx
data analytics and visualization CO4_18_Data Types for Plotting.pptxJAVVAJI VENKATA RAO data analytics and visualization
UNIT_4_data visualization.pptx
UNIT_4_data visualization.pptxBhagyasriPatel2 The document discusses various data visualization techniques using Matplotlib in Python. It covers creating basic line plots and scatter plots, customizing plots by adding labels, legends, colors and styles. It also discusses different chart types like pie charts, bar charts, histograms and boxplots. Advanced techniques like showing correlations and time series analysis are also covered. The document provides code examples for each visualization technique.
Data Science Using Python.pptx
Data Science Using Python.pptxSarkunavathi Aribal Without analytics on big data, companies are unable to understand their environment and customers, similar to how deer cannot see or hear approaching vehicles on a highway. Presentations are tools that can be used for lectures, reports, and more. They serve various purposes, making presentations powerful tools for convincing and teaching others. Data science uses techniques from multiple fields like mathematics, statistics, and computer science to analyze large amounts of data and extract meaningful insights for business.
![python libray for data analytics seaborn[1].pptx](https://cdn.slidesharecdn.com/ss_thumbnails/pythonseaborn1-241222125910-e118d8f2-thumbnail.jpg?width=560&fit=bounds)
Adarsh_Masekar(2GP19CS003).pptx
Adarsh_Masekar(2GP19CS003).pptxhkabir55 Adarsh_Masekar(2GP19CS003).pptxAdarsh_Masekar(2GP19CS003).pptxAdarsh_Masekar(2GP19CS003).pptxAdarsh_Masekar(2GP19CS003).pptxAdarsh_Masekar(2GP19CS003).pptxAdarsh_Masekar(2GP19CS003).pptxAdarsh_Masekar(2GP19CS003).pptxAdarsh_Masekar(2GP19CS003).pptxAdarsh_Masekar(2GP19CS003).pptxAdarsh_Masekar(2GP19CS003).pptxAdarsh_Masekar(2GP19CS003).pptxAdarsh_Masekar(2GP19CS003).pptx
alltrinbruno(DS2) data science visualisation.pptx
alltrinbruno(DS2) data science visualisation.pptxrajavaishnaviit Data science visualisation techniques

Data Wrangling and Visualization Using Python
Data Wrangling and Visualization Using PythonMOHITKUMAR1379 Python is open source and has so many libraries for data wrangling and visualization that makes life of data scientists easier. For data wrangling pandas is used as it represent tabular data and it has other function to parse data from different sources, data cleaning, handling missing values, merging data sets etc. To visualize data, low level matplotlib can be used. But it is a base package for other high level packages such as seaborn, that draw well customized plot in just one line of code. Python has dash framework that is used to make interactive web application using python code without javascript and html. These dash application can be published on any server as well as on clouds like google cloud but freely on heroku cloud.
Introduction to Data Visualization, Importance and types
Introduction to Data Visualization, Importance and typesgrsssyw24 Data visualization is the graphical representation of information and data, allowing complex datasets to be interpreted visually through charts, graphs, and maps. It helps uncover patterns, trends, and outliers, transforming raw data into meaningful insights.
Ad
Recently uploaded (20)
Pests of Rice: Damage, Identification, Life history, and Management.pptx
Pests of Rice: Damage, Identification, Life history, and Management.pptxArshad Shaikh Rice pests can significantly impact crop yield and quality. Major pests include the brown plant hopper (Nilaparvata lugens), which transmits viruses like rice ragged stunt and grassy stunt; the yellow stem borer (Scirpophaga incertulas), whose larvae bore into stems causing deadhearts and whiteheads; and leaf folders (Cnaphalocrocis medinalis), which feed on leaves reducing photosynthetic area. Other pests include rice weevils (Sitophilus oryzae) and gall midges (Orseolia oryzae). Effective management strategies are crucial to minimize losses.
Unit 3 Poster Sketches with annotations.pptx
Unit 3 Poster Sketches with annotations.pptxbobby205207 Unit 3 Poster Sketches with annotations.pptx
Diptera: The Two-Winged Wonders, The Fly Squad: Order Diptera.pptx
Diptera: The Two-Winged Wonders, The Fly Squad: Order Diptera.pptxArshad Shaikh Diptera, commonly known as flies, is a large and diverse order of insects that includes mosquitoes, midges, gnats, and horseflies. Characterized by a single pair of wings (hindwings are modified into balancing organs called halteres), Diptera are found in almost every environment and play important roles in ecosystems as pollinators, decomposers, and food sources. Some species, however, are significant pests and disease vectors, transmitting diseases like malaria, dengue, and Zika virus.
How to Configure Vendor Management in Lunch App of Odoo 18
How to Configure Vendor Management in Lunch App of Odoo 18Celine George The Vendor management in the Lunch app of Odoo 18 is the central hub for managing all aspects of the restaurants or caterers that provide food for your employees.
Black and White Illustrative Group Project Presentation.pdf (1).pdf
Black and White Illustrative Group Project Presentation.pdf (1).pdfAnnasofiaUrsini mmmmmmmmmmmmmmmmmmmmmmmmmmmmmmmmmm
Energy Balances Of Oecd Countries 2011 Iea Statistics 1st Edition Oecd
Energy Balances Of Oecd Countries 2011 Iea Statistics 1st Edition Oecdrazelitouali Energy Balances Of Oecd Countries 2011 Iea Statistics 1st Edition Oecd
Energy Balances Of Oecd Countries 2011 Iea Statistics 1st Edition Oecd
Energy Balances Of Oecd Countries 2011 Iea Statistics 1st Edition Oecd
Pfeiffer "Secrets to Changing Behavior in Scholarly Communication: A 2025 NIS...
Pfeiffer "Secrets to Changing Behavior in Scholarly Communication: A 2025 NIS...National Information Standards Organization (NISO) This presentation was provided by Nicole 'Nici" Pfeiffer of the Center for Open Science (COS), during the first session of our 2025 NISO training series "Secrets to Changing Behavior in Scholarly Communications." Session One was held June 5, 2025.
TV Shows and web-series quiz | QUIZ CLUB OF PSGCAS | 13TH MARCH 2025
TV Shows and web-series quiz | QUIZ CLUB OF PSGCAS | 13TH MARCH 2025Quiz Club of PSG College of Arts & Science HOW YOU DOIN'?
Cool, cool, cool...
Because that's what she said after THE QUIZ CLUB OF PSGCAS' TV SHOW quiz.
Grab your popcorn and be seated.
QM: THARUN S A
BCom Accounting and Finance (2023-26)
THE QUIZ CLUB OF PSGCAS.
Analysis of Quantitative Data Parametric and non-parametric tests.pptx
Analysis of Quantitative Data Parametric and non-parametric tests.pptxShrutidhara2 This presentation covers the following points--
Parametric Tests
• Testing the Significance of the Difference between Means
• Analysis of Variance (ANOVA) - One way and Two way
• Analysis of Co-variance (One-way)
Non-Parametric Tests:
• Chi-Square test
• Sign test
• Median test
• Sum of Rank test
• Mann-Whitney U-test
Moreover, it includes a comparison of parametric and non-parametric tests, a comparison of one-way ANOVA, two-way ANOVA, and one-way ANCOVA.


SEXUALITY , UNWANTED PREGANCY AND SEXUAL ASSAULT .pptx
SEXUALITY , UNWANTED PREGANCY AND SEXUAL ASSAULT .pptxPoojaSen20 SEXUALITY AND ITS TYPES , UNWANTED PREGANCY AND SEXUAL ASSAULT
Strengthened Senior High School - Landas Tool Kit.pptx
Strengthened Senior High School - Landas Tool Kit.pptxSteffMusniQuiballo Landas Tool Kit is a very helpful guide in guiding the Senior High School students on their SHS academic journey. It will pave the way on what curriculum exits will they choose and fit in.
Unit- 4 Biostatistics & Research Methodology.pdf
Unit- 4 Biostatistics & Research Methodology.pdfKRUTIKA CHANNE Blocking and confounding (when a third variable, or confounder, influences both the exposure and the outcome) system for Two-level factorials (a type of experimental design where each factor (independent variable) is investigated at only two levels, typically denoted as "high" and "low" or "+1" and "-1")
Regression modeling (statistical model that estimates the relationship between one dependent variable and one or more independent variables using a line): Hypothesis testing in Simple and Multiple regression models
Introduction to Practical components of Industrial and Clinical Trials Problems: Statistical Analysis Using Excel, SPSS, MINITAB®️, DESIGN OF EXPERIMENTS, R - Online Statistical Software to Industrial and Clinical trial approach
Different pricelists for different shops in odoo Point of Sale in Odoo 17
Different pricelists for different shops in odoo Point of Sale in Odoo 17Celine George Price lists are a useful tool for managing the costs of your goods and services. This can assist you in working with other businesses effectively and maximizing your revenues. Additionally, you can provide your customers discounts by using price lists.
LDMMIA Reiki Yoga Next Week Grad Updates
LDMMIA Reiki Yoga Next Week Grad UpdatesLDM & Mia eStudios A short update and next week. I am writing both Session 9 and Orientation S1.
As a Guest Student,
You are now upgraded to Grad Level.
See Uploads for “Student Checkin” & “S8”. Thx.
Thank you for attending our workshops.
If you are new, do welcome.
Grad Students: I am planning a Reiki-Yoga Master Course (As a package). I’m Fusing both together.
This will include the foundation of each practice. Our Free Workshops can be used with any Reiki Yoga training package. Traditional Reiki does host rules and ethics. Its silent and within the JP Culture/Area/Training/Word of Mouth. It allows remote healing but there’s limits As practitioners and masters. We are not allowed to share certain secrets/tools. Some content is designed only for “Masters”. Some yoga are similar like the Kriya Yoga-Church (Vowed Lessons). We will review both Reiki and Yoga (Master tools) in the Course upcoming.
Session Practice, For Reference:
Before starting a session, Make sure to check your environment. Nothing stressful. Later, You can decorate a space as well.
Check the comfort level, any needed resources (Yoga/Reiki/Spa Props), or Meditation Asst?
Props can be oils, sage, incense, candles, crystals, pillows, blankets, yoga mat, any theme applies.
Select your comfort Pose. This can be standing, sitting, laying down, or a combination.
Monitor your breath. You can add exercises.
Add any mantras or affirmations. This does aid mind and spirit. It helps you to focus.
Also you can set intentions using a candle.
The Yoga-key is balancing mind, body, and spirit.
Finally, The Duration can be long or short.
Its a good session base for any style.
Next Week’s Focus:
A continuation of Intuition Development. We will review the Chakra System - Our temple. A misguided, misused situation lol. This will also serve Attunement later.
For Sponsor,
General updates,
& Donations:
Please visit:
https://ldmchapels.weebly.com
How to Create Quotation Templates Sequence in Odoo 18 Sales
How to Create Quotation Templates Sequence in Odoo 18 SalesCeline George In this slide, we’ll discuss on how to create quotation templates sequence in Odoo 18 Sales. Odoo 18 Sales offers a variety of quotation templates that can be used to create different types of sales documents.
Ray Dalio How Countries go Broke the Big Cycle
Ray Dalio How Countries go Broke the Big CycleDadang Solihin A complete and practical understanding of the Big Debt Cycle. A much more practical understanding of how supply and demand really work compared to the conventional economic thinking. A complete and practical understanding of the Overall Big Cycle, which is driven by the Big Debt Cycle and the other major cycles, including the big political cycle within countries that changes political orders and the big geopolitical cycle that changes world orders.
june 10 2025 ppt for madden on art science is over.pptx
june 10 2025 ppt for madden on art science is over.pptxroger malina art science is over -talk by roger malina for jack madden group
Pfeiffer "Secrets to Changing Behavior in Scholarly Communication: A 2025 NIS...
Pfeiffer "Secrets to Changing Behavior in Scholarly Communication: A 2025 NIS...National Information Standards Organization (NISO)
TV Shows and web-series quiz | QUIZ CLUB OF PSGCAS | 13TH MARCH 2025
TV Shows and web-series quiz | QUIZ CLUB OF PSGCAS | 13TH MARCH 2025Quiz Club of PSG College of Arts & Science
Ad
DATA VISUALIZATION USING MATPLOTLIB (PYTHON)
- 1. WHY DATA VISUALIZATION Data visualization helps us to quickly interpret data and adjust different variables to see their effect.
- 2. Why data visualization Human brain can process information easily when it is in pictorial or in graphical form.
- 3. Python (programming language) Python is an interpreted, high-level and general-purpose programming language. Created by Guido van Rossum and first released in 1991 Python can be easy to pick up whether you're a first time programmer or you're experienced with other languages.
- 4. Advantages of python Versatile, Easy to Use and Fast to Develop This language is an obvious choice for machine learning, data analysis and visualisation. AI-first companies should love it Has All the Libraries You Can Imagine Open Source with a Vibrant Community Great for Prototypes - You Can Do More with Less Code
- 5. Python libraries Numpy Matplotlib Pandas Pillow TensorFlow Keras Theano, etc. Commonly-used modules that contain source code for generic needs are called Libraries Library in python is a collection of various python packages. Conceptually there is no difference between package and Python library.
- 6. Matplotlib is a comprehensive library for creating static, animated, and interactive visualizations in Python. Matplotlib is a 2D plotting library that helps in visualizing figures. Matplotlib is used in Python as it is robust, free and easy library for data visualization.
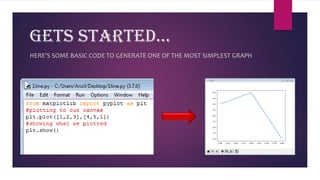
- 7. Gets started… HERE’S SOME BASIC CODE TO GENERATE ONE OF THE MOST SIMPLEST GRAPH
- 8. Bar graph
- 9. Scatter plot
- 10. histogram
- 11. Pie chart
- 12. Working with multiple plots
- 13. Fits your brain (part II): But I think this is the python