Data Visualization using matplotlib
3 likes772 views

The document discusses data visualization using Matplotlib, emphasizing the cognitive aspects of human perception, color theory, and the fundamental tools for creating various types of plots. It provides essential guidelines for effective visual representation of data, including techniques to depict comparisons, causality, and multivariate data. Additionally, it outlines the object-oriented structure of Matplotlib for programming visualizations and the intuitive functions for creating and customizing plots.
1 of 50
Downloaded 24 times


Ad
Recommended
Data visualization in Python
Data visualization in PythonMarc Garcia This document discusses data visualization tools in Python. It introduces Matplotlib as the first and still standard Python visualization tool. It also covers Seaborn which builds on Matplotlib, Bokeh for interactive visualizations, HoloViews as a higher-level wrapper for Bokeh, and Datashader for big data visualization. Additional tools discussed include Folium for maps, and yt for volumetric data visualization. The document concludes that Python is well-suited for data science and visualization with many options available.
Introduction to Pandas and Time Series Analysis [PyCon DE]
Introduction to Pandas and Time Series Analysis [PyCon DE]Alexander Hendorf The document introduces Pandas, an open-source Python library launched in 2008 by Wes McKinney, aimed at practical data analysis and efficient workflows without switching to other languages. It highlights key features such as support for various data formats, data cleansing, reshaping, and visualization capabilities integrated with Jupyter notebooks. The second part delves into time series analysis, discussing frequency options and data aggregation methods with a focus on the timeseries index.
Dimensionality Reduction
Dimensionality Reductionmrizwan969 This document discusses dimensionality reduction techniques for data mining. It begins with an introduction to dimensionality reduction and reasons for using it. These include dealing with high-dimensional data issues like the curse of dimensionality. It then covers major dimensionality reduction techniques of feature selection and feature extraction. Feature selection techniques discussed include search strategies, feature ranking, and evaluation measures. Feature extraction maps data to a lower-dimensional space. The document outlines applications of dimensionality reduction like text mining and gene expression analysis. It concludes with trends in the field.
Machine Learning: Bias and Variance Trade-off
Machine Learning: Bias and Variance Trade-offInternational Institute of Information Technology (I²IT) Machine learning models involve a bias-variance tradeoff, where increased model complexity can lead to overfitting training data (high variance) or underfitting (high bias). Bias measures how far model predictions are from the correct values on average, while variance captures differences between predictions on different training data. The ideal model has low bias and low variance, accurately fitting training data while generalizing to new examples.
An introduction to Machine Learning
An introduction to Machine Learningbutest This document provides an introduction to machine learning. It discusses how machine learning allows computers to learn from experience to improve their performance on tasks. Supervised learning is described, where the goal is to learn a function that maps inputs to outputs from a labeled dataset. Cross-validation techniques like the test set method, leave-one-out cross-validation, and k-fold cross-validation are introduced to evaluate model performance without overfitting. Applications of machine learning like medical diagnosis, recommendation systems, and autonomous driving are briefly outlined.
Text Classification
Text ClassificationRAX Automation Suite The document outlines a research overview on text classification for Rax Studio, emphasizing natural language processing applications such as sentiment analysis and intent classification. It details the data preprocessing steps, feature extraction methods like one-hot encoding and word2vec, and various machine learning models including Naive Bayes and multilayer perceptron. Additionally, it suggests an implementation plan focused on email management and cleaning, with a framework for model updating and retraining.
Logistic regression in Machine Learning
Logistic regression in Machine LearningKuppusamy P Logistic regression is a predictive analysis algorithm that can be used for classification problems. It estimates the probabilities of different classes using the logistic function, which outputs values between 0 and 1. Logistic regression transforms its output using the sigmoid function to return a probability value. It is used for problems like email spam detection, fraud detection, and tumor classification. The independent variables should be independent of each other and the dependent variable must be categorical. Gradient descent is used to minimize the loss function and optimize the model parameters during training.
Classification Based Machine Learning Algorithms
Classification Based Machine Learning AlgorithmsMd. Main Uddin Rony This document provides an overview of classification-based machine learning algorithms, primarily focusing on naive Bayes classifiers and decision trees. It explains the workings of the naive Bayes classifier using Bayes' theorem and class-conditional independence, along with hands-on examples. Furthermore, it outlines the process of building decision trees using the ID3 algorithm, entropy, information gain, and the k-nearest neighbors classification method.
NLP
NLPGirish Khanzode This document provides an overview of natural language processing (NLP). It discusses topics like natural language understanding, text categorization, syntactic analysis including parsing and part-of-speech tagging, semantic analysis, and pragmatic analysis. It also covers corpus-based statistical approaches to NLP, measuring performance, and supervised learning methods. The document outlines challenges in NLP like ambiguity and knowledge representation.
Introduction to pandas
Introduction to pandasPiyush rai The document serves as an introduction to the Pandas library, covering its data structures: Series, DataFrame, and Panel. It explains how to create and manipulate these structures, with examples including adding and deleting columns, reindexing, and handling categorical data. Key functionalities for data manipulation and analysis are highlighted, demonstrating the library's versatility in managing heterogeneous data types.
HML: Historical View and Trends of Deep Learning
HML: Historical View and Trends of Deep LearningYan Xu The document provides a historical view and trends of deep learning. It discusses that deep learning models have evolved in several waves since the 1940s, with key developments including the backpropagation algorithm in 1986 and deep belief networks with pretraining in 2006. Current trends include growing datasets, increasing numbers of neurons and connections per neuron, and higher accuracy on tasks involving vision, NLP and games. Research trends focus on generative models, domain alignment, meta-learning, using graphs as inputs, and program induction.
Python Matplotlib Tutorial | Matplotlib Tutorial | Python Tutorial | Python T...
Python Matplotlib Tutorial | Matplotlib Tutorial | Python Tutorial | Python T...Edureka! The document is a training guide about Python's data visualization using Matplotlib, covering key topics such as why data visualization is important, its definition, and various types of plots like bar graphs, histograms, scatter plots, and pie charts. It includes basic code examples to create these plots and discusses customization options for graphs. The guide aims to help users interpret data effectively through visual representations.
Computational Learning Theory
Computational Learning Theorybutest The document discusses the theoretical framework of computational learning theory and PAC (Probably Approximately Correct) learning. It defines what makes a learning problem PAC learnable and examines how the number of training examples needed for learning is affected by factors like the hypothesis space size, error tolerance, and confidence level. Key questions addressed include determining learnability of problem classes and bounding the sample complexity of learning algorithms.
Dimension Reduction Introduction & PCA.pptx
Dimension Reduction Introduction & PCA.pptxRohanBorgalli PCA is a dimensionality reduction technique that uses linear transformations to project high-dimensional data onto a lower-dimensional space while retaining as much information as possible. It works by identifying patterns in data and expressing the data in such a way as to highlight their similarities and differences. Specifically, PCA uses linear combinations of the original variables to extract the most important patterns from the data in the form of principal components. The first principal component accounts for as much of the variability in the data as possible, and each succeeding component accounts for as much of the remaining variability as possible.
NUMPY
NUMPY Global Academy of Technology NumPy is a Python library that provides multidimensional array and matrix objects to perform scientific computing. It contains efficient functions for operations on arrays like arithmetic, aggregation, copying, indexing, slicing, and reshaping. NumPy arrays have advantages over native Python sequences like fixed size and efficient mathematical operations. Common NumPy operations include elementwise arithmetic, aggregation functions, copying and transposing arrays, changing array shapes, and indexing/slicing arrays.
Cross-validation Tutorial: What, how and which?
Cross-validation Tutorial: What, how and which?Pradeep Redddy Raamana The document discusses cross-validation, which is used to estimate how well a machine learning model will generalize to unseen data. It defines cross-validation as splitting a dataset into training and test sets to train a model on the training set and evaluate it on the held-out test set. Common types of cross-validation discussed are k-fold cross-validation, which repeats the process by splitting the data into k folds, and repeated holdout validation, which randomly samples subsets for training and testing over multiple repetitions.
Scikit-Learn: Machine Learning in Python
Scikit-Learn: Machine Learning in PythonMicrosoft This document provides an overview of machine learning and the scikit-learn library. It discusses predictive modeling using historical data to build executable models for making predictions on new data. It describes how scikit-learn provides machine learning algorithms and tools through a simple API using Python, NumPy and SciPy. It highlights improvements in scikit-learn 0.15, including reduced training times for ensemble methods and optimized memory usage. It demos income classification using scikit-learn with Census data in an IPython notebook.
Topic Modeling
Topic ModelingKarol Grzegorczyk Topic modeling is a technique for discovering hidden semantic patterns in large document collections. It represents documents as probability distributions over latent topics, where each topic is characterized by a distribution over words. Two common probabilistic topic models are latent Dirichlet allocation (LDA) and probabilistic latent semantic analysis (pLSA). LDA assumes each document exhibits multiple topics in different proportions, with topics modeled as distributions over words. Topic modeling provides dimensionality reduction and can be applied to problems like text classification, collaborative filtering, and computer vision tasks like image classification.
Python NumPy Tutorial | NumPy Array | Edureka
Python NumPy Tutorial | NumPy Array | EdurekaEdureka! The document outlines a Python certification training program focused on NumPy, a core library for scientific computing in Python that provides high-performance multidimensional array objects. It compares NumPy with lists, highlighting advantages such as less memory usage and faster operations. Additionally, it covers various NumPy operations and special functions, including array manipulation and mathematical functions.
Modelling and evaluation
Modelling and evaluationeShikshak The document discusses modelling and evaluation in machine learning. It defines what models are and how they are selected and trained for predictive and descriptive tasks. Specifically, it covers:
1) Models represent raw data in meaningful patterns and are selected based on the problem and data type, like regression for continuous numeric prediction.
2) Models are trained by assigning parameters to optimize an objective function and evaluate quality. Cross-validation is used to evaluate models.
3) Predictive models predict target values like classification to categorize data or regression for continuous targets. Descriptive models find patterns without targets for tasks like clustering.
4) Model performance can be affected by underfitting if too simple or overfitting if too complex,
Introduction to matplotlib
Introduction to matplotlibPiyush rai Matplotlib is a powerful Python library for 2D data visualization built on NumPy, introduced by John Hunter in 2002. It supports various plot types like line, bar, histogram, and scatter, and allows for multi-plot creation with the .subplot() method. It is essential for data analysis and can enhance machine learning models through effective visualization techniques.
Hands-On Machine Learning with Scikit-Learn and TensorFlow - Chapter8
Hands-On Machine Learning with Scikit-Learn and TensorFlow - Chapter8Hakky St The document discusses the importance of dimensionality reduction in machine learning, addressing issues such as the curse of dimensionality, which complicates data analysis with high-dimensional datasets. It introduces various methods for reducing dimensions, including PCA, manifold learning, and other techniques, while emphasizing the balances between maintaining data integrity and improving computational efficiency. Practical examples and applications of these methods, including the use of scikit-learn for implementation, are provided throughout.
Machine Learning Tutorial Part - 2 | Machine Learning Tutorial For Beginners ...
Machine Learning Tutorial Part - 2 | Machine Learning Tutorial For Beginners ...Simplilearn The document discusses clustering, specifically k-means clustering, explaining its purpose as an unsupervised learning method for grouping unlabeled data based on feature similarity. It also covers logistic regression, a classification algorithm for binary and multi-classification problems, highlighting its use in predicting outcomes like the malignancy of tumors. Examples and methods such as the elbow method for determining the number of clusters in k-means are also provided.
Data Visualization in Python
Data Visualization in PythonJagriti Goswami This document provides an overview of data visualization in Python. It discusses popular Python libraries and modules for visualization like Matplotlib, Seaborn, Pandas, NumPy, Plotly, and Bokeh. It also covers different types of visualization plots like bar charts, line graphs, pie charts, scatter plots, histograms and how to create them in Python using the mentioned libraries. The document is divided into sections on visualization libraries, version overview of updates to plots, and examples of various plot types created in Python.
Introduction to Machine Learning with SciKit-Learn
Introduction to Machine Learning with SciKit-LearnBenjamin Bengfort The document provides an extensive overview of machine learning concepts, particularly using the scikit-learn library, covering topics such as supervised and unsupervised learning, model evaluation, and various algorithms. It outlines the process of building machine learning models, including data handling, feature extraction, and evaluation metrics, as well as discussing the architecture for operationalizing these models. Additionally, it introduces scikit-learn, its features, and the importance of proper methodology to avoid overfitting and underfitting in machine learning applications.
Exploratory data analysis
Exploratory data analysisGramener The document discusses exploratory data analysis and provides examples of how it can be used. It summarizes two case studies: one where an energy utility detected billing fraud by analyzing meter reading patterns, and another where month of birth was found to correlate with exam scores for students in Tamil Nadu. The document then outlines the exploratory data analysis process and provides a high-level overview of U.S. and Indian birth date patterns identified through analysis of large datasets.
Machine Learning
Machine LearningShrey Malik Active learning is a machine learning technique where the learner is able to interactively query the oracle (e.g. a human) to obtain labels for new data points in an effort to learn more accurately from fewer labeled examples. The learner selects the most informative samples to be labeled by the oracle, such as samples closest to the decision boundary or where models disagree most. This allows the learner to minimize the number of labeled samples needed, thus reducing the cost of training an accurate model. Suggested improvements include querying batches of samples instead of single samples and accounting for varying labeling costs.
Data Science With Python | Python For Data Science | Python Data Science Cour...
Data Science With Python | Python For Data Science | Python Data Science Cour...Simplilearn The document provides a comprehensive overview of data science, emphasizing the importance of Python for data analysis due to its speed and extensive libraries like Pandas, NumPy, and Scikit-learn. It covers essential concepts such as exploratory data analysis, data wrangling, and building predictive models, specifically using logistic regression for a loan prediction problem. The content is structured to guide readers through the process of data handling, model building, and deriving insights from data.
UNIT-5-II IT-DATA VISUALIZATION TECHNIQUES
UNIT-5-II IT-DATA VISUALIZATION TECHNIQUEShemalathab24 The document provides a comprehensive overview of data visualization techniques using the matplotlib library in Python, including creating various types of plots such as line plots, scatter plots, and histograms. It explains the importance of visualizing data for better understanding and insights, while also detailing customization options like labels, annotations, and error bars. Additionally, the document covers advanced plotting techniques, including density and contour plots for representing multidimensional data.
711118749-FDS-UNIT-5-PPT.pdf is used to the engineering students
711118749-FDS-UNIT-5-PPT.pdf is used to the engineering studentssudhakarana260901 The document provides an overview of using the Matplotlib library for data visualization in Python, covering how to create various types of plots including line plots, scatter plots, and error bars. It details adjusting plot aesthetics such as line colors, styles, and labeling, along with examples of coding these visualizations. Additionally, it explores the critical aspect of visualizing errors in scientific data to enhance understanding of measurements and their uncertainties.
More Related Content
What's hot (20)
NLP
NLPGirish Khanzode This document provides an overview of natural language processing (NLP). It discusses topics like natural language understanding, text categorization, syntactic analysis including parsing and part-of-speech tagging, semantic analysis, and pragmatic analysis. It also covers corpus-based statistical approaches to NLP, measuring performance, and supervised learning methods. The document outlines challenges in NLP like ambiguity and knowledge representation.
Introduction to pandas
Introduction to pandasPiyush rai The document serves as an introduction to the Pandas library, covering its data structures: Series, DataFrame, and Panel. It explains how to create and manipulate these structures, with examples including adding and deleting columns, reindexing, and handling categorical data. Key functionalities for data manipulation and analysis are highlighted, demonstrating the library's versatility in managing heterogeneous data types.
HML: Historical View and Trends of Deep Learning
HML: Historical View and Trends of Deep LearningYan Xu The document provides a historical view and trends of deep learning. It discusses that deep learning models have evolved in several waves since the 1940s, with key developments including the backpropagation algorithm in 1986 and deep belief networks with pretraining in 2006. Current trends include growing datasets, increasing numbers of neurons and connections per neuron, and higher accuracy on tasks involving vision, NLP and games. Research trends focus on generative models, domain alignment, meta-learning, using graphs as inputs, and program induction.
Python Matplotlib Tutorial | Matplotlib Tutorial | Python Tutorial | Python T...
Python Matplotlib Tutorial | Matplotlib Tutorial | Python Tutorial | Python T...Edureka! The document is a training guide about Python's data visualization using Matplotlib, covering key topics such as why data visualization is important, its definition, and various types of plots like bar graphs, histograms, scatter plots, and pie charts. It includes basic code examples to create these plots and discusses customization options for graphs. The guide aims to help users interpret data effectively through visual representations.
Computational Learning Theory
Computational Learning Theorybutest The document discusses the theoretical framework of computational learning theory and PAC (Probably Approximately Correct) learning. It defines what makes a learning problem PAC learnable and examines how the number of training examples needed for learning is affected by factors like the hypothesis space size, error tolerance, and confidence level. Key questions addressed include determining learnability of problem classes and bounding the sample complexity of learning algorithms.
Dimension Reduction Introduction & PCA.pptx
Dimension Reduction Introduction & PCA.pptxRohanBorgalli PCA is a dimensionality reduction technique that uses linear transformations to project high-dimensional data onto a lower-dimensional space while retaining as much information as possible. It works by identifying patterns in data and expressing the data in such a way as to highlight their similarities and differences. Specifically, PCA uses linear combinations of the original variables to extract the most important patterns from the data in the form of principal components. The first principal component accounts for as much of the variability in the data as possible, and each succeeding component accounts for as much of the remaining variability as possible.
NUMPY
NUMPY Global Academy of Technology NumPy is a Python library that provides multidimensional array and matrix objects to perform scientific computing. It contains efficient functions for operations on arrays like arithmetic, aggregation, copying, indexing, slicing, and reshaping. NumPy arrays have advantages over native Python sequences like fixed size and efficient mathematical operations. Common NumPy operations include elementwise arithmetic, aggregation functions, copying and transposing arrays, changing array shapes, and indexing/slicing arrays.
Cross-validation Tutorial: What, how and which?
Cross-validation Tutorial: What, how and which?Pradeep Redddy Raamana The document discusses cross-validation, which is used to estimate how well a machine learning model will generalize to unseen data. It defines cross-validation as splitting a dataset into training and test sets to train a model on the training set and evaluate it on the held-out test set. Common types of cross-validation discussed are k-fold cross-validation, which repeats the process by splitting the data into k folds, and repeated holdout validation, which randomly samples subsets for training and testing over multiple repetitions.
Scikit-Learn: Machine Learning in Python
Scikit-Learn: Machine Learning in PythonMicrosoft This document provides an overview of machine learning and the scikit-learn library. It discusses predictive modeling using historical data to build executable models for making predictions on new data. It describes how scikit-learn provides machine learning algorithms and tools through a simple API using Python, NumPy and SciPy. It highlights improvements in scikit-learn 0.15, including reduced training times for ensemble methods and optimized memory usage. It demos income classification using scikit-learn with Census data in an IPython notebook.
Topic Modeling
Topic ModelingKarol Grzegorczyk Topic modeling is a technique for discovering hidden semantic patterns in large document collections. It represents documents as probability distributions over latent topics, where each topic is characterized by a distribution over words. Two common probabilistic topic models are latent Dirichlet allocation (LDA) and probabilistic latent semantic analysis (pLSA). LDA assumes each document exhibits multiple topics in different proportions, with topics modeled as distributions over words. Topic modeling provides dimensionality reduction and can be applied to problems like text classification, collaborative filtering, and computer vision tasks like image classification.
Python NumPy Tutorial | NumPy Array | Edureka
Python NumPy Tutorial | NumPy Array | EdurekaEdureka! The document outlines a Python certification training program focused on NumPy, a core library for scientific computing in Python that provides high-performance multidimensional array objects. It compares NumPy with lists, highlighting advantages such as less memory usage and faster operations. Additionally, it covers various NumPy operations and special functions, including array manipulation and mathematical functions.
Modelling and evaluation
Modelling and evaluationeShikshak The document discusses modelling and evaluation in machine learning. It defines what models are and how they are selected and trained for predictive and descriptive tasks. Specifically, it covers:
1) Models represent raw data in meaningful patterns and are selected based on the problem and data type, like regression for continuous numeric prediction.
2) Models are trained by assigning parameters to optimize an objective function and evaluate quality. Cross-validation is used to evaluate models.
3) Predictive models predict target values like classification to categorize data or regression for continuous targets. Descriptive models find patterns without targets for tasks like clustering.
4) Model performance can be affected by underfitting if too simple or overfitting if too complex,
Introduction to matplotlib
Introduction to matplotlibPiyush rai Matplotlib is a powerful Python library for 2D data visualization built on NumPy, introduced by John Hunter in 2002. It supports various plot types like line, bar, histogram, and scatter, and allows for multi-plot creation with the .subplot() method. It is essential for data analysis and can enhance machine learning models through effective visualization techniques.
Hands-On Machine Learning with Scikit-Learn and TensorFlow - Chapter8
Hands-On Machine Learning with Scikit-Learn and TensorFlow - Chapter8Hakky St The document discusses the importance of dimensionality reduction in machine learning, addressing issues such as the curse of dimensionality, which complicates data analysis with high-dimensional datasets. It introduces various methods for reducing dimensions, including PCA, manifold learning, and other techniques, while emphasizing the balances between maintaining data integrity and improving computational efficiency. Practical examples and applications of these methods, including the use of scikit-learn for implementation, are provided throughout.
Machine Learning Tutorial Part - 2 | Machine Learning Tutorial For Beginners ...
Machine Learning Tutorial Part - 2 | Machine Learning Tutorial For Beginners ...Simplilearn The document discusses clustering, specifically k-means clustering, explaining its purpose as an unsupervised learning method for grouping unlabeled data based on feature similarity. It also covers logistic regression, a classification algorithm for binary and multi-classification problems, highlighting its use in predicting outcomes like the malignancy of tumors. Examples and methods such as the elbow method for determining the number of clusters in k-means are also provided.
Data Visualization in Python
Data Visualization in PythonJagriti Goswami This document provides an overview of data visualization in Python. It discusses popular Python libraries and modules for visualization like Matplotlib, Seaborn, Pandas, NumPy, Plotly, and Bokeh. It also covers different types of visualization plots like bar charts, line graphs, pie charts, scatter plots, histograms and how to create them in Python using the mentioned libraries. The document is divided into sections on visualization libraries, version overview of updates to plots, and examples of various plot types created in Python.
Introduction to Machine Learning with SciKit-Learn
Introduction to Machine Learning with SciKit-LearnBenjamin Bengfort The document provides an extensive overview of machine learning concepts, particularly using the scikit-learn library, covering topics such as supervised and unsupervised learning, model evaluation, and various algorithms. It outlines the process of building machine learning models, including data handling, feature extraction, and evaluation metrics, as well as discussing the architecture for operationalizing these models. Additionally, it introduces scikit-learn, its features, and the importance of proper methodology to avoid overfitting and underfitting in machine learning applications.
Exploratory data analysis
Exploratory data analysisGramener The document discusses exploratory data analysis and provides examples of how it can be used. It summarizes two case studies: one where an energy utility detected billing fraud by analyzing meter reading patterns, and another where month of birth was found to correlate with exam scores for students in Tamil Nadu. The document then outlines the exploratory data analysis process and provides a high-level overview of U.S. and Indian birth date patterns identified through analysis of large datasets.
Machine Learning
Machine LearningShrey Malik Active learning is a machine learning technique where the learner is able to interactively query the oracle (e.g. a human) to obtain labels for new data points in an effort to learn more accurately from fewer labeled examples. The learner selects the most informative samples to be labeled by the oracle, such as samples closest to the decision boundary or where models disagree most. This allows the learner to minimize the number of labeled samples needed, thus reducing the cost of training an accurate model. Suggested improvements include querying batches of samples instead of single samples and accounting for varying labeling costs.
Data Science With Python | Python For Data Science | Python Data Science Cour...
Data Science With Python | Python For Data Science | Python Data Science Cour...Simplilearn The document provides a comprehensive overview of data science, emphasizing the importance of Python for data analysis due to its speed and extensive libraries like Pandas, NumPy, and Scikit-learn. It covers essential concepts such as exploratory data analysis, data wrangling, and building predictive models, specifically using logistic regression for a loan prediction problem. The content is structured to guide readers through the process of data handling, model building, and deriving insights from data.
Similar to Data Visualization using matplotlib (20)
UNIT-5-II IT-DATA VISUALIZATION TECHNIQUES
UNIT-5-II IT-DATA VISUALIZATION TECHNIQUEShemalathab24 The document provides a comprehensive overview of data visualization techniques using the matplotlib library in Python, including creating various types of plots such as line plots, scatter plots, and histograms. It explains the importance of visualizing data for better understanding and insights, while also detailing customization options like labels, annotations, and error bars. Additionally, the document covers advanced plotting techniques, including density and contour plots for representing multidimensional data.
711118749-FDS-UNIT-5-PPT.pdf is used to the engineering students
711118749-FDS-UNIT-5-PPT.pdf is used to the engineering studentssudhakarana260901 The document provides an overview of using the Matplotlib library for data visualization in Python, covering how to create various types of plots including line plots, scatter plots, and error bars. It details adjusting plot aesthetics such as line colors, styles, and labeling, along with examples of coding these visualizations. Additionally, it explores the critical aspect of visualizing errors in scientific data to enhance understanding of measurements and their uncertainties.
UNIT_4_data visualization.pptx
UNIT_4_data visualization.pptxBhagyasriPatel2 The document discusses various data visualization techniques using Matplotlib in Python. It covers creating basic line plots and scatter plots, customizing plots by adding labels, legends, colors and styles. It also discusses different chart types like pie charts, bar charts, histograms and boxplots. Advanced techniques like showing correlations and time series analysis are also covered. The document provides code examples for each visualization technique.
Matplotlib.pptx for data analysis and visualization
Matplotlib.pptx for data analysis and visualizationbdike Matplotlib is a widely-used Python library for data visualization that allows for extensive customization and various plot types. It supports both functional and object-oriented programming methods, which can initially be confusing for beginners. This document covers the basics of using Matplotlib, including creating figures and subplots, styling plots, and references to additional resources and exercises.
Introduction to Matplotlib Library in Python.pptx
Introduction to Matplotlib Library in Python.pptxbajajrishabh96tech Matplotlib is a widely used Python library for creating a variety of visualizations, including line plots, bar plots, and histograms, which assist in understanding data patterns and relationships. It categorizes plots into univariate, bivariate, multivariate, and others, enhancing versatility for different data visualization needs. The library integrates well with other Python libraries such as NumPy and Pandas, improving workflow efficiency for data scientists and analysts.
data analytics and visualization CO4_18_Data Types for Plotting.pptx
data analytics and visualization CO4_18_Data Types for Plotting.pptxJAVVAJI VENKATA RAO data analytics and visualization
Matplotlib_Presentation jk jdjklskncncsjkk
Matplotlib_Presentation jk jdjklskncncsjkksarfarazkhanwattoo Matplotlib is a Python library for creating static, animated, and interactive visualizations, developed by John D. Hunter in 2003. It is versatile, customizable, and integrates well with libraries like NumPy and Pandas, making it useful for data analysis, scientific research, and machine learning insights. The library supports various plot types and has features for advanced visualizations, with best practices recommended for effective data representation.
Python_Matplotlib_13. _Slides.pptx
Python_Matplotlib_13. _Slides.pptxsukeerthankoyyada Python_Matplotlib_13_Slides_With_Diagrams.pptxPython_Matplotlib_13_Slides_With_Diagrams.pptx
Python_Matplotlib_13_Slides_With_Diagrams.pptx
Python_Matplotlib_13_Slides_With_Diagrams.pptxsukeerthankoyyada Python_Matplotlib_13_Slides_With_Diagrams.pptx
a9bf73_Introduction to Matplotlib01.pptx
a9bf73_Introduction to Matplotlib01.pptxRahidkhan10 The document provides a comprehensive introduction to matplotlib, a Python library used for creating various types of plots including line graphs, bar plots, scatter plots, and histograms. It covers basics like importing pyplot, customizing plots, adding multiple lines, creating subplots, and exploring advanced techniques for better data visualization. Additionally, it includes mini-projects to apply the concepts learned, such as visualizing sales data and temperature variations.
Matplotlib Review 2021
Matplotlib Review 2021Bhaskar J.Roy The document provides an overview of the Matplotlib library architecture and its key components. It discusses the three layers of Matplotlib - the backend layer, artist layer, and scripting layer. The backend layer handles rendering plots into different formats. The artist layer contains classes that generate visual elements. The scripting layer provides interfaces for users to access the other layers and generate figures and plots. It also outlines some common plot types and customization techniques in Matplotlib.
Matplotlib_Complete review_2021_abridged_version
Matplotlib_Complete review_2021_abridged_versionBhaskar J.Roy This document provides a comprehensive overview of Matplotlib, a popular Python library for creating static, animated, and interactive visualizations. It covers the library's architecture, including its backend, artist, and scripting layers, as well as practical usage through both the pyplot and object-oriented interfaces. Additionally, it delves into topics such as color specifications, colormaps, and common plotting techniques, with numerous examples and references.
S4-Matplotlib_Computational_Physics_.pdf
S4-Matplotlib_Computational_Physics_.pdfCARLOSANDRESVIDALBET The document provides an overview of Matplotlib, a Python library for creating 2D plots, highlighting its ease of use and customization options for various types of plots. It covers features for beginners and intermediate users, including figure composition, plot types, and tips for enhancing visual quality. Advanced plotting techniques and utilities for optimizing plots are also discussed.
Transcript - Data Visualisation - Tools and Techniques
Transcript - Data Visualisation - Tools and TechniquesARDC Martin Schweitzer presents on data visualization tools and techniques. He demonstrates Matplotlib, Pandas, Seaborn, Bokeh, Plotly, and Basemap. With Matplotlib, he creates simple plots with just one or two lines of code, as well as more advanced plots. Pandas allows plotting data from CSV files easily. Seaborn builds on Matplotlib to provide publication-ready styling and includes sample datasets. Web-based tools like Bokeh and Plotly allow interactive visualizations. Basemap supports geographic data visualization.
PYTHON-Chapter 4-Plotting and Data Science PyLab - MAULIK BORSANIYA
PYTHON-Chapter 4-Plotting and Data Science PyLab - MAULIK BORSANIYAMaulik Borsaniya This document discusses data visualization and Matplotlib. It begins with an introduction to data visualization and its importance. It then covers basic visualization rules like labeling axes and adding titles. It discusses what Matplotlib is and how to install it. It provides examples of common plot types in Matplotlib like sine waves, scatter plots, bar charts, and pie charts. It also discusses working with data science and Pandas, including how to create Pandas Series and DataFrames from various data sources.
Introduction to Pylab and Matploitlib.
Introduction to Pylab and Matploitlib. yazad dumasia This document provides an introduction and overview of the Pylab module in Python. It discusses how Pylab is embedded in Matplotlib and provides a MATLAB-like experience for plotting and visualization. The document then provides examples of basic plotting libraries that can be used with Matplotlib like NumPy. It also demonstrates how to install Matplotlib on different operating systems like Windows, Ubuntu Linux, and CentOS Linux. Finally, it showcases various basic plot types like line plots, scatter plots, histograms, pie charts, and subplots with code examples.
Ad
More from Bruno Gonçalves (12)
RNNs for Timeseries Analysis
RNNs for Timeseries AnalysisBruno Gonçalves This document presents a comprehensive overview of recurrent neural networks (RNNs) and their applications in time series analysis, including fundamental concepts such as feedforward networks, backpropagation, and long short-term memory (LSTM) architectures. It discusses the optimization problems involved in machine learning, introduces gated recurrent units (GRUs) as a simplified alternative to LSTMs, and highlights the use of Keras for building neural network models. Practical applications of these techniques span various fields, including language modeling, speech recognition, and time series forecasting.
Blockchain Technologies for Data Science
Blockchain Technologies for Data ScienceBruno Gonçalves The document discusses the fundamentals and properties of money, highlighting the transition to cryptocurrencies such as Bitcoin. It explains the mechanisms behind blockchain technology, including transaction validation, block mining, and security features like proof of work and consensus algorithms. Additionally, it addresses the challenges faced by digital currencies, such as value stability and trust issues.
Spatio Temporal Analysis of Language use.
Spatio Temporal Analysis of Language use.Bruno Gonçalves The document discusses spatio-temporal analysis of language through various studies and examples, focusing on geolocated tweets, language detection, and regional dialects. It highlights how social media influences language distribution and the connection between geography and language variation across different locales in Latin America. Key references include studies published in PLOS ONE and the IEEE SciViz conference, illustrating language dynamics and interactions within global communication networks.
Word2vec and Friends
Word2vec and FriendsBruno Gonçalves The document discusses methods for representing words numerically through techniques like word2vec, which allows machines to understand the context and semantics of words. It explains processes such as one-hot encoding, skip-gram, and continuous bag of words for training word embeddings, as well as algorithms for updating weights and detecting linguistic shifts over time. The research also highlights applications of tracking changes in word meanings using various mediums, demonstrating the dynamic nature of language, particularly on the internet.
Word2vec in Theory Practice with TensorFlow
Word2vec in Theory Practice with TensorFlowBruno Gonçalves The document discusses the concept and implementation of word2vec, a technique for representing words numerically while preserving their semantic meanings through machine learning methods like skip-gram and continuous bag of words. It explores different algorithms, such as hierarchical softmax and negative sampling, to optimize performance and enhance training efficiency. Additionally, the document covers the use of TensorFlow for computational graphs to execute word2vec calculations and provides basic programming examples.
Word2vec and Friends
Word2vec and FriendsBruno Gonçalves The document discusses word embedding techniques such as word2vec. It explains that word2vec represents words as vectors in a way that preserves semantic meaning, such that words with similar meanings have similar vector representations. It describes how word2vec uses a neural network model to learn vector representations of words from a large corpus by predicting nearby words given a target word. The document provides details on how word2vec is trained using gradient descent to minimize the cross-entropy error. It also discusses extensions like skip-gram, continuous bag-of-words, negative sampling and hierarchical softmax.
Machine(s) Learning with Neural Networks
Machine(s) Learning with Neural NetworksBruno Gonçalves The document provides an overview of machine learning with a focus on neural networks, detailing their structure, functions, and learning processes. It discusses concepts such as supervised learning, overfitting, activation functions, forward and backward propagation, and practical applications like MNIST digit recognition. Additionally, it touches on important considerations like bias-variance tradeoff, tips for effective training, and various neural network architectures.
A practical Introduction to Machine(s) Learning
A practical Introduction to Machine(s) LearningBruno Gonçalves This document serves as a practical introduction to machine learning, covering essential statistical concepts, data analysis techniques, and various machine learning methods including supervised and unsupervised learning. Key topics discussed include the importance of data, statistical measures, clustering algorithms like k-means, and the basics of neural networks along with concepts such as bias-variance tradeoff. Additional emphasis is placed on understanding and minimizing errors in model fitting and the significance of generalization in machine learning.
Making Sense of Data Big and Small
Making Sense of Data Big and SmallBruno Gonçalves The document discusses the significance of data and statistics in various fields, emphasizing the methods of data gathering, analysis, and conclusion drawing. It highlights the role of statistics in providing insights from raw data and introduces concepts such as descriptive statistics, correlations, and Bayesian probability. The text also mentions different tools for statistical analysis and their advantages and disadvantages, while discussing practical applications like medical tests and spam detection using Naive Bayes classifiers.
Human Mobility (with Mobile Devices)
Human Mobility (with Mobile Devices)Bruno Gonçalves The document discusses the analysis of human mobility and social media interactions, primarily through Twitter data mined for geolocation and demographic insights. It emphasizes the utility of Twitter's streaming API for real-time data collection and examines patterns such as gender and race representation among users. Various coding examples and methodologies are provided for leveraging Twitter's API to gather and analyze user-generated content and behavior.
Twitterology - The Science of Twitter
Twitterology - The Science of TwitterBruno Gonçalves This document discusses Twitter data analysis and network structure. It includes summaries of research analyzing the demographics of Twitter users including gender biases towards males, age distributions that show younger users, and analyses of user geographic locations that find overrepresentation of populous areas. Network structure analyses find that a small number of popular users have many followers but follow few accounts themselves, and retweet networks spread information further than just a user's followers as tweets get shared and repeated by others not directly connected.
Mining Georeferenced Data
Mining Georeferenced DataBruno Gonçalves The document provides a comprehensive guide on mining georeferenced data using various APIs, particularly focusing on Twitter and Foursquare. It covers setting up Twitter applications, accessing geolocated tweets, and different methods for searching and streaming data, including handling user profiles and social connections. Additionally, it discusses plotting geolocated tweets and managing shapefiles for location data analysis.
Ad
Recently uploaded (20)
最新版美国约翰霍普金斯大学毕业证(JHU毕业证书)原版定制
最新版美国约翰霍普金斯大学毕业证(JHU毕业证书)原版定制Taqyea 2025原版约翰霍普金斯大学毕业证书pdf电子版【q薇1954292140】美国毕业证办理JHU约翰霍普金斯大学毕业证书多少钱?【q薇1954292140】海外各大学Diploma版本,因为疫情学校推迟发放证书、证书原件丢失补办、没有正常毕业未能认证学历面临就业提供解决办法。当遭遇挂科、旷课导致无法修满学分,或者直接被学校退学,最后无法毕业拿不到毕业证。此时的你一定手足无措,因为留学一场,没有获得毕业证以及学历证明肯定是无法给自己和父母一个交代的。
【复刻约翰霍普金斯大学成绩单信封,Buy The Johns Hopkins University Transcripts】
购买日韩成绩单、英国大学成绩单、美国大学成绩单、澳洲大学成绩单、加拿大大学成绩单(q微1954292140)新加坡大学成绩单、新西兰大学成绩单、爱尔兰成绩单、西班牙成绩单、德国成绩单。成绩单的意义主要体现在证明学习能力、评估学术背景、展示综合素质、提高录取率,以及是作为留信认证申请材料的一部分。
约翰霍普金斯大学成绩单能够体现您的的学习能力,包括约翰霍普金斯大学课程成绩、专业能力、研究能力。(q微1954292140)具体来说,成绩报告单通常包含学生的学习技能与习惯、各科成绩以及老师评语等部分,因此,成绩单不仅是学生学术能力的证明,也是评估学生是否适合某个教育项目的重要依据!
我们承诺采用的是学校原版纸张(原版纸质、底色、纹路)我们工厂拥有全套进口原装设备,特殊工艺都是采用不同机器制作,仿真度基本可以达到100%,所有成品以及工艺效果都可提前给客户展示,不满意可以根据客户要求进行调整,直到满意为止!
【主营项目】
一、工作未确定,回国需先给父母、亲戚朋友看下文凭的情况,办理毕业证|办理文凭: 买大学毕业证|买大学文凭【q薇1954292140】约翰霍普金斯大学学位证明书如何办理申请?
二、回国进私企、外企、自己做生意的情况,这些单位是不查询毕业证真伪的,而且国内没有渠道去查询国外文凭的真假,也不需要提供真实教育部认证。鉴于此,办理美国成绩单约翰霍普金斯大学毕业证【q薇1954292140】国外大学毕业证, 文凭办理, 国外文凭办理, 留信网认证
Model Evaluation & Visualisation part of a series of intro modules for data ...
Model Evaluation & Visualisation part of a series of intro modules for data ...brandonlee626749 Model Evaluation & Visualisation part of a series of intro modules for data science
Prescriptive Process Monitoring Under Uncertainty and Resource Constraints: A...
Prescriptive Process Monitoring Under Uncertainty and Resource Constraints: A...Mahmoud Shoush We introduced Black-Box Prescriptive Process Monitoring (BB-PrPM) – a reinforcement learning approach that learns when, whether, and how to intervene in business processes to boost performance under real-world constraints.
This work is presented at the International Conference on Advanced Information Systems Engineering CAiSE Conference #CAiSE2025
All the DataOps, all the paradigms .
All the DataOps, all the paradigms .Lars Albertsson Data warehouses, lakes, lakehouses, streams, fabrics, hubs, vaults, and meshes. We sometimes choose deliberately, sometimes influenced by trends, yet often get an organic blend. But the choices have orders of magnitude in impact on operations cost and iteration speed. Let's dissect the paradigms and their operational aspects once and for all.
Residential Zone 4 for industrial village
Residential Zone 4 for industrial villageMdYasinArafat13 based on assumption that failure of such a weld is by shear on the
effective area whether the shear transfer is parallel to or
perpendicular to the axis of the line of fillet weld. In fact, the
strength is greater for shear transfer perpendicular to the weld axis;
however, for simplicity the situations are treated the same.
Boost Business Efficiency with Professional Data Entry Services
Boost Business Efficiency with Professional Data Entry Serviceseloiacs eloiacs Boost Business Efficiency with Professional Data Entry Services
In today’s digital-first world, businesses generate and handle massive amounts of data every day — customer records, sales data, inventory logs, survey results, and much more. But raw data has no value unless it is well-organized, accurate, and easily accessible. That’s where professional data entry services come in.
By outsourcing data entry tasks to experts, businesses can streamline operations, reduce manual errors, and improve overall efficiency — while focusing their internal resources on core activities like growth and customer engagement.
What Are Data Entry Services?
Data entry services refer to the process of converting information from various formats (handwritten, scanned, PDF, image, or audio) into structured, digital formats such as Excel sheets, CRM databases, or cloud storage systems. This work may be done online or offline, manually or using automation tools, depending on the client’s requirements.
Popular Data Entry Services Include:
Manual data entry from paper documents or scanned files
Online data entry directly into websites, forms, or portals
Offline data entry in formats like MS Word, Excel, or custom software
Product data entry for eCommerce platforms like Shopify, Amazon, and Flipkart
Document and image conversion into editable formats
Data cleansing and validation to remove duplicates and fix errors
Remote data entry support for real-time operations
CRM and ERP data management
These services are essential for organizing business data and making it usable for analysis, reporting, and decision-making.
Who Can Benefit from Data Entry Services?
Outsourcing data entry is not limited to any one industry — it's a universal need for businesses of all types and sizes. Here are some examples:
eCommerce Businesses – For managing product catalogs, inventory updates, pricing, and customer orders.
Healthcare Providers – For digitizing patient records, prescriptions, and insurance documents.
Education Institutes – To maintain student records, exam results, and staff data.
Financial Services – For processing invoices, bank statements, transaction records.
Real Estate Companies – To handle property listings, legal paperwork, client records.
Research & Marketing Firms – To compile survey data, leads, and analytics reports.
Even startups and freelancers often require virtual data entry services to stay organized and competitive.
Top Benefits of Outsourcing Data Entry Services
Outsourcing data entry work to a professional company or virtual assistant offers multiple benefits — whether you're running a small business or managing a large enterprise.
1. Reduced Costs
Maintaining an in-house data entry team means salaries, hardware, training, and software expenses. Outsourcing eliminates these costs and provides flexible, pay-as-you-go solutions.
一比一原版(TUC毕业证书)开姆尼茨工业大学毕业证如何办理
一比一原版(TUC毕业证书)开姆尼茨工业大学毕业证如何办理taqyed 鉴于此,办理TUC大学毕业证开姆尼茨工业大学毕业证书【q薇1954292140】留学一站式办理学历文凭直通车(开姆尼茨工业大学毕业证TUC成绩单原版开姆尼茨工业大学学位证假文凭)未能正常毕业?【q薇1954292140】办理开姆尼茨工业大学毕业证成绩单/留信学历认证/学历文凭/使馆认证/留学回国人员证明/录取通知书/Offer/在读证明/成绩单/网上存档永久可查!
如果您处于以下几种情况:
◇在校期间,因各种原因未能顺利毕业……拿不到官方毕业证
◇面对父母的压力,希望尽快拿到;
◇不清楚认证流程以及材料该如何准备;
◇回国时间很长,忘记办理;
◇回国马上就要找工作,办给用人单位看;
◇企事业单位必须要求办理的
◇需要报考公务员、购买免税车、落转户口
◇申请留学生创业基金
【办理开姆尼茨工业大学成绩单Buy Technische Universität Chemnitz Transcripts】
购买日韩成绩单、英国大学成绩单、美国大学成绩单、澳洲大学成绩单、加拿大大学成绩单(q微1954292140)新加坡大学成绩单、新西兰大学成绩单、爱尔兰成绩单、西班牙成绩单、德国成绩单。成绩单的意义主要体现在证明学习能力、评估学术背景、展示综合素质、提高录取率,以及是作为留信认证申请材料的一部分。
开姆尼茨工业大学成绩单能够体现您的的学习能力,包括开姆尼茨工业大学课程成绩、专业能力、研究能力。(q微1954292140)具体来说,成绩报告单通常包含学生的学习技能与习惯、各科成绩以及老师评语等部分,因此,成绩单不仅是学生学术能力的证明,也是评估学生是否适合某个教育项目的重要依据!
Microsoft Power BI - Advanced Certificate for Business Intelligence using Pow...
Microsoft Power BI - Advanced Certificate for Business Intelligence using Pow...Prasenjit Debnath Completed Power BI - Advanced Masterclass from Skill Nation
最新版美国威斯康星大学河城分校毕业证(UWRF毕业证书)原版定制
最新版美国威斯康星大学河城分校毕业证(UWRF毕业证书)原版定制taqyea 2025原版威斯康星大学河城分校毕业证书pdf电子版【q薇1954292140】美国毕业证办理UWRF威斯康星大学河城分校毕业证书多少钱?【q薇1954292140】海外各大学Diploma版本,因为疫情学校推迟发放证书、证书原件丢失补办、没有正常毕业未能认证学历面临就业提供解决办法。当遭遇挂科、旷课导致无法修满学分,或者直接被学校退学,最后无法毕业拿不到毕业证。此时的你一定手足无措,因为留学一场,没有获得毕业证以及学历证明肯定是无法给自己和父母一个交代的。
【复刻威斯康星大学河城分校成绩单信封,Buy University of Wisconsin-River Falls Transcripts】
购买日韩成绩单、英国大学成绩单、美国大学成绩单、澳洲大学成绩单、加拿大大学成绩单(q微1954292140)新加坡大学成绩单、新西兰大学成绩单、爱尔兰成绩单、西班牙成绩单、德国成绩单。成绩单的意义主要体现在证明学习能力、评估学术背景、展示综合素质、提高录取率,以及是作为留信认证申请材料的一部分。
威斯康星大学河城分校成绩单能够体现您的的学习能力,包括威斯康星大学河城分校课程成绩、专业能力、研究能力。(q微1954292140)具体来说,成绩报告单通常包含学生的学习技能与习惯、各科成绩以及老师评语等部分,因此,成绩单不仅是学生学术能力的证明,也是评估学生是否适合某个教育项目的重要依据!
我们承诺采用的是学校原版纸张(原版纸质、底色、纹路)我们工厂拥有全套进口原装设备,特殊工艺都是采用不同机器制作,仿真度基本可以达到100%,所有成品以及工艺效果都可提前给客户展示,不满意可以根据客户要求进行调整,直到满意为止!
【主营项目】
一、工作未确定,回国需先给父母、亲戚朋友看下文凭的情况,办理毕业证|办理文凭: 买大学毕业证|买大学文凭【q薇1954292140】威斯康星大学河城分校学位证明书如何办理申请?
二、回国进私企、外企、自己做生意的情况,这些单位是不查询毕业证真伪的,而且国内没有渠道去查询国外文凭的真假,也不需要提供真实教育部认证。鉴于此,办理美国成绩单威斯康星大学河城分校毕业证【q薇1954292140】国外大学毕业证, 文凭办理, 国外文凭办理, 留信网认证
Presentation by Tariq & Mohammed (1).pptx
Presentation by Tariq & Mohammed (1).pptxAbooddSandoqaa this presenration is talking about data and analaysis and caucusus analysis of the rotten egg tommetos and viral infections
Artigo - Playing to Win.planejamento docx
Artigo - Playing to Win.planejamento docxKellyXavier15 Excelente artifo para quem está iniciando processo de aquisiçãode planejamento estratégico
Data Visualisation in data science for students
Data Visualisation in data science for studentsconfidenceascend Data visualisation is explained in a simple manner.
英国毕业证范本利物浦约翰摩尔斯大学成绩单底纹防伪LJMU学生证办理学历认证
英国毕业证范本利物浦约翰摩尔斯大学成绩单底纹防伪LJMU学生证办理学历认证 taqyed LJMU利物浦约翰摩尔斯大学毕业证书多少钱【q薇1954292140】1:1原版利物浦约翰摩尔斯大学毕业证+LJMU成绩单【q薇1954292140】完美还原海外各大学毕业材料上的工艺:水印,阴影底纹,钢印LOGO烫金烫银,LOGO烫金烫银复合重叠。文字图案浮雕、激光镭射、紫外荧光、温感、复印防伪等防伪工艺。
【主营项目】
一、工作未确定,回国需先给父母、亲戚朋友看下文凭的情况,办理毕业证|办理文凭: 买大学毕业证|买大学文凭【q薇1954292140】学位证明书如何办理申请?
二、回国进私企、外企、自己做生意的情况,这些单位是不查询毕业证真伪的,而且国内没有渠道去查询国外文凭的真假,也不需要提供真实教育部认证。鉴于此,办理利物浦约翰摩尔斯大学毕业证|LJMU成绩单【q薇1954292140】国外大学毕业证, 文凭办理, 国外文凭办理, 留信网认证
三.材料咨询办理、认证咨询办理请加学历顾问【微信:1954292140】毕业证购买指大学文凭购买,毕业证办理和文凭办理。学院文凭定制,学校原版文凭补办,扫描件文凭定做,100%文凭复刻。
Data Visualization using matplotlib
- 1. Bruno Gonçalves www.bgoncalves.com Data Visualization using matplotlib www.bgoncalves.com https://bmtgoncalves.github.io/DataVisualization/
- 2. Bruno Gonçalves www.bgoncalves.com Data Visualization using matplotlib www.bgoncalves.com https://bmtgoncalves.github.io/DataVisualization/
- 3. Bruno Gonçalves www.bgoncalves.com Data Visualization using matplotlib www.bgoncalves.com https://bmtgoncalves.github.io/DataVisualization/
- 4. www.bgoncalves.com@bgoncalves The views and opinions expressed in this article are those of the authors and do not necessarily reflect the official policy or position of my employer. The examples provided with this tutorial were chosen for their didactic value and are not mean to be representative of my day to day work. Disclaimer
- 6. www.bgoncalves.com@bgoncalves Human Perception http://abstrusegoose.com/421
- 8. www.bgoncalves.com@bgoncalves • Some cognitive tasks are significantly easier than others. In order, we are good a distinguishing: • Position, length • Direction, Angle, Area • Volume, Curvature, Shade Perception
- 9. www.bgoncalves.com@bgoncalves • Some cognitive tasks are significantly easier than others. In order, we are good a distinguishing: • Position, length • Direction, Angle, Area • Volume, Curvature, Shade • Color Saturation. Perception
- 10. www.bgoncalves.com@bgoncalves Perception • Context also matters! • An object seen in the context of larger objects will appear smaller, while in the content of smaller objects it will appear larger. • Some cognitive tasks are significantly easier than others. In order, we are good a distinguishing: • Position, length • Direction, Angle, Area • Volume, Curvature, Shade • Color Saturation.
- 11. www.bgoncalves.com@bgoncalves Perception • Context also matters! • An object seen in the context of larger objects will appear smaller, while in the content of smaller objects it will appear larger. • And we “fill in the gaps” • Some cognitive tasks are significantly easier than others. In order, we are good a distinguishing: • Position, length • Direction, Angle, Area • Volume, Curvature, Shade • Color Saturation.
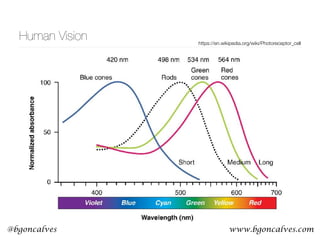
- 18. www.bgoncalves.com@bgoncalves “Who in the rainbow can draw the line where the violet tint ends and the orange tint begins? Distinctly we see the difference of the colors, but where exactly does the one first blendingly enter into the other? So with sanity and insanity.” (H. Melville) Color Perception
- 24. www.bgoncalves.com@bgoncalves Colors and Culture http://www1.icsi.berkeley.edu/wcs/
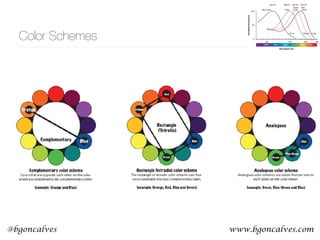
- 28. www.bgoncalves.com@bgoncalves Color Scheme Choosers http://tools.medialab.sciences-po.fr/iwanthue/
- 29. www.bgoncalves.com@bgoncalves Color Scheme Choosers http://web.colorotate.org/
- 30. www.bgoncalves.com@bgoncalves Color Scheme Choosers http://www.colourco.de/
- 31. www.bgoncalves.com@bgoncalves Color Scheme Choosers http://www.colourlovers.com/palettes
- 33. Visualization
- 34. www.bgoncalves.com@bgoncalves Fundamental Principles of Analytical Design
- 35. www.bgoncalves.com@bgoncalves Fundamental Principles of Analytical Design 1. Show comparisons, contrasts and differences 2. Show causality, mechanism, explanation and systematic structure 3. Show multivariate data: more than one or two variables 4. Completely integrate words, numbers, images and diagrams 5. Documentation 6.Content matters most of all “Information Visualization is a form of knowledge compression” D. McCandless
- 36. www.bgoncalves.com@bgoncalves Rules can be broken… …sometimes
- 37. www.bgoncalves.com@bgoncalves Fundamental tools • Points • Lines • Areas • Shapes • Colors • Text • Each for these can be used to encode a given variable to produce all the types of plots we are familiar with: • Scatter plot - Just points (line)
- 38. www.bgoncalves.com@bgoncalves Fundamental tools • Points • Lines • Areas • Shapes • Colors • Text • Each for these can be used to encode a given variable to produce all the types of plots we are familiar with: • Scatter plot - Just points (line) • Bar chart - Areas
- 39. www.bgoncalves.com@bgoncalves Fundamental tools • Points • Lines • Areas • Shapes • Colors • Text • Each for these can be used to encode a given variable to produce all the types of plots we are familiar with: • Scatter plot - Just points (line) • Bar chart - Areas • Bubble chart - Scatter plot + size + color (time)
- 40. www.bgoncalves.com@bgoncalves Fundamental tools • Points • Lines • Areas • Shapes • Colors • Text • Each for these can be used to encode a given variable to produce all the types of plots we are familiar with: • Scatter plot - Just points (line) • Bar chart - Areas • Bubble chart - Scatter plot + size + color (time) • Pie chart - Areas + colors
- 41. www.bgoncalves.com@bgoncalves Fundamental tools • Points • Lines • Areas • Shapes • Colors • Text • Each for these can be used to encode a given variable to produce all the types of plots we are familiar with: • Scatter plot - Just points (line) • Bar chart - Areas • Bubble chart - Scatter plot + size + color (time) • Pie chart - Areas + colors • etc…
- 42. Matplotlib
- 43. www.bgoncalves.com@bgoncalves Basic Plotting X Axis YAxis Line Markers Axis Label Axis Axes Matplotlib uses an object oriented structure following the same notation
- 44. www.bgoncalves.com@bgoncalves Basic Plotting • Matplotlib uses an object oriented structure following an intuitive notation • Each Axes object contains one or more Axis objects. • A Figure is a set of one or more Axes. • Each Axes is associated with exactly one Figure and each set of Markers is associated with exactly one Axes. • In other words, Markers/Lines represent a dataset that is plotted against one or more Axis. An Axes object is (effectively) a subplot of a Figure. X Y
- 45. www.bgoncalves.com@bgoncalves Basic Plotting - Programmatically! X Y
- 46. www.bgoncalves.com@bgoncalves Basic Plotting - Programmatically! https://matplotlib.org/2.0.0/ • While the Figure object controls the way in which the figure is displayed. • .gca() - Get the current Axes, creating one if necessary • .show() - Show the final figure • .savefig(“filename.ext”, dpi=300) - Save the figure to “filename.ext” where “.ext” defines the format the saved image () X Y
- 47. www.bgoncalves.com@bgoncalves Basic Plotting - Programmatically! • The first step is to import the pyplot module from matplotlib and instanciating a Figure object: • The convention is to import pyplot as plt • To create subplots (Axes) you use .subplots(nrows, ncols, sharex=False, sharey=False) instead of .figure(). set sharex and/or sharey to True to keep the same scale in both cases. • .subplots - returns a (fig, ax_lst) tuple where ax_lst is a list of Axes and fig is the Figure. • Axes have several methods of interest: • .plot(x, y) - Make a scatter or line plot from a list of x, y coordinates. • .imshow(mat) - Plot a matrix as if it were an image. Element 0,0 is plotted in the top right corner. • .bar(x, y) - Make a bar plot where x is a list of the lower left coordinates of each bar and y is the respective height. • .pie(values, labels=labels) - Produce a pie plot out of a list of values list and labeled with labels • .savefig(filename) - Write the current figure as an static image import matplotlib.pyplot as plt fig = plt.figure() X Y
- 48. www.bgoncalves.com@bgoncalves Matplotlib - decorations • The respective functions are named in an intuitive wa Every Axes object has as methods: • .set_xlabel(label) • .set_ylabel(label) • .set_title(title) • And axis limits can be set using: • .set_xlim(xmin, xmax) • .set_ylim(ymin, ymax) • Tick marks and labels are set using: • .set_xticks(ticks)/.set_yticks(ticks) • .set_xticklabels(labels)/.set_yticklabels(labels) https://matplotlib.org/2.0.0/
- 49. www.bgoncalves.com@bgoncalves Matplotlib - Images • .imshow(fig) - Display an image on a set of axes. • fig can be any matrix of numbers. • Further plotting can occur by simply using the functions described above https://matplotlib.org/2.0.0/