SlideShare a Scribd company logo
Debugging Hung Python Processes
With GDB
Brian Bouterse
Principle Software Engineer, Red Hat.
2
Who Am I?
● Python user since 2005
● Love Free and Open Source
● Principle Software Engineer with Red Hat since 2015
● Work on Pulp ( http://pulpproject.org/ )
● Contribute to several Open Source projects (Kombu, Celery)
3
Why use GDB to debug Python software?
4 http://www.developermemes.com/wp-content/uploads/2013/12/Defect-In-Production-Works-On-My-Machine.jpg
5
Why use GDB to debug Python software?
● Production application where pdb can't go
● Remote applications where rpdb isn't available
● Rarely occurring issues
● Deadlocking applications
6
Conceptual Model
CPython
Python Code
GDB Debugger
7
example.py
import os
import time
def bar():
time.sleep(30)
def foo():
print 'pid is %s' % os.getpid()
bar()
foo()
import os
import time
def bar():
time.sleep(30)
def foo():
print 'pid is %s' % os.getpid()
bar()
foo()
8
GDB Basics
● Connect to a running process: `gdb /path/to/program/ 1234`
● Connect to a running process by pid: `gdb -p <pid>`
● `c` to continue
● `Ctrl + C` to stop execution again
● `Ctrl + D` to detach (which continues)
9
Demo of basics + `bt`
10
A function call in CPython
#8 0x00007ff43137e666 in fast_function (nk=<optimized out>,
na=0, n=0, pp_stack=0x7ffd25b961a0, func=<function at remote
0x7ff43172d6e0>)
at /usr/src/debug/Python-2.7.10/Python/ceval.c:4198
#9 call_function (oparg=<optimized out>,
pp_stack=0x7ffd25b961a0) at /usr/src/debug/Python-
2.7.10/Python/ceval.c:4133
#10 PyEval_EvalFrameEx (f=f@entry=Frame 0x7ff43185fc20, for
file example.py, line 14, in <module> (),
throwflag=throwflag@entry=0)
at /usr/src/debug/Python-2.7.10/Python/ceval.c:2755
11
Calling into the kernel
#0 0x00007ff4306add43 in __select_nocancel () from
/lib64/libc.so.6
#1 0x00007ff42fe2ffc0 in floatsleep (secs=<optimized out>) at
/usr/src/debug/Python-2.7.10/Modules/timemodule.c:948
#2 time_sleep (self=<optimized out>, args=<optimized out>)
at /usr/src/debug/Python-2.7.10/Modules/timemodule.c:206
#3 0x00007ff43137e8be in call_function (oparg=<optimized
out>, pp_stack=0x7ffd25b95f40) at /usr/src/debug/Python-
2.7.10/Python/ceval.c:4112
#4 PyEval_EvalFrameEx (f=f@entry=Frame 0x7ff431738050, for
file example.py, line 6, in bar (), throwflag=throwflag@entry=0)
at /usr/src/debug/Python-2.7.10/Python/ceval.c:2755
12
Python extensions for GDB
Thanks David Malcolm (dmalcolm)
13
Python extensions for GDB
● py-list Python source (if any) in current thread and Frame
● py-bt Print a Python stack trace from the GDB stack
● py-locals Print all Python locals from current thread
● py-print Print something from python namespace
● py-up and py-down Move up and down the Python stack
14
`py-list` output of example.py
(gdb) py-list
1 import os
2 import time
3
4
5 def bar():
>6 time.sleep(30)
7
8
9 def foo():
10 print 'pid is %s' % os.getpid()
11 bar()
(gdb) py-list
1 import os
2 import time
3
4
5 def bar():
>6 time.sleep(30)
7
8
9 def foo():
10 print 'pid is %s' % os.getpid()
11 bar()
15
`py-bt` output of example.py
(gdb) py-bt
#4 Frame 0x7f12850d0050, for file example.py, line 6, in bar ()
time.sleep(30)
#7 Frame 0x7f12851f7dd0, for file example.py, line 11, in foo ()
bar()
#10 Frame 0x7f12851f7c20, for file example.py, line 14, in
<module> ()
foo()
(gdb) py-bt
#4 Frame 0x7f12850d0050, for file example.py, line 6, in bar ()
time.sleep(30)
#7 Frame 0x7f12851f7dd0, for file example.py, line 11, in foo ()
bar()
#10 Frame 0x7f12851f7c20, for file example.py, line 14, in
<module> ()
foo()
16
GDB and threads
● `info threads` Shows you information about threads in process
● Current thread is marked with *
● `thread <id>` Switches the current thread to <id>
● `thread apply all <COMMAND>` applies command to all threads
● `thread apply all py-bt`
● `thread apply all py-list`
17
Working with Core Dumps
● Generate a coredump with `gcore <pid>`
● Connect to a coredump with `gdb /path/to/program <core_file>`
18
Consider using `strace`
● trace system calls and signals
● An example call:
open("/dev/null", O_RDONLY) = 3
● An example error:
open("/foo/bar", O_RDONLY) = -1 ENOENT (No such file or directory)
19
strace demo
`strace python example.py`
20
Better Demo
21
Gotchas
● You need debuginfo libraries installed
● GDB will tell you what you need
● Your packages need to be the same as the ones gdb wants
● Optimized out Python code removes GDB's ability to see it
● Root is required to connect other user's processes
22
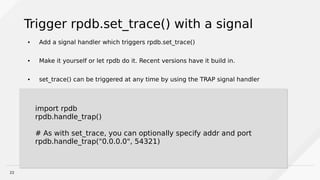
Trigger rpdb.set_trace() with a signal
● Add a signal handler which triggers rpdb.set_trace()
● Make it yourself or let rpdb do it. Recent versions have it build in.
● set_trace() can be triggered at any time by using the TRAP signal handler
import rpdb
rpdb.handle_trap()
# As with set_trace, you can optionally specify addr and port
rpdb.handle_trap("0.0.0.0", 54321)
import rpdb
rpdb.handle_trap()
# As with set_trace, you can optionally specify addr and port
rpdb.handle_trap("0.0.0.0", 54321)
23
● https://wiki.python.org/moin/DebuggingWithGdb
● https://fedoraproject.org/wiki/Features/EasierPythonDebugging
● https://sourceware.org/gdb/current/onlinedocs/gdb/Threads.html
● https://github.com/tamentis/rpdb#trigger-rpdb-with-signal
● http://bugs.python.org/issue8032
Brian Bouterse
bbouterse@redhat.com
bmbouter on freenode
References
Contact Info
Slides ->
Ad

Recommended

PDF
Trip down the GPU lane with Machine Learning
Renaldas Zioma
 
PDF
YOW2021 Computing Performance
Brendan Gregg
 
PDF
Kernel development
Nuno Martins
 
PDF
eBPF Perf Tools 2019
Brendan Gregg
 
PDF
UM2019 Extended BPF: A New Type of Software
Brendan Gregg
 
PDF
Tuning parallelcodeonsolaris005
dflexer
 
PDF
Linux kernel-rootkit-dev - Wonokaerun
idsecconf
 
PDF
Computing Performance: On the Horizon (2021)
Brendan Gregg
 
PDF
ATO Linux Performance 2018
Brendan Gregg
 
PDF
re:Invent 2019 BPF Performance Analysis at Netflix
Brendan Gregg
 
PDF
BPF Tools 2017
Brendan Gregg
 
PDF
Kernel Recipes 2019 - ftrace: Where modifying a running kernel all started
Anne Nicolas
 
PDF
Container Performance Analysis
Brendan Gregg
 
ODP
Linux kernel tracing superpowers in the cloud
Andrea Righi
 
PDF
Systems@Scale 2021 BPF Performance Getting Started
Brendan Gregg
 
PDF
Performance Wins with BPF: Getting Started
Brendan Gregg
 
PDF
Kernel Recipes 2019 - XDP closer integration with network stack
Anne Nicolas
 
PDF
Linux 4.x Tracing Tools: Using BPF Superpowers
Brendan Gregg
 
PDF
ZFSperftools2012
Brendan Gregg
 
PDF
LPC2019 BPF Tracing Tools
Brendan Gregg
 
PDF
eBPF Trace from Kernel to Userspace
SUSE Labs Taipei
 
PDF
YOW2018 Cloud Performance Root Cause Analysis at Netflix
Brendan Gregg
 
PDF
NetConf 2018 BPF Observability
Brendan Gregg
 
PDF
Tracing MariaDB server with bpftrace - MariaDB Server Fest 2021
Valeriy Kravchuk
 
PDF
BPF Internals (eBPF)
Brendan Gregg
 
PDF
LSFMM 2019 BPF Observability
Brendan Gregg
 
PDF
Kernel Recipes 2017: Performance Analysis with BPF
Brendan Gregg
 
PDF
Understanding SELinux For the Win
bmbouter
 
PPTX
Weekly news (22 – 26 nov
Nitin Kochhar
 

More Related Content

What's hot (20)

PDF
Computing Performance: On the Horizon (2021)
Brendan Gregg
 
PDF
ATO Linux Performance 2018
Brendan Gregg
 
PDF
re:Invent 2019 BPF Performance Analysis at Netflix
Brendan Gregg
 
PDF
BPF Tools 2017
Brendan Gregg
 
PDF
Kernel Recipes 2019 - ftrace: Where modifying a running kernel all started
Anne Nicolas
 
PDF
Container Performance Analysis
Brendan Gregg
 
ODP
Linux kernel tracing superpowers in the cloud
Andrea Righi
 
PDF
Systems@Scale 2021 BPF Performance Getting Started
Brendan Gregg
 
PDF
Performance Wins with BPF: Getting Started
Brendan Gregg
 
PDF
Kernel Recipes 2019 - XDP closer integration with network stack
Anne Nicolas
 
PDF
Linux 4.x Tracing Tools: Using BPF Superpowers
Brendan Gregg
 
PDF
ZFSperftools2012
Brendan Gregg
 
PDF
LPC2019 BPF Tracing Tools
Brendan Gregg
 
PDF
eBPF Trace from Kernel to Userspace
SUSE Labs Taipei
 
PDF
YOW2018 Cloud Performance Root Cause Analysis at Netflix
Brendan Gregg
 
PDF
NetConf 2018 BPF Observability
Brendan Gregg
 
PDF
Tracing MariaDB server with bpftrace - MariaDB Server Fest 2021
Valeriy Kravchuk
 
PDF
BPF Internals (eBPF)
Brendan Gregg
 
PDF
LSFMM 2019 BPF Observability
Brendan Gregg
 
PDF
Kernel Recipes 2017: Performance Analysis with BPF
Brendan Gregg
 
Computing Performance: On the Horizon (2021)
Brendan Gregg
 
ATO Linux Performance 2018
Brendan Gregg
 
re:Invent 2019 BPF Performance Analysis at Netflix
Brendan Gregg
 
BPF Tools 2017
Brendan Gregg
 
Kernel Recipes 2019 - ftrace: Where modifying a running kernel all started
Anne Nicolas
 
Container Performance Analysis
Brendan Gregg
 
Linux kernel tracing superpowers in the cloud
Andrea Righi
 
Systems@Scale 2021 BPF Performance Getting Started
Brendan Gregg
 
Performance Wins with BPF: Getting Started
Brendan Gregg
 
Kernel Recipes 2019 - XDP closer integration with network stack
Anne Nicolas
 
Linux 4.x Tracing Tools: Using BPF Superpowers
Brendan Gregg
 
ZFSperftools2012
Brendan Gregg
 
LPC2019 BPF Tracing Tools
Brendan Gregg
 
eBPF Trace from Kernel to Userspace
SUSE Labs Taipei
 
YOW2018 Cloud Performance Root Cause Analysis at Netflix
Brendan Gregg
 
NetConf 2018 BPF Observability
Brendan Gregg
 
Tracing MariaDB server with bpftrace - MariaDB Server Fest 2021
Valeriy Kravchuk
 
BPF Internals (eBPF)
Brendan Gregg
 
LSFMM 2019 BPF Observability
Brendan Gregg
 
Kernel Recipes 2017: Performance Analysis with BPF
Brendan Gregg
 

Viewers also liked (20)

PDF
Understanding SELinux For the Win
bmbouter
 
PPTX
Weekly news (22 – 26 nov
Nitin Kochhar
 
PPTX
AFFRETEMENT AERIEN SUR MESURE
KEVELAIR AFFRETEMENT
 
PPTX
วารุณี
warunee18
 
PPTX
Leading sustainability
Georgian Court University
 
PPT
Global Climate Change
Georgian Court University
 
PDF
Leverage social media to drive business the case sept 2012
SimoneVersteeg
 
PDF
Cpact09
BChange
 
PPTX
Unit 1 ch 1 3
jamiejosephson
 
PDF
20130528 solution linux_frousseau_nopain_webdev
Frank Rousseau
 
PPT
Dzejnieka laime
skaistas pagasta biblioteka
 
PPT
Tidak layak ke syurga mu
syafiehidayat
 
PPTX
Acquire land,but pay well
gaganhanda11 gaganhanda11
 
PDF
Cápsula ruby cap001
Investigador independiente
 
PPTX
[plan politika] Youth movement nowadays
Plan Politika
 
ODP
Changing the Status Quo for Small Business IT Solutions
Bilal Jaffery
 
PPTX
LEAN & GREEN Restaurants (S11)
Georgian Court University
 
PPT
Velazquez
J Luque
 
PDF
Note classical
ranil2010
 
Understanding SELinux For the Win
bmbouter
 
Weekly news (22 – 26 nov
Nitin Kochhar
 
AFFRETEMENT AERIEN SUR MESURE
KEVELAIR AFFRETEMENT
 
วารุณี
warunee18
 
Leading sustainability
Georgian Court University
 
Global Climate Change
Georgian Court University
 
Leverage social media to drive business the case sept 2012
SimoneVersteeg
 
Cpact09
BChange
 
Unit 1 ch 1 3
jamiejosephson
 
20130528 solution linux_frousseau_nopain_webdev
Frank Rousseau
 
Tidak layak ke syurga mu
syafiehidayat
 
Acquire land,but pay well
gaganhanda11 gaganhanda11
 
Cápsula ruby cap001
Investigador independiente
 
[plan politika] Youth movement nowadays
Plan Politika
 
Changing the Status Quo for Small Business IT Solutions
Bilal Jaffery
 
LEAN & GREEN Restaurants (S11)
Georgian Court University
 
Velazquez
J Luque
 
Note classical
ranil2010
 
Ad

Similar to Debugging Hung Python Processes With GDB (20)

PDF
Debugging Python with gdb
Roman Podoliaka
 
PDF
Debugging of (C)Python applications
Roman Podoliaka
 
PDF
Slides
Roman Podoliaka
 
PDF
Debugging of (C)Python applications
Roman Podoliaka
 
PPTX
Extending GDB with Python
Lisa Roach
 
PDF
Tips for Happier Python Debugging
Chun-Hao Chang
 
PPTX
Python Programming Essentials - M28 - Debugging with pdb
P3 InfoTech Solutions Pvt. Ltd.
 
PDF
GDB Rocks!
Kent Chen
 
PPTX
Introduction to the Python Debugger (pdb)
Raul Cumplido
 
PDF
Python debuggers slides
mattboehm
 
PPT
Linux Kernel Debugging
GlobalLogic Ukraine
 
PDF
Advanced Python Tutorial | Learn Advanced Python Concepts | Python Programmin...
Edureka!
 
PDF
7 strace examples to debug the execution of a program in linux
chinkshady
 
PDF
Q2.12: Debugging with GDB
Linaro
 
PDF
Debugging Python - Python Users Berlin 14.5.2020
Juha-Matti Santala
 
PPTX
Debug generic process
Vipin Varghese
 
PPTX
Staring into the eBPF Abyss
Sasha Goldshtein
 
PDF
PyParis 2017 / Writing a C Python extension in 2017, Jean-Baptiste Aviat
Pôle Systematic Paris-Region
 
PPTX
Advanced Debugging with GDB
David Khosid
 
PDF
How to write a well-behaved Python command line application
gjcross
 
Debugging Python with gdb
Roman Podoliaka
 
Debugging of (C)Python applications
Roman Podoliaka
 
Debugging of (C)Python applications
Roman Podoliaka
 
Extending GDB with Python
Lisa Roach
 
Tips for Happier Python Debugging
Chun-Hao Chang
 
Python Programming Essentials - M28 - Debugging with pdb
P3 InfoTech Solutions Pvt. Ltd.
 
GDB Rocks!
Kent Chen
 
Introduction to the Python Debugger (pdb)
Raul Cumplido
 
Python debuggers slides
mattboehm
 
Linux Kernel Debugging
GlobalLogic Ukraine
 
Advanced Python Tutorial | Learn Advanced Python Concepts | Python Programmin...
Edureka!
 
7 strace examples to debug the execution of a program in linux
chinkshady
 
Q2.12: Debugging with GDB
Linaro
 
Debugging Python - Python Users Berlin 14.5.2020
Juha-Matti Santala
 
Debug generic process
Vipin Varghese
 
Staring into the eBPF Abyss
Sasha Goldshtein
 
PyParis 2017 / Writing a C Python extension in 2017, Jean-Baptiste Aviat
Pôle Systematic Paris-Region
 
Advanced Debugging with GDB
David Khosid
 
How to write a well-behaved Python command line application
gjcross
 
Ad

Recently uploaded (20)

PDF
Oh, the Possibilities - Balancing Innovation and Risk with Generative AI.pdf
Priyanka Aash
 
PPTX
Curietech AI in action - Accelerate MuleSoft development
shyamraj55
 
PPTX
" How to survive with 1 billion vectors and not sell a kidney: our low-cost c...
Fwdays
 
PDF
Using the SQLExecutor for Data Quality Management: aka One man's love for the...
Safe Software
 
PDF
"Database isolation: how we deal with hundreds of direct connections to the d...
Fwdays
 
PDF
EIS-Webinar-Engineering-Retail-Infrastructure-06-16-2025.pdf
Earley Information Science
 
PPTX
Wenn alles versagt - IBM Tape schützt, was zählt! Und besonders mit dem neust...
Josef Weingand
 
PDF
GenAI Opportunities and Challenges - Where 370 Enterprises Are Focusing Now.pdf
Priyanka Aash
 
PDF
A Constitutional Quagmire - Ethical Minefields of AI, Cyber, and Privacy.pdf
Priyanka Aash
 
PPTX
CapCut Pro Crack For PC Latest Version {Fully Unlocked} 2025
pcprocore
 
PDF
cnc-processing-centers-centateq-p-110-en.pdf
AmirStern2
 
PDF
Coordinated Disclosure for ML - What's Different and What's the Same.pdf
Priyanka Aash
 
PDF
Quantum AI Discoveries: Fractal Patterns Consciousness and Cyclical Universes
Saikat Basu
 
PDF
Python Conference Singapore - 19 Jun 2025
ninefyi
 
PDF
From Manual to Auto Searching- FME in the Driver's Seat
Safe Software
 
PDF
Techniques for Automatic Device Identification and Network Assignment.pdf
Priyanka Aash
 
PPTX
"How to survive Black Friday: preparing e-commerce for a peak season", Yurii ...
Fwdays
 
PDF
The Future of Product Management in AI ERA.pdf
Alyona Owens
 
PPTX
UserCon Belgium: Honey, VMware increased my bill
stijn40
 
PDF
“MPU+: A Transformative Solution for Next-Gen AI at the Edge,” a Presentation...
Edge AI and Vision Alliance
 
Oh, the Possibilities - Balancing Innovation and Risk with Generative AI.pdf
Priyanka Aash
 
Curietech AI in action - Accelerate MuleSoft development
shyamraj55
 
" How to survive with 1 billion vectors and not sell a kidney: our low-cost c...
Fwdays
 
Using the SQLExecutor for Data Quality Management: aka One man's love for the...
Safe Software
 
"Database isolation: how we deal with hundreds of direct connections to the d...
Fwdays
 
EIS-Webinar-Engineering-Retail-Infrastructure-06-16-2025.pdf
Earley Information Science
 
Wenn alles versagt - IBM Tape schützt, was zählt! Und besonders mit dem neust...
Josef Weingand
 
GenAI Opportunities and Challenges - Where 370 Enterprises Are Focusing Now.pdf
Priyanka Aash
 
A Constitutional Quagmire - Ethical Minefields of AI, Cyber, and Privacy.pdf
Priyanka Aash
 
CapCut Pro Crack For PC Latest Version {Fully Unlocked} 2025
pcprocore
 
cnc-processing-centers-centateq-p-110-en.pdf
AmirStern2
 
Coordinated Disclosure for ML - What's Different and What's the Same.pdf
Priyanka Aash
 
Quantum AI Discoveries: Fractal Patterns Consciousness and Cyclical Universes
Saikat Basu
 
Python Conference Singapore - 19 Jun 2025
ninefyi
 
From Manual to Auto Searching- FME in the Driver's Seat
Safe Software
 
Techniques for Automatic Device Identification and Network Assignment.pdf
Priyanka Aash
 
"How to survive Black Friday: preparing e-commerce for a peak season", Yurii ...
Fwdays
 
The Future of Product Management in AI ERA.pdf
Alyona Owens
 
UserCon Belgium: Honey, VMware increased my bill
stijn40
 
“MPU+: A Transformative Solution for Next-Gen AI at the Edge,” a Presentation...
Edge AI and Vision Alliance
 

Debugging Hung Python Processes With GDB

  • 1. Debugging Hung Python Processes With GDB Brian Bouterse Principle Software Engineer, Red Hat.
  • 2. 2 Who Am I? ● Python user since 2005 ● Love Free and Open Source ● Principle Software Engineer with Red Hat since 2015 ● Work on Pulp ( http://pulpproject.org/ ) ● Contribute to several Open Source projects (Kombu, Celery)
  • 3. 3 Why use GDB to debug Python software?
  • 5. 5 Why use GDB to debug Python software? ● Production application where pdb can't go ● Remote applications where rpdb isn't available ● Rarely occurring issues ● Deadlocking applications
  • 7. 7 example.py import os import time def bar(): time.sleep(30) def foo(): print 'pid is %s' % os.getpid() bar() foo() import os import time def bar(): time.sleep(30) def foo(): print 'pid is %s' % os.getpid() bar() foo()
  • 8. 8 GDB Basics ● Connect to a running process: `gdb /path/to/program/ 1234` ● Connect to a running process by pid: `gdb -p <pid>` ● `c` to continue ● `Ctrl + C` to stop execution again ● `Ctrl + D` to detach (which continues)
  • 10. 10 A function call in CPython #8 0x00007ff43137e666 in fast_function (nk=<optimized out>, na=0, n=0, pp_stack=0x7ffd25b961a0, func=<function at remote 0x7ff43172d6e0>) at /usr/src/debug/Python-2.7.10/Python/ceval.c:4198 #9 call_function (oparg=<optimized out>, pp_stack=0x7ffd25b961a0) at /usr/src/debug/Python- 2.7.10/Python/ceval.c:4133 #10 PyEval_EvalFrameEx (f=f@entry=Frame 0x7ff43185fc20, for file example.py, line 14, in <module> (), throwflag=throwflag@entry=0) at /usr/src/debug/Python-2.7.10/Python/ceval.c:2755 #8 0x00007ff43137e666 in fast_function (nk=<optimized out>, na=0, n=0, pp_stack=0x7ffd25b961a0, func=<function at remote 0x7ff43172d6e0>) at /usr/src/debug/Python-2.7.10/Python/ceval.c:4198 #9 call_function (oparg=<optimized out>, pp_stack=0x7ffd25b961a0) at /usr/src/debug/Python- 2.7.10/Python/ceval.c:4133 #10 PyEval_EvalFrameEx (f=f@entry=Frame 0x7ff43185fc20, for file example.py, line 14, in <module> (), throwflag=throwflag@entry=0) at /usr/src/debug/Python-2.7.10/Python/ceval.c:2755
  • 11. 11 Calling into the kernel #0 0x00007ff4306add43 in __select_nocancel () from /lib64/libc.so.6 #1 0x00007ff42fe2ffc0 in floatsleep (secs=<optimized out>) at /usr/src/debug/Python-2.7.10/Modules/timemodule.c:948 #2 time_sleep (self=<optimized out>, args=<optimized out>) at /usr/src/debug/Python-2.7.10/Modules/timemodule.c:206 #3 0x00007ff43137e8be in call_function (oparg=<optimized out>, pp_stack=0x7ffd25b95f40) at /usr/src/debug/Python- 2.7.10/Python/ceval.c:4112 #4 PyEval_EvalFrameEx (f=f@entry=Frame 0x7ff431738050, for file example.py, line 6, in bar (), throwflag=throwflag@entry=0) at /usr/src/debug/Python-2.7.10/Python/ceval.c:2755 #0 0x00007ff4306add43 in __select_nocancel () from /lib64/libc.so.6 #1 0x00007ff42fe2ffc0 in floatsleep (secs=<optimized out>) at /usr/src/debug/Python-2.7.10/Modules/timemodule.c:948 #2 time_sleep (self=<optimized out>, args=<optimized out>) at /usr/src/debug/Python-2.7.10/Modules/timemodule.c:206 #3 0x00007ff43137e8be in call_function (oparg=<optimized out>, pp_stack=0x7ffd25b95f40) at /usr/src/debug/Python- 2.7.10/Python/ceval.c:4112 #4 PyEval_EvalFrameEx (f=f@entry=Frame 0x7ff431738050, for file example.py, line 6, in bar (), throwflag=throwflag@entry=0) at /usr/src/debug/Python-2.7.10/Python/ceval.c:2755
  • 12. 12 Python extensions for GDB Thanks David Malcolm (dmalcolm)
  • 13. 13 Python extensions for GDB ● py-list Python source (if any) in current thread and Frame ● py-bt Print a Python stack trace from the GDB stack ● py-locals Print all Python locals from current thread ● py-print Print something from python namespace ● py-up and py-down Move up and down the Python stack
  • 14. 14 `py-list` output of example.py (gdb) py-list 1 import os 2 import time 3 4 5 def bar(): >6 time.sleep(30) 7 8 9 def foo(): 10 print 'pid is %s' % os.getpid() 11 bar() (gdb) py-list 1 import os 2 import time 3 4 5 def bar(): >6 time.sleep(30) 7 8 9 def foo(): 10 print 'pid is %s' % os.getpid() 11 bar()
  • 15. 15 `py-bt` output of example.py (gdb) py-bt #4 Frame 0x7f12850d0050, for file example.py, line 6, in bar () time.sleep(30) #7 Frame 0x7f12851f7dd0, for file example.py, line 11, in foo () bar() #10 Frame 0x7f12851f7c20, for file example.py, line 14, in <module> () foo() (gdb) py-bt #4 Frame 0x7f12850d0050, for file example.py, line 6, in bar () time.sleep(30) #7 Frame 0x7f12851f7dd0, for file example.py, line 11, in foo () bar() #10 Frame 0x7f12851f7c20, for file example.py, line 14, in <module> () foo()
  • 16. 16 GDB and threads ● `info threads` Shows you information about threads in process ● Current thread is marked with * ● `thread <id>` Switches the current thread to <id> ● `thread apply all <COMMAND>` applies command to all threads ● `thread apply all py-bt` ● `thread apply all py-list`
  • 17. 17 Working with Core Dumps ● Generate a coredump with `gcore <pid>` ● Connect to a coredump with `gdb /path/to/program <core_file>`
  • 18. 18 Consider using `strace` ● trace system calls and signals ● An example call: open("/dev/null", O_RDONLY) = 3 ● An example error: open("/foo/bar", O_RDONLY) = -1 ENOENT (No such file or directory)
  • 21. 21 Gotchas ● You need debuginfo libraries installed ● GDB will tell you what you need ● Your packages need to be the same as the ones gdb wants ● Optimized out Python code removes GDB's ability to see it ● Root is required to connect other user's processes
  • 22. 22 Trigger rpdb.set_trace() with a signal ● Add a signal handler which triggers rpdb.set_trace() ● Make it yourself or let rpdb do it. Recent versions have it build in. ● set_trace() can be triggered at any time by using the TRAP signal handler import rpdb rpdb.handle_trap() # As with set_trace, you can optionally specify addr and port rpdb.handle_trap("0.0.0.0", 54321) import rpdb rpdb.handle_trap() # As with set_trace, you can optionally specify addr and port rpdb.handle_trap("0.0.0.0", 54321)
  • 23. 23 ● https://wiki.python.org/moin/DebuggingWithGdb ● https://fedoraproject.org/wiki/Features/EasierPythonDebugging ● https://sourceware.org/gdb/current/onlinedocs/gdb/Threads.html ● https://github.com/tamentis/rpdb#trigger-rpdb-with-signal ● http://bugs.python.org/issue8032 Brian Bouterse [email protected] bmbouter on freenode References Contact Info Slides ->