SlideShare a Scribd company logo
Getting your Data Out There:An Introduction to Distributed GISJohn ReiserRowan University
InstructorJohn ReiserRowan UniversityJohn is the Campus GIS Specialist for Rowan University. At Rowan, he manages the campus GIS infrastructure, develops GIS applications for campus and project use, guides curriculum and teaches GIS courses. In his spare time, he continues to be a GIS geek, developing web-based GIS projects, GPS software and contributes to the open source GIS community.
Workshop Description	This workshop is designed for those that are looking for an introduction to Internet-enabled GIS and Cloud-based GIS services. Distributed GIS relies on remote services to render maps, convert data formats, or perform geoprocessing tasks. The workshop will begin with an overview of the current options available to those looking to use and implement distributed GIS. We will then explore freely available web services from a multitude of providers. Live demonstrations of the services will be incorporated into the workshop. A discussion of implementing distributed GIS within your organization will conclude the workshop.
Workshop ObjectivesUpon completion of the workshop, students will have a greater understanding of:The newest GIS file formats and servicesPreparing your data for distributionOGC Web Service standardsAvailable GIS serversGIS-friendly content distribution networks
Workshop OutlineSection 1 – Introducing Distributed GISSection 2 – Is Distributed GIS right for you?Section 3 – Delivering your data as KMLSection 4 – Your first Web MapSection 5 – Developing your GIS ServerSection 6 – Putting the pieces togetherSection 7 – Final Thoughts
Workshop MaterialsWhile the workshop will not give you “hands on” experience, links to demos and code samples will be provided at:http://njgeo.org/macurisa2010/
Section 1Introducing Distributed GIS
What exactly is Distributed GIS?Distributed GIS is a system where components of a GIS are distributed amongst computers on a LAN or the Internet.For this workshop, we will be exploring D-GIS technology that allows you to offer your GIS data as a public-facing, Internet-based service.Distributed GIS services should allow members of the public access to your data without an interruption of your internal workflow.Distributed GIS can also provide geoprocessing tasks performed on your data to the public.
Open StandardsFor these separate pieces to work together, they must share a common language.Several common languages that are open standards supported by the Open Geospatial Consortium.You are not limited to the open standards for internal use; many systems allow for exporting or services that produce open formats.
Who uses Distributed GIS?Today, almost everyone has used a form of Distributed GIS, from generating driving directions from Google Maps to viewing aerial photography from a remote server.The days of ordering 15 DVDs of base imagery are nearly gone.The Internet has drastically changed the way we manage, process and present data.
What types of Distributed GIS are there?Using KML to distribute basic data to users through a virtual globe.Providing your data in a “slippy” web map.Providing web maps, data services and geoprocessing capabilities through a dedicated GIS server or servers.
What’s not Distributed GIS?Offering data burned to a CD or DVD. Providing GIS data for download.Don’t fall into this trap with KML data! The real power of KML comes from pulling in many data sources. It shouldn’t act as just another data format.Providing PDFs, other static maps on the Web.GeoPDF, while useful, is not Distributed GIS.
Section 2Is Distributed GIS right for you?
Is Distributed GIS right for me?	Every situation is different. If your project would benefit from any of the following, you should consider Distributed GIS:Your users are spread out across offices.
Your data is updated frequently.
Your data is often requested by the public.
Many of your clients are not familiar with GIS.
You currently use or have used ArcIMS or another Internet Mapping Service. Public and Private Distributed GISAll of the examples in the workshop today will deal with delivering data and maps to the public.You could just as easily cater your system to a specific group, or to only a handful of authorized users.We will not be discussing how to restrict access to your Distributed GIS system.
What type of Distributed GISis right for me?Want users to remix?Deliver it in KML, providing the data in the easiest form to manipulate.Need to paint a picture?Develop a web map with your cartographic styling, framing the data as you want it to be seen.Recreating a desktop GIS on the web?Deploy services using GIS server software.
What’s right for you?The correct answer is: depends on the project.Use the technology that serves your users best.Many alternatives to provide the services you choose, varying in platform, features and cost.Let’s take a look at a few of our options.
KML – it’s not just Google EarthKeyhole Markup Language is the file format developed for the Keyhole Earth Browser, predecessor to Google Earth.After purchasing Keyhole in 2004, Google greatly expanded KML’s capabilities. In 2008, the OGC declared KML 2.2 to be an open standard for geographic data.Many software packages outside of Google Earth support KML data.
Working with KMLOther than Google Earth:ArcGIS ExplorerArcGIS Desktop/ServerGoogle MapsSketchUpArc2EarthSeveral GPS utilitiesMany open source projects
Using KMLKML is a subset of XML, thus text-editable.KML stores vector data along with symbology. KML can act as a wrapper for WMS services.Network links allow you to push fresh data out to users.It’s a lightweight data format for export and distribution. It’s not going to be your native data format.
How KML is usedBecause KML is viewed in a virtual globe, your data will be in your users’ control.They may not be viewing the same data as others, as other data and base imagery may be in use.Complicated or complex data may not be suited for KML that will be presented to a general audience.
Web Maps – What’s ArcIMS?Many of you might be familiar with ArcIMS. For many years, ArcIMS was the way to deliver interactive maps across the web.Google introduced Maps in 2004, completely changing the way we think about mapping on the Web.Introduced the “slippy” map interface, where pre-rendered tiles are displayed in a draggable matrix at set zoom levels.
The Slippy Map InterfaceSmooth, intuitive panning creates a welcoming user experience.Pre-rendered tiles reduce processing overhead, while increasing storage needs.Storage is relatively cheap, compared to upgrading the processing power of a server.The experience is what is important and long wait times negatively impact that experience.It has become the standard for web maps.
Creating your own Web MapThere are several methods for creating Web Maps, however most require your own server and software.Arc2Earth allows you to generate the tiles needed from ArcGIS, and then upload them to a server.
Using Web MapsProviding a slippy style web map can help your organization provide users with a simple, easy-to-use interactive web map. Web maps can help acclimate users to your data without requiring a GIS application.Users looking for basic maps and information may turn to your map instead of a desktop GIS.Greater control over the user experience.
How Web Maps will be usedWhile the ability to manipulate the data without your knowledge is not as easy as it is with KML, your maps by their very nature will be shared across the Internet.Make sure your map is clearly depicting what you want to show and that any explanatory narrative is clear and concise.It will be hosted on your website, so it will be treated as a definitive source, on par with the actual GIS data behind the map.
Hosting Your Own ServerYour own GIS server could produce KML and web maps like the previous examples, but it can also do much more.Act as a front-end to your GIS database.Provide additional web services, such as geocoding and geoprocessing.Greater control over your clients’ experience.Requires hardware and customization.
Your GIS ServerArcGIS Server is probably the most robust offering out there today, but very costly.Roll your own using Open Source software.GeoServerTileCacheOpenLayers
Using your GIS ServerThe server can feed data to both your KML files and hosted Web Maps.The server can manage your data and provide snapshot “views” to groups of users.Geoprocessing can be executed on the server, removing the processing burden on local workstations.Can support to complement data offerings and common tasks.
How your GIS Server will be usedOnce the server is up and running, people will use it and expect it to be there when needed.Conversely, if you don’t make it easy to use, users will reject it and revert back to previous workflows (calling you, begging for maps/info)You will want to plan for redundancy, security testing, maintaining quality of service, etc.Plan big and plan to scale services as needed.
Section 3Delivering your data as KML
Your Data in KMLIf you have not yet worked with KML, you will quickly find that it is a great format for distributing data, as it includes symbology, can support raster and vector data, and can be updated over the network.There is a small learning curve for your users; many will be familiar with the format already.However, there are some issues to consider before you migrate your data to KML.
KML – Technical IssuesWhile it supports many features, not all features are as robust as in a traditional GIS and support varies among the KML viewers.Symbology is limited to outlines and fill for polygon features. Hatching and line styles are not supported.Large features (>10K vertices) are not rendered properly.Network links do not always behave.
KML – Usability IssuesWhile a desktop 3D earth browser is impressive, it’s not the right solution for all data types.If the 3D browser helps people navigate your data, all the better. If they end up getting lost, it’s not very useful.Consider creating camera viewpoints or tours, similar to bookmarks in ArcMap Documents.You can also include political boundaries in your document, allowing users to zoom to an area.
Exporting your data to KMLThere are many options for converting your existing GIS data to KML: ArcGIS Layers to KML: export from ArcMap.Online conversion services: upload a shapefile, download a KML file.Command line scripts: GDAL/OGR, Python scripts.Arc2Earth3rd party extensions to ArcGIS
Workshop ExamplesFor the purpose of this workshop, the examples assume that you have access to ArcGIS 9.3 or later.Unless specified otherwise, the examples reflect using a typical Windows XP, ArcView-level GIS configuration.
Getting Started with KMLFor this first example, we will be working with the municipalities of Atlantic County.We will add the layer to ArcMap, then use the Layer to KML tool to export the data.We will view the data in Google Earth to see how the data is modified in the conversion.
Atlantic County Municipalities
Export Layer to KML
Municipality Data in Google Earth
Initial ObservationsThe exported data appears in Google Earth at the proper location. Note that not all export tools will reproject to WGS84 automatically.The symbology is preserved from ArcGIS to Google Earth.The exported file is a .KMZ, which is a ZIP-compressed file format.Clicking on the individual polygons does not cause anything to occur. Google Earth does allow for clickable polygons.
Interactive KMLLet’s add some basic functionality to our KML data: clicking on a municipality in Google Earth will cause a balloon to pop up with attribute information.This is enabled through a Layer Properties tab introduced in ArcGIS 9.3 – HTML popup.Along with the hyperlink functionality, the HTML popup will be exported to Google Earth.
The HTML Popup Window
Configuring the HTML PopupWe will use the most basic HTML popup, a table with attribute information.We can switch field visibility off in the Fields tab if we do not want select fields in the popup.Advanced formatting is available through the use of XSLT stylesheets.
Popup in Action
Popups in Google Earth
Symbology ShortcomingsWhile configuring the HTML Popup, the symbology was changed to a dashed outline.The dashed outline did not get carried over to the KML symbology, although the color and line weight did.Keep in mind that complex data may need to be generalized to work with the limited cartographic capabilities of earth browsers.
Exporting Raster DataSimilar to the process used to export the vector municipality data to Google Earth, we can export raster data to KML.Define a custom extent to clip the exported raster to a bounding box.ArcGIS takes some liberties with resampling, so you may need to tweak settings to get the data to appear as desired.
Raster data in Google Earth
Export Multiple LayersKML supports a mix of geometry types within the same KML file. ArcGIS can export multiple layers of mixed type (point, line, polygon, raster, etc) as one KML document.We can use the Map to KML tool to export all of the layers to a KML file.
Multi-layer KML in Google Earth
Using Web Services with KMLKML has the ability to access web services natively. Most earth browsers support this capability.KML can access WMS services and bring in WMS images based on the current extent.KML supports network links, automatically downloading remote KML/KMZ files and adding them to the current list of layers.
Accessing WMSUnfortunately, WMS layers added to ArcGIS do not get exported to KML. Luckily, it’s very easy to add WMS layers within Google Earth.Save the Image Overlay (Google’s KML feature for supporting WMS) as its own KML file, so it is easy to add to other KML files.
WMS in Google Earth
Notes on Image OverlaysBy default, Google specifies that the image overlay only covers 75% of the current view extent. You will likely want to change this to a value between 1 and 1.25.The default refresh settings are to wait 4 seconds before requesting new WMS imagery. You may want to alter this for your services.
Network Overlays“If my users are already downloading the KML from my website, why do I need this?”When they download the data, they will then need to redownload to receive any updates. The network link will cause their Earth Browser to load the latest data on startup.Network link could point to a static KML or to the KML services provided by ArcGIS Server.
Simple Network ExampleWe will upload our municipalities KML to a website and note the URL.Use Google Earth to add a new Network Link to your earth browser.Save the Network Link to its own KML file.Note the small size of the Network Link file.The data will be pulled in as needed.
Serving KML OnlineWhile you could easily post a KML to your website, consider some alternative hosting options.GeoCommons, the open web mapping platform, can host your KML and a web map.Amazon Web Services can store your KML files, allowing the use of the Amazon network to distribute larger files.Depends on costs and service needs.
Complex Network LinksNetwork links can be configured to load based on the current extent.Load balance or use a CDN for larger datasets.Remember, your user will need to download the data every time, so generalized or simple data works best.
KML ReviewProvides user with an snapshot of your data.Open standard, readable by many programs.Can mix vector, raster and web services. Includes symbology information.Network links ensure users have latest data.Minimally interactive; view but not explore.Easy to produce and distribute.
Section 4Your First Web Map
Your First Web MapProviding a basic web map, similar to Google Maps, has become a simple task.The ability to generate tiles, the rendered GIS data presented to end users, is possible through many different software packages. The heavy lifting will come as you move your map from a general viewer to a specific data interface.
Basis of the TechnologyPrevious methods for generating maps on the Internet were in two forms:Render requests for any map extent and scale.Render a few static maps; provide links between.Google Maps changed this dynamic, as it publicized the “slippy map” concept.Slippy Maps are composed of square tiles rendered into a seamless map at static scales.
Spherical MercatorA new projection was developed to make web mapping easier: Spherical Mercator.A Mercator project based on a spherical datum.Not for high-precision work. Not a problem because no one should be using web maps in place of surveys.
Spherical MercatorProjection creates a square Earth, which can then be divided into square map tiles.Many GIS platforms now support this projection natively.
Map FrameworkCreating a Slippy Map requires a map framework, such as OpenLayers (JS) or Yahoo! Maps (Flash)Google offers both JS and Flash APIs.Your map framework will request the tiles from a GIS server or a tile cache.A tile cache is simply a set of static map images in a standard directory structure.
Tile CacheA tile cache can greatly improve the responsiveness of your web map.A GIS Server requires multiple connections to a DB or disk to render a map tile.A tile cache does not need active connections to your GIS data. It is “dumb” storage.While the disk storage requirements increase, the latency your users experience decreases.
Cache CreationThere are two predominate methods for populating a tile cache with map tiles.Direct: using a desktop computer to generate the tiles from a GIS, storing them locally or remotely.Intermediary: using middle-man software that passes on requests to a GIS server while creating and managing the cache.We will first look at the direct method using Arc2Earth.
Arc2EarthInitially created in 2006 by SpatialDataLogic, Arc2Earth was a tool for bringing GIS data to Google Earth.It has since evolved into a GIS swiss army knife, allowing you to move your GIS data into many new distributed formats.Can supplement your KML as well as your map tile production.
Getting Started with Arc2EarthWe will explore Arc2Earth’s tile generating capabilities using Pinelands data for Atlantic County.We will prepare our data in ArcMap, then use Arc2Earth to generate the tiles and basic web map based on our ArcMap settings.
Atlantic County Pinelands Data
Arc2Earth Interface
General Web Map Settings
Items to ConsiderYou may want to experiment with anti-aliasing, as it may improve the legibility and crispness of your maps.Transparency can be implemented within the tiles (alpha-channel PNGs) or in Javascript.Remember to include metadata for your maps.
Generating Zoom Levels
Number of LevelsYou want to render only the levels needed for your application.Number of tiles quadruple as the zoom level increases.Limit the zoom levels of your map to what is appropriate.Specify the tile ordering scheme.
Storing Your TilesArc2Earth will generate your tiles, but you must specify how they will be stored.Local copy is generated for a local cache.Upload to a cloud-based hosting service.
Hosting Your Tiles in the CloudArc2Earth can save your tiles locally, allowing you to manually set up your tile cache.Can also export into:Amazon S3 & ArcGIS.comArc2Earth managed cloud-hosting using Google.
Benefits of Cloud HostingRelying on a third-party service for hosting frees you from managing a server.Cloud hosting providers have a much larger infrastructure and capacity.Pre-built viewers remove the need for custom configuration.
Our data on ArcGIS.com
Hosted with ArcGIS.comArcGIS.com provides a framework for basic web map functionality.Service provides base map data that you would otherwise need to manage or license.Framework for desktop and mobile access.
Disadvantages of Cloud HostingIf you already have some server infrastructure in place and your expected traffic is low, you may want to consider hosting in-house.Included frameworks are not as flexible or customizable compared to hosted services.Security of data – facilities & infrastructurePurchasing outside software/services can be difficult in government.
Final Thoughts on Arc2EarthEasiest way to build tiles without a dedicated server. No need to manage server infrastructure as you rely on Amazon/Google.Very useful for generating KML files that may not export well using ESRI’s built-in tool.Can create SLD files for use on your own open source GIS server.Costs money for additional features; closed source.
Section 5Developing Your GIS Server
Developing your GIS ServerA GIS Server can be relatively simple, providing file or database storage while serving data through the intranet or Web.A GIS Server can be run on one workstation or on a cluster of servers.Your ultimate configuration depends on your needs, budget, and level of know-how.
Assumptions MadeWhile we will discuss GIS Servers in general terms, we will focus on a few software offerings.The software in this workshop is open source, feature rich, well-documented, and relatively straightforward to install and manage.While it may not be the right fit for you, what we discuss today you should be able to try at home with your time being the only cost.
Technologies UsedGeoServerA Java-based OGC-compliant, WFS-T capable GIS Server. Handles data and map rendering.TileCache & OpenLayersEnables you to host your own “slippy” maps.PostgreSQL & PostGISOpen source GIS database technology. Compatible with ArcSDE.
Technologies UsedGeoServer, TileCache, and PostgreSQL can be switched out for similar software.However, this configuration works with minimal tweaking required.All are open source and freely available.All run on Linux, Mac OS X and Windows.Each has their own dedicated support community and options for purchased support.
GeoServerBased on the GeoTools Java toolkit.Standards compliant & arguably the easiest server platform to incorporate into other GIS systems and products.Java Servlet technology; can run in a container or standalone.Simple to install (binaries available) and manage. Web-based user interface.
GeoServer.org
Open Source SupportBefore we proceed, it should be stated that open source software is not “fix it yourself.”Many organization are hesitant to use open source for “enterprise” level applications due to the perceived lack of support.OpenGeo is the developer behind Geoserver.While open source, OpenGeo provides technical support and custom development to users of GeoServer.
OpenGeo.org
GeoServer ConfigurationMost features managed through a web interface.GeoServer is undoubtedly one of the easiest GIS servers to deploy.Upload data to server, then point-and-click configuration.Symbology defined using Styled Layer Descriptors (SLD).
GeoServer InstallationDeploy as WAR from within a servlet containerInstall stand-alone.May need to install some dependencies for additional features.GDAL/OGRPlugins
Post-InstallLog in to your server via a web interface.If installing on your own Windows desktop, it’s simply http://localhost:8080/geoserver/webFrom there, you can add data to the server, configure layers to serve, access service capabilities and much more.
Your Installation Homepage
List of Layers Available
Styled Layer DescriptorsSLDs are used to define symbology in GeoServer and in other open source projects.Is an OGC open format. Subset of WMS.You can define several SLDs to be used with a data layer, and give the option for the user to switch between them.Edit SLDs from GeoServer web interface.
GeoServer’s Built-in SLD Editor
Yes, SLDs are XMLSLDs are very powerful, but not user-friendly.A GUI editor for SLDs within GeoServer is under development.Part of the GeoExt project for web GIS interfaces in JavaScript.
SLD CookbookGeoServer’s documentation covers frequently-desired cartographic effects implemented with SLDs.Also available is an SLD reference, that includes notes on vendor-specific (GeoServer only) features.
Now What?Now that you have your data in your server, what can you do with it?Serve the data to users via WMS or WFS, allowing ArcGIS Desktop users access.Serve the data to users through a website.
ArcGIS WMS & WFS AccessArcGIS allows for direct access to WMS services.Under “GIS Servers” select Add New WMSEnter the URL to your server. Use the WMS link on the homepage.NJ’s aerial photography is available through WMS.
WMS Layers in ArcMap
Getting Started with Web MapsOn your organization’s website, you can create a page that uses the OpenLayers JavaScript library to create a slippy map on a page of your choosing.You can also install TileCache to speed up the rendering of the slippy map.Warning: some programming ahead!
OpenLayersA JavaScript library for implementing slippy-style web maps.Originally developed by MetaCarta, then became an OSGeo project.Open source and no cost.Can interface with WMS services as well as ArcGIS Server.
Why not Google Maps?While the Google Maps API seems ubiquitous, there are limitations that may impact your use.While free at first, Google will charge for high-traffic sites using its API.Version 2 is deprecated and they are going to turn it off eventually.Cannot be used on your intranet. All pages using the API must be public.
Using OpenLayersOpenLayers provides the same basic functionality as Google Maps. Additional functionality such as in-map editing of vector features, easy configuration of custom projections, etc.If you’re familiar with the Google Maps API, OpenLayers should be an easy transition.OpenLayers does not come with base maps; provide your own or use Google, Bing, Yahoo!
Entirely Your OwnWhile you may want to use Google/Bing as a base map, using their APIs may restrict you from tailoring the application to your users.You can host your own copy of OpenLayers and modify it as neededFrom the map functionality through to the user interface, the API is customizable.
OpenLayers Exampleshttp://openlayers.org/dev/examples/
Starting from ExampleOne of the OpenLayers examples is a basic web map using a WMS service for the map tiles. We can copy that example to our own website and replace the example WMS URL with our own.Change the starting coordinates and zoom level and we’re off!
Example from OpenLayers
Changing the Example
Additional FunctionalityOpenLayers or Google Maps are the frameworks for developing custom interactions with the maps and data.OpenLayers even has code for manipulating vector data; modifying vertices in a feature.Additional functionality is performed server side, such as spatial or network analysis.Your server must be able to support those functions.
TileCachehttp://tilecache.org/
TileCacheOnce your web mapping application is nearing release, you should consider taking steps to optimize your users’ experience.Caching map tiles will improve overall rendering speeds.Increased storage costs, but reduced CPU & DB demands as you are no longer rendering repeatedly from GIS data.
IntermediaryTileCache sits between your interface and your rendering engine.It handles WMS requests, so your interface can continue to use the same request methods.WMS requests that have not been cached are passed along to the rendering engine, then stored when returned to the interface.Caches can be pre-rendered or rendered as needed.
Caching On-The-FlyWeb MapGIS ServerTileCacheCacheMap Tile does not exist:Rendered then stored.Web MapGIS ServerTileCacheCacheMap Tile does exist:Pre-rendered tile returned.
Configuring TileCacheTileCache is written in Python and can run on most modern platforms with minimal configuration.Define layers to be cached using a text-based configuration file.WMS ServiceConfigured for use in a Google-style mashup.
Pieces In PlaceWe now have the pieces to develop our own Distributed GIS system.GeoServer– rendering and processing our GIS dataOpenLayers –providing a map interface in a web browserTileCache –optimizing delivery of map data
Section 6Putting The Pieces Together
Your Distributed GISWe have covered the various options available to move your data into a Distributed GIS.Not every tool will work for you, but one or more may be a part of your Distributed GIS.Let’s take a look at a few examples of Distributed GIS systems and see how they are implemented.
National Weather ServiceThe NWS uses KML to distribute weather updates, advisories and radar/satellite imagery.The KML files use network links, allowing for automatic refreshing of the weather data.Weather data is always changing and the interface has to suit a general audience.
Rowan’s Land Change ViewerBuilt as a part of the ongoing “Changing Landscapes of the Garden State” research jointly conducted by Rowan & Rutgers.Series of animated web maps showing changes in land use in New Jersey over 21 years.Developed using a multiple Distributed GIS technologies and distributed across the Web.
Distributed Land Change Viewer
Distributed Land Change ViewerLand Change ViewerGoogle MapsBase MapsBing MapsBird’s EyeCloudFrontGeoServerAmazon S3TileCache
Land Change ViewerThe Land Change Viewer relies on a mix of hosted and cloud-based services.GeoServer was used to render the Land Use data for the entire state.TileCache generated local and S3-based map tile caches for the interactive maps.Amazon S3 was used to store the production map tiles & CloudFront to distribute.
Tile CreationBy using CloudFront to distribute the map tiles using Amazon’s infrastructure, we needed to pre-build our cache.Map tiles were limited to zoom level 8 (all of NJ) through 15 (small town/neighborhood scale)Tile rendering had to begin well in advance of the release date.
Tile MathFor the extent of NJ, zoom levels 8-15, approximately 60,000 tiles needed to be created.Each animation frame was one set of tiles.Approximately 1.5 million tiles had to be generated.
Land Change ViewerAfter testing other possible implementation strategies, we selected a JS-based web map.Authoring the JS, configuring the server and rendering the tiles took about 4 weeks.Distributed GIS allows the user interface to be quick and responsive.More on the NJ Land Change Viewer at the MAC URISA Interactive Expo.
Section 7Final Thoughts
Just the Beginning…While we covered many different technologies and topics, this is just a preview of the new direction GIS is heading.Distributed GIS has been around for several years, but it has never been as easy or available to smaller firms and groups as it is today.
Implementing Your GISWhile the goals of your individual organizations vary, informing the public is likely a common goal.A Distributed GIS system can help you in delivering your data while also making it easier for the public to access and understand.The key is finding the right mix of technology to achieve that goal.
Available TechnologyArcGIS ServerCloudServicesArcGIS.comServersGoogle AppEngineFME 2010GeoServerAmazon AWSERDAS ApolloWindows AzureMapServerChange Components To Suit Your NeedsBing MapsYahoo! MapsMapnikArc2EarthGoogle MapsESRI JS & FlexMap TileCreationInterfaceAPIsOpenLayersTileCacheGeoMooseMapstractionPolyMapsGeoEXTGeoWebCache
Ad

Recommended

PPTX
gis project planning and management
Abhiram Kanigolla
 
PDF
An introduction to geographic information systems (gis) m goulbourne 2007
Michelle Goulbourne @ DiaMind Health
 
PPTX
Georeferencing Image
Simran Vats
 
PPT
Open Source GIS
Joe Larson
 
PDF
Spatial data analysis 1
Johan Blomme
 
PPTX
Digital Image Classification.pptx
Hline Win
 
PPTX
Remote sensing technology and applications
Shyam Sundar Roy
 
PPTX
Geographic coordinate system & map projection
vishalkedia119
 
PPTX
Raster data analysis
Abdul Raziq
 
PPT
Geodatabases
John Reiser
 
PPTX
Spatial analysis and modeling
Tolasa_F
 
PPSX
Geographical information system unit 1
WE-IT TUTORIALS
 
PPTX
Introduction to gis and arc gis
Saad Raja
 
PPT
Digital image processing 1
Dhaval Jalalpara
 
PPTX
Introduction to gis
Habibur Rahman
 
PDF
Network analysis in gis , part 4 transportation networks
Department of Applied Geology
 
PDF
Arc gis introduction-ppt
Ashok Peddi
 
PDF
Raster
esambale
 
PDF
Network analysis in gis , part 1 introduction
Department of Applied Geology
 
PPTX
DATA in GIS and DATA Query
KU Leuven
 
PDF
Network analysis in gis , part 3 utility network
Department of Applied Geology
 
PPT
Chap1 introduction to geographic information system (gis)
Mweemba Hachita
 
PDF
Modern cartography
Institut Cartogràfic de Catalunya
 
PPTX
Symbology and Classifying data in ARC GIS
KU Leuven
 
PPTX
Geographical Information System (GIS)
Malla Reddy University
 
PPTX
Urban Sprawl for modelling using GIS
pankaj kumar
 
PPTX
Digital photogrammetry
Mr Amol Ghogare
 
PDF
Lecture+12+topology+2013 (3)
Mei Chi Lo
 
PDF
Doing more with SQL
John Reiser
 
PPT
GIS Data Types
John Reiser
 

More Related Content

What's hot (20)

PPTX
Raster data analysis
Abdul Raziq
 
PPT
Geodatabases
John Reiser
 
PPTX
Spatial analysis and modeling
Tolasa_F
 
PPSX
Geographical information system unit 1
WE-IT TUTORIALS
 
PPTX
Introduction to gis and arc gis
Saad Raja
 
PPT
Digital image processing 1
Dhaval Jalalpara
 
PPTX
Introduction to gis
Habibur Rahman
 
PDF
Network analysis in gis , part 4 transportation networks
Department of Applied Geology
 
PDF
Arc gis introduction-ppt
Ashok Peddi
 
PDF
Raster
esambale
 
PDF
Network analysis in gis , part 1 introduction
Department of Applied Geology
 
PPTX
DATA in GIS and DATA Query
KU Leuven
 
PDF
Network analysis in gis , part 3 utility network
Department of Applied Geology
 
PPT
Chap1 introduction to geographic information system (gis)
Mweemba Hachita
 
PDF
Modern cartography
Institut Cartogràfic de Catalunya
 
PPTX
Symbology and Classifying data in ARC GIS
KU Leuven
 
PPTX
Geographical Information System (GIS)
Malla Reddy University
 
PPTX
Urban Sprawl for modelling using GIS
pankaj kumar
 
PPTX
Digital photogrammetry
Mr Amol Ghogare
 
PDF
Lecture+12+topology+2013 (3)
Mei Chi Lo
 
Raster data analysis
Abdul Raziq
 
Geodatabases
John Reiser
 
Spatial analysis and modeling
Tolasa_F
 
Geographical information system unit 1
WE-IT TUTORIALS
 
Introduction to gis and arc gis
Saad Raja
 
Digital image processing 1
Dhaval Jalalpara
 
Introduction to gis
Habibur Rahman
 
Network analysis in gis , part 4 transportation networks
Department of Applied Geology
 
Arc gis introduction-ppt
Ashok Peddi
 
Raster
esambale
 
Network analysis in gis , part 1 introduction
Department of Applied Geology
 
DATA in GIS and DATA Query
KU Leuven
 
Network analysis in gis , part 3 utility network
Department of Applied Geology
 
Chap1 introduction to geographic information system (gis)
Mweemba Hachita
 
Symbology and Classifying data in ARC GIS
KU Leuven
 
Geographical Information System (GIS)
Malla Reddy University
 
Urban Sprawl for modelling using GIS
pankaj kumar
 
Digital photogrammetry
Mr Amol Ghogare
 
Lecture+12+topology+2013 (3)
Mei Chi Lo
 

Viewers also liked (20)

PDF
Doing more with SQL
John Reiser
 
PPT
GIS Data Types
John Reiser
 
PPTX
Принципы и методы координатной привязки и трансформирование снимков в ГИС-пак...
Deportament international cooperation
 
PDF
Sql for Everything: GIS on the Web
Bill Morris
 
PPT
Ocean Globe, Ocean Geospatial Appliance
High Tech Maui
 
PDF
Image to sketch effect Step by Step Photoshop Tutorial
Web D School
 
PDF
How to Install Fonts in Photoshop
Metrodesk
 
PPT
Russian Revolution Part 3
Joseph Fuertsch
 
PPTX
Week 2 base map
Ryan Stechschulte
 
PPTX
Internet-enabled GIS - Spring 2011
John Reiser
 
PPTX
New Jersey Land Change Viewer
John Reiser
 
PDF
Processing and integrating soil map information from different regions into C...
FAO
 
PPT
Vietnam johnson takes over
Joseph Fuertsch
 
PPT
Internet-enabled GIS for Planners
John Reiser
 
PPT
Red Eye Removal Photoshop Tutorial
snshnangel04
 
PPT
The Great War
Bradley Bergey
 
PPTX
Building a semantic-based decision support system to optimize the energy use ...
Gonçal Costa Jutglar
 
PDF
6th Grade Social Studies Ancient Engineering
Aaron Maurer
 
PPT
War in korea
Joseph Fuertsch
 
PDF
Photoshop tutorial
Mahidi Hasan
 
Doing more with SQL
John Reiser
 
GIS Data Types
John Reiser
 
Принципы и методы координатной привязки и трансформирование снимков в ГИС-пак...
Deportament international cooperation
 
Sql for Everything: GIS on the Web
Bill Morris
 
Ocean Globe, Ocean Geospatial Appliance
High Tech Maui
 
Image to sketch effect Step by Step Photoshop Tutorial
Web D School
 
How to Install Fonts in Photoshop
Metrodesk
 
Russian Revolution Part 3
Joseph Fuertsch
 
Week 2 base map
Ryan Stechschulte
 
Internet-enabled GIS - Spring 2011
John Reiser
 
New Jersey Land Change Viewer
John Reiser
 
Processing and integrating soil map information from different regions into C...
FAO
 
Vietnam johnson takes over
Joseph Fuertsch
 
Internet-enabled GIS for Planners
John Reiser
 
Red Eye Removal Photoshop Tutorial
snshnangel04
 
The Great War
Bradley Bergey
 
Building a semantic-based decision support system to optimize the energy use ...
Gonçal Costa Jutglar
 
6th Grade Social Studies Ancient Engineering
Aaron Maurer
 
War in korea
Joseph Fuertsch
 
Photoshop tutorial
Mahidi Hasan
 
Ad

Similar to Getting your Data Out There: An Introduction to Distributed GIS (20)

PPT
Geospatial Web
hchen1
 
PPTX
Internet-enabled GIS Using Free and Open Source Tools
John Reiser
 
PDF
Spatial Data, KML, and the University Web
Glennon Alan
 
PDF
Saving Money with Open Source GIS
bryanluman
 
PPT
Sept 9 Lecture: Course Introduction
Michael Maclennan
 
PDF
Geokov
Cybera Inc.
 
PDF
Agi08 Jeremy Morley
Jeremy Morley
 
PPT
My GIS Timeline
jeffhobbs
 
PPTX
Building Community Information Systems with Drupal and Open Layers Rev2
Charles Burnett
 
PDF
Cartography and Web GIS - Jack Dangermond
British Cartographic Society
 
PPTX
Comprehensive Overview of the Geoweb
Government/CU Denver
 
PDF
Arnold webuquerque20110302
lisaarn
 
PPT
Not Just Dots on a Map: How Geography Influences Real World Decisions Part 2
American Public Gardens Association
 
PPT
Dotted Eyes - Open Software, Standards and Data
Dotted Eyes
 
PPTX
Display Billions of Pixels on the Web
zosim26
 
PDF
This is not your grandmother's online map: Advancing your mission with GIS tools
Chicago Technology Cooperative
 
PDF
Mapping
David Trengove
 
PPT
Evolution of GIS Technologies in a Web 2.0
pdscomp
 
PDF
NCGIC The Geospatial Revolution
Peter Batty
 
Geospatial Web
hchen1
 
Internet-enabled GIS Using Free and Open Source Tools
John Reiser
 
Spatial Data, KML, and the University Web
Glennon Alan
 
Saving Money with Open Source GIS
bryanluman
 
Sept 9 Lecture: Course Introduction
Michael Maclennan
 
Geokov
Cybera Inc.
 
Agi08 Jeremy Morley
Jeremy Morley
 
My GIS Timeline
jeffhobbs
 
Building Community Information Systems with Drupal and Open Layers Rev2
Charles Burnett
 
Cartography and Web GIS - Jack Dangermond
British Cartographic Society
 
Comprehensive Overview of the Geoweb
Government/CU Denver
 
Arnold webuquerque20110302
lisaarn
 
Not Just Dots on a Map: How Geography Influences Real World Decisions Part 2
American Public Gardens Association
 
Dotted Eyes - Open Software, Standards and Data
Dotted Eyes
 
Display Billions of Pixels on the Web
zosim26
 
This is not your grandmother's online map: Advancing your mission with GIS tools
Chicago Technology Cooperative
 
Evolution of GIS Technologies in a Web 2.0
pdscomp
 
NCGIC The Geospatial Revolution
Peter Batty
 
Ad

More from John Reiser (20)

PPTX
Python and GIS: Improving Your Workflow
John Reiser
 
PDF
Habitat Change Analysis Project
John Reiser
 
PPTX
Using Dashboards to Understand Spatial Data
John Reiser
 
PDF
Python Programming and GIS
John Reiser
 
PDF
NJ MAP: Building a different kind of GIS platform using open source tools.
John Reiser
 
PPTX
Portfolio Workshop
John Reiser
 
PPTX
GIS Day at BCC 2012
John Reiser
 
PPTX
Mapping the Human Environment
John Reiser
 
PPTX
NJAPPA 2012 - Campus Facilities
John Reiser
 
PPTX
Mapping the Way - ESRI EdUC 2011
John Reiser
 
PPTX
Going Mobile with HTML5
John Reiser
 
PPTX
GIS & Facilities - NJAPPA Talk - April 26 2012
John Reiser
 
PPTX
Introduction to 3D Data
John Reiser
 
PPTX
GPS - Fall 2011
John Reiser
 
PPTX
Data Models - GIS I
John Reiser
 
PPTX
Mapping the Way
John Reiser
 
PPT
Network Analysis in ArcGIS
John Reiser
 
PPTX
Classification Systems
John Reiser
 
PPTX
Measurement and Scale
John Reiser
 
PPTX
Map Projections
John Reiser
 
Python and GIS: Improving Your Workflow
John Reiser
 
Habitat Change Analysis Project
John Reiser
 
Using Dashboards to Understand Spatial Data
John Reiser
 
Python Programming and GIS
John Reiser
 
NJ MAP: Building a different kind of GIS platform using open source tools.
John Reiser
 
Portfolio Workshop
John Reiser
 
GIS Day at BCC 2012
John Reiser
 
Mapping the Human Environment
John Reiser
 
NJAPPA 2012 - Campus Facilities
John Reiser
 
Mapping the Way - ESRI EdUC 2011
John Reiser
 
Going Mobile with HTML5
John Reiser
 
GIS & Facilities - NJAPPA Talk - April 26 2012
John Reiser
 
Introduction to 3D Data
John Reiser
 
GPS - Fall 2011
John Reiser
 
Data Models - GIS I
John Reiser
 
Mapping the Way
John Reiser
 
Network Analysis in ArcGIS
John Reiser
 
Classification Systems
John Reiser
 
Measurement and Scale
John Reiser
 
Map Projections
John Reiser
 

Recently uploaded (20)

PDF
cnc-processing-centers-centateq-p-110-en.pdf
AmirStern2
 
PDF
9-1-1 Addressing: End-to-End Automation Using FME
Safe Software
 
PDF
Using the SQLExecutor for Data Quality Management: aka One man's love for the...
Safe Software
 
PDF
Quantum AI Discoveries: Fractal Patterns Consciousness and Cyclical Universes
Saikat Basu
 
PDF
Coordinated Disclosure for ML - What's Different and What's the Same.pdf
Priyanka Aash
 
PPTX
Wenn alles versagt - IBM Tape schützt, was zählt! Und besonders mit dem neust...
Josef Weingand
 
PPTX
You are not excused! How to avoid security blind spots on the way to production
Michele Leroux Bustamante
 
PDF
ReSTIR [DI]: Spatiotemporal reservoir resampling for real-time ray tracing ...
revolcs10
 
PDF
Python Conference Singapore - 19 Jun 2025
ninefyi
 
PDF
2025_06_18 - OpenMetadata Community Meeting.pdf
OpenMetadata
 
PDF
Cracking the Code - Unveiling Synergies Between Open Source Security and AI.pdf
Priyanka Aash
 
PDF
From Manual to Auto Searching- FME in the Driver's Seat
Safe Software
 
PDF
Hyderabad MuleSoft In-Person Meetup (June 21, 2025) Slides
Ravi Tamada
 
PPTX
CapCut Pro Crack For PC Latest Version {Fully Unlocked} 2025
pcprocore
 
PDF
10 Key Challenges for AI within the EU Data Protection Framework.pdf
Priyanka Aash
 
PDF
PyCon SG 25 - Firecracker Made Easy with Python.pdf
Muhammad Yuga Nugraha
 
PDF
"Scaling in space and time with Temporal", Andriy Lupa.pdf
Fwdays
 
PDF
The Growing Value and Application of FME & GenAI
Safe Software
 
PDF
Oh, the Possibilities - Balancing Innovation and Risk with Generative AI.pdf
Priyanka Aash
 
PDF
“MPU+: A Transformative Solution for Next-Gen AI at the Edge,” a Presentation...
Edge AI and Vision Alliance
 
cnc-processing-centers-centateq-p-110-en.pdf
AmirStern2
 
9-1-1 Addressing: End-to-End Automation Using FME
Safe Software
 
Using the SQLExecutor for Data Quality Management: aka One man's love for the...
Safe Software
 
Quantum AI Discoveries: Fractal Patterns Consciousness and Cyclical Universes
Saikat Basu
 
Coordinated Disclosure for ML - What's Different and What's the Same.pdf
Priyanka Aash
 
Wenn alles versagt - IBM Tape schützt, was zählt! Und besonders mit dem neust...
Josef Weingand
 
You are not excused! How to avoid security blind spots on the way to production
Michele Leroux Bustamante
 
ReSTIR [DI]: Spatiotemporal reservoir resampling for real-time ray tracing ...
revolcs10
 
Python Conference Singapore - 19 Jun 2025
ninefyi
 
2025_06_18 - OpenMetadata Community Meeting.pdf
OpenMetadata
 
Cracking the Code - Unveiling Synergies Between Open Source Security and AI.pdf
Priyanka Aash
 
From Manual to Auto Searching- FME in the Driver's Seat
Safe Software
 
Hyderabad MuleSoft In-Person Meetup (June 21, 2025) Slides
Ravi Tamada
 
CapCut Pro Crack For PC Latest Version {Fully Unlocked} 2025
pcprocore
 
10 Key Challenges for AI within the EU Data Protection Framework.pdf
Priyanka Aash
 
PyCon SG 25 - Firecracker Made Easy with Python.pdf
Muhammad Yuga Nugraha
 
"Scaling in space and time with Temporal", Andriy Lupa.pdf
Fwdays
 
The Growing Value and Application of FME & GenAI
Safe Software
 
Oh, the Possibilities - Balancing Innovation and Risk with Generative AI.pdf
Priyanka Aash
 
“MPU+: A Transformative Solution for Next-Gen AI at the Edge,” a Presentation...
Edge AI and Vision Alliance
 

Getting your Data Out There: An Introduction to Distributed GIS

  • 1. Getting your Data Out There:An Introduction to Distributed GISJohn ReiserRowan University
  • 2. InstructorJohn ReiserRowan UniversityJohn is the Campus GIS Specialist for Rowan University. At Rowan, he manages the campus GIS infrastructure, develops GIS applications for campus and project use, guides curriculum and teaches GIS courses. In his spare time, he continues to be a GIS geek, developing web-based GIS projects, GPS software and contributes to the open source GIS community.
  • 3. Workshop Description This workshop is designed for those that are looking for an introduction to Internet-enabled GIS and Cloud-based GIS services. Distributed GIS relies on remote services to render maps, convert data formats, or perform geoprocessing tasks. The workshop will begin with an overview of the current options available to those looking to use and implement distributed GIS. We will then explore freely available web services from a multitude of providers. Live demonstrations of the services will be incorporated into the workshop. A discussion of implementing distributed GIS within your organization will conclude the workshop.
  • 4. Workshop ObjectivesUpon completion of the workshop, students will have a greater understanding of:The newest GIS file formats and servicesPreparing your data for distributionOGC Web Service standardsAvailable GIS serversGIS-friendly content distribution networks
  • 5. Workshop OutlineSection 1 – Introducing Distributed GISSection 2 – Is Distributed GIS right for you?Section 3 – Delivering your data as KMLSection 4 – Your first Web MapSection 5 – Developing your GIS ServerSection 6 – Putting the pieces togetherSection 7 – Final Thoughts
  • 6. Workshop MaterialsWhile the workshop will not give you “hands on” experience, links to demos and code samples will be provided at:http://njgeo.org/macurisa2010/
  • 8. What exactly is Distributed GIS?Distributed GIS is a system where components of a GIS are distributed amongst computers on a LAN or the Internet.For this workshop, we will be exploring D-GIS technology that allows you to offer your GIS data as a public-facing, Internet-based service.Distributed GIS services should allow members of the public access to your data without an interruption of your internal workflow.Distributed GIS can also provide geoprocessing tasks performed on your data to the public.
  • 9. Open StandardsFor these separate pieces to work together, they must share a common language.Several common languages that are open standards supported by the Open Geospatial Consortium.You are not limited to the open standards for internal use; many systems allow for exporting or services that produce open formats.
  • 10. Who uses Distributed GIS?Today, almost everyone has used a form of Distributed GIS, from generating driving directions from Google Maps to viewing aerial photography from a remote server.The days of ordering 15 DVDs of base imagery are nearly gone.The Internet has drastically changed the way we manage, process and present data.
  • 11. What types of Distributed GIS are there?Using KML to distribute basic data to users through a virtual globe.Providing your data in a “slippy” web map.Providing web maps, data services and geoprocessing capabilities through a dedicated GIS server or servers.
  • 12. What’s not Distributed GIS?Offering data burned to a CD or DVD. Providing GIS data for download.Don’t fall into this trap with KML data! The real power of KML comes from pulling in many data sources. It shouldn’t act as just another data format.Providing PDFs, other static maps on the Web.GeoPDF, while useful, is not Distributed GIS.
  • 13. Section 2Is Distributed GIS right for you?
  • 14. Is Distributed GIS right for me? Every situation is different. If your project would benefit from any of the following, you should consider Distributed GIS:Your users are spread out across offices.
  • 15. Your data is updated frequently.
  • 16. Your data is often requested by the public.
  • 17. Many of your clients are not familiar with GIS.
  • 18. You currently use or have used ArcIMS or another Internet Mapping Service. Public and Private Distributed GISAll of the examples in the workshop today will deal with delivering data and maps to the public.You could just as easily cater your system to a specific group, or to only a handful of authorized users.We will not be discussing how to restrict access to your Distributed GIS system.
  • 19. What type of Distributed GISis right for me?Want users to remix?Deliver it in KML, providing the data in the easiest form to manipulate.Need to paint a picture?Develop a web map with your cartographic styling, framing the data as you want it to be seen.Recreating a desktop GIS on the web?Deploy services using GIS server software.
  • 20. What’s right for you?The correct answer is: depends on the project.Use the technology that serves your users best.Many alternatives to provide the services you choose, varying in platform, features and cost.Let’s take a look at a few of our options.
  • 21. KML – it’s not just Google EarthKeyhole Markup Language is the file format developed for the Keyhole Earth Browser, predecessor to Google Earth.After purchasing Keyhole in 2004, Google greatly expanded KML’s capabilities. In 2008, the OGC declared KML 2.2 to be an open standard for geographic data.Many software packages outside of Google Earth support KML data.
  • 22. Working with KMLOther than Google Earth:ArcGIS ExplorerArcGIS Desktop/ServerGoogle MapsSketchUpArc2EarthSeveral GPS utilitiesMany open source projects
  • 23. Using KMLKML is a subset of XML, thus text-editable.KML stores vector data along with symbology. KML can act as a wrapper for WMS services.Network links allow you to push fresh data out to users.It’s a lightweight data format for export and distribution. It’s not going to be your native data format.
  • 24. How KML is usedBecause KML is viewed in a virtual globe, your data will be in your users’ control.They may not be viewing the same data as others, as other data and base imagery may be in use.Complicated or complex data may not be suited for KML that will be presented to a general audience.
  • 25. Web Maps – What’s ArcIMS?Many of you might be familiar with ArcIMS. For many years, ArcIMS was the way to deliver interactive maps across the web.Google introduced Maps in 2004, completely changing the way we think about mapping on the Web.Introduced the “slippy” map interface, where pre-rendered tiles are displayed in a draggable matrix at set zoom levels.
  • 26. The Slippy Map InterfaceSmooth, intuitive panning creates a welcoming user experience.Pre-rendered tiles reduce processing overhead, while increasing storage needs.Storage is relatively cheap, compared to upgrading the processing power of a server.The experience is what is important and long wait times negatively impact that experience.It has become the standard for web maps.
  • 27. Creating your own Web MapThere are several methods for creating Web Maps, however most require your own server and software.Arc2Earth allows you to generate the tiles needed from ArcGIS, and then upload them to a server.
  • 28. Using Web MapsProviding a slippy style web map can help your organization provide users with a simple, easy-to-use interactive web map. Web maps can help acclimate users to your data without requiring a GIS application.Users looking for basic maps and information may turn to your map instead of a desktop GIS.Greater control over the user experience.
  • 29. How Web Maps will be usedWhile the ability to manipulate the data without your knowledge is not as easy as it is with KML, your maps by their very nature will be shared across the Internet.Make sure your map is clearly depicting what you want to show and that any explanatory narrative is clear and concise.It will be hosted on your website, so it will be treated as a definitive source, on par with the actual GIS data behind the map.
  • 30. Hosting Your Own ServerYour own GIS server could produce KML and web maps like the previous examples, but it can also do much more.Act as a front-end to your GIS database.Provide additional web services, such as geocoding and geoprocessing.Greater control over your clients’ experience.Requires hardware and customization.
  • 31. Your GIS ServerArcGIS Server is probably the most robust offering out there today, but very costly.Roll your own using Open Source software.GeoServerTileCacheOpenLayers
  • 32. Using your GIS ServerThe server can feed data to both your KML files and hosted Web Maps.The server can manage your data and provide snapshot “views” to groups of users.Geoprocessing can be executed on the server, removing the processing burden on local workstations.Can support to complement data offerings and common tasks.
  • 33. How your GIS Server will be usedOnce the server is up and running, people will use it and expect it to be there when needed.Conversely, if you don’t make it easy to use, users will reject it and revert back to previous workflows (calling you, begging for maps/info)You will want to plan for redundancy, security testing, maintaining quality of service, etc.Plan big and plan to scale services as needed.
  • 35. Your Data in KMLIf you have not yet worked with KML, you will quickly find that it is a great format for distributing data, as it includes symbology, can support raster and vector data, and can be updated over the network.There is a small learning curve for your users; many will be familiar with the format already.However, there are some issues to consider before you migrate your data to KML.
  • 36. KML – Technical IssuesWhile it supports many features, not all features are as robust as in a traditional GIS and support varies among the KML viewers.Symbology is limited to outlines and fill for polygon features. Hatching and line styles are not supported.Large features (>10K vertices) are not rendered properly.Network links do not always behave.
  • 37. KML – Usability IssuesWhile a desktop 3D earth browser is impressive, it’s not the right solution for all data types.If the 3D browser helps people navigate your data, all the better. If they end up getting lost, it’s not very useful.Consider creating camera viewpoints or tours, similar to bookmarks in ArcMap Documents.You can also include political boundaries in your document, allowing users to zoom to an area.
  • 38. Exporting your data to KMLThere are many options for converting your existing GIS data to KML: ArcGIS Layers to KML: export from ArcMap.Online conversion services: upload a shapefile, download a KML file.Command line scripts: GDAL/OGR, Python scripts.Arc2Earth3rd party extensions to ArcGIS
  • 39. Workshop ExamplesFor the purpose of this workshop, the examples assume that you have access to ArcGIS 9.3 or later.Unless specified otherwise, the examples reflect using a typical Windows XP, ArcView-level GIS configuration.
  • 40. Getting Started with KMLFor this first example, we will be working with the municipalities of Atlantic County.We will add the layer to ArcMap, then use the Layer to KML tool to export the data.We will view the data in Google Earth to see how the data is modified in the conversion.
  • 43. Municipality Data in Google Earth
  • 44. Initial ObservationsThe exported data appears in Google Earth at the proper location. Note that not all export tools will reproject to WGS84 automatically.The symbology is preserved from ArcGIS to Google Earth.The exported file is a .KMZ, which is a ZIP-compressed file format.Clicking on the individual polygons does not cause anything to occur. Google Earth does allow for clickable polygons.
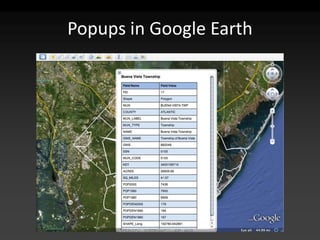
  • 45. Interactive KMLLet’s add some basic functionality to our KML data: clicking on a municipality in Google Earth will cause a balloon to pop up with attribute information.This is enabled through a Layer Properties tab introduced in ArcGIS 9.3 – HTML popup.Along with the hyperlink functionality, the HTML popup will be exported to Google Earth.
  • 46. The HTML Popup Window
  • 47. Configuring the HTML PopupWe will use the most basic HTML popup, a table with attribute information.We can switch field visibility off in the Fields tab if we do not want select fields in the popup.Advanced formatting is available through the use of XSLT stylesheets.
  • 50. Symbology ShortcomingsWhile configuring the HTML Popup, the symbology was changed to a dashed outline.The dashed outline did not get carried over to the KML symbology, although the color and line weight did.Keep in mind that complex data may need to be generalized to work with the limited cartographic capabilities of earth browsers.
  • 51. Exporting Raster DataSimilar to the process used to export the vector municipality data to Google Earth, we can export raster data to KML.Define a custom extent to clip the exported raster to a bounding box.ArcGIS takes some liberties with resampling, so you may need to tweak settings to get the data to appear as desired.
  • 52. Raster data in Google Earth
  • 53. Export Multiple LayersKML supports a mix of geometry types within the same KML file. ArcGIS can export multiple layers of mixed type (point, line, polygon, raster, etc) as one KML document.We can use the Map to KML tool to export all of the layers to a KML file.
  • 54. Multi-layer KML in Google Earth
  • 55. Using Web Services with KMLKML has the ability to access web services natively. Most earth browsers support this capability.KML can access WMS services and bring in WMS images based on the current extent.KML supports network links, automatically downloading remote KML/KMZ files and adding them to the current list of layers.
  • 56. Accessing WMSUnfortunately, WMS layers added to ArcGIS do not get exported to KML. Luckily, it’s very easy to add WMS layers within Google Earth.Save the Image Overlay (Google’s KML feature for supporting WMS) as its own KML file, so it is easy to add to other KML files.
  • 58. Notes on Image OverlaysBy default, Google specifies that the image overlay only covers 75% of the current view extent. You will likely want to change this to a value between 1 and 1.25.The default refresh settings are to wait 4 seconds before requesting new WMS imagery. You may want to alter this for your services.
  • 59. Network Overlays“If my users are already downloading the KML from my website, why do I need this?”When they download the data, they will then need to redownload to receive any updates. The network link will cause their Earth Browser to load the latest data on startup.Network link could point to a static KML or to the KML services provided by ArcGIS Server.
  • 60. Simple Network ExampleWe will upload our municipalities KML to a website and note the URL.Use Google Earth to add a new Network Link to your earth browser.Save the Network Link to its own KML file.Note the small size of the Network Link file.The data will be pulled in as needed.
  • 61. Serving KML OnlineWhile you could easily post a KML to your website, consider some alternative hosting options.GeoCommons, the open web mapping platform, can host your KML and a web map.Amazon Web Services can store your KML files, allowing the use of the Amazon network to distribute larger files.Depends on costs and service needs.
  • 62. Complex Network LinksNetwork links can be configured to load based on the current extent.Load balance or use a CDN for larger datasets.Remember, your user will need to download the data every time, so generalized or simple data works best.
  • 63. KML ReviewProvides user with an snapshot of your data.Open standard, readable by many programs.Can mix vector, raster and web services. Includes symbology information.Network links ensure users have latest data.Minimally interactive; view but not explore.Easy to produce and distribute.
  • 65. Your First Web MapProviding a basic web map, similar to Google Maps, has become a simple task.The ability to generate tiles, the rendered GIS data presented to end users, is possible through many different software packages. The heavy lifting will come as you move your map from a general viewer to a specific data interface.
  • 66. Basis of the TechnologyPrevious methods for generating maps on the Internet were in two forms:Render requests for any map extent and scale.Render a few static maps; provide links between.Google Maps changed this dynamic, as it publicized the “slippy map” concept.Slippy Maps are composed of square tiles rendered into a seamless map at static scales.
  • 67. Spherical MercatorA new projection was developed to make web mapping easier: Spherical Mercator.A Mercator project based on a spherical datum.Not for high-precision work. Not a problem because no one should be using web maps in place of surveys.
  • 68. Spherical MercatorProjection creates a square Earth, which can then be divided into square map tiles.Many GIS platforms now support this projection natively.
  • 69. Map FrameworkCreating a Slippy Map requires a map framework, such as OpenLayers (JS) or Yahoo! Maps (Flash)Google offers both JS and Flash APIs.Your map framework will request the tiles from a GIS server or a tile cache.A tile cache is simply a set of static map images in a standard directory structure.
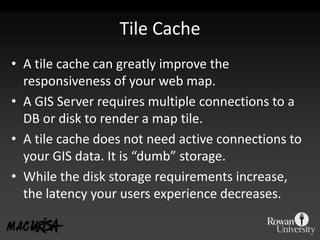
  • 70. Tile CacheA tile cache can greatly improve the responsiveness of your web map.A GIS Server requires multiple connections to a DB or disk to render a map tile.A tile cache does not need active connections to your GIS data. It is “dumb” storage.While the disk storage requirements increase, the latency your users experience decreases.
  • 71. Cache CreationThere are two predominate methods for populating a tile cache with map tiles.Direct: using a desktop computer to generate the tiles from a GIS, storing them locally or remotely.Intermediary: using middle-man software that passes on requests to a GIS server while creating and managing the cache.We will first look at the direct method using Arc2Earth.
  • 72. Arc2EarthInitially created in 2006 by SpatialDataLogic, Arc2Earth was a tool for bringing GIS data to Google Earth.It has since evolved into a GIS swiss army knife, allowing you to move your GIS data into many new distributed formats.Can supplement your KML as well as your map tile production.
  • 73. Getting Started with Arc2EarthWe will explore Arc2Earth’s tile generating capabilities using Pinelands data for Atlantic County.We will prepare our data in ArcMap, then use Arc2Earth to generate the tiles and basic web map based on our ArcMap settings.
  • 76. General Web Map Settings
  • 77. Items to ConsiderYou may want to experiment with anti-aliasing, as it may improve the legibility and crispness of your maps.Transparency can be implemented within the tiles (alpha-channel PNGs) or in Javascript.Remember to include metadata for your maps.
  • 79. Number of LevelsYou want to render only the levels needed for your application.Number of tiles quadruple as the zoom level increases.Limit the zoom levels of your map to what is appropriate.Specify the tile ordering scheme.
  • 80. Storing Your TilesArc2Earth will generate your tiles, but you must specify how they will be stored.Local copy is generated for a local cache.Upload to a cloud-based hosting service.
  • 81. Hosting Your Tiles in the CloudArc2Earth can save your tiles locally, allowing you to manually set up your tile cache.Can also export into:Amazon S3 & ArcGIS.comArc2Earth managed cloud-hosting using Google.
  • 82. Benefits of Cloud HostingRelying on a third-party service for hosting frees you from managing a server.Cloud hosting providers have a much larger infrastructure and capacity.Pre-built viewers remove the need for custom configuration.
  • 83. Our data on ArcGIS.com
  • 84. Hosted with ArcGIS.comArcGIS.com provides a framework for basic web map functionality.Service provides base map data that you would otherwise need to manage or license.Framework for desktop and mobile access.
  • 85. Disadvantages of Cloud HostingIf you already have some server infrastructure in place and your expected traffic is low, you may want to consider hosting in-house.Included frameworks are not as flexible or customizable compared to hosted services.Security of data – facilities & infrastructurePurchasing outside software/services can be difficult in government.
  • 86. Final Thoughts on Arc2EarthEasiest way to build tiles without a dedicated server. No need to manage server infrastructure as you rely on Amazon/Google.Very useful for generating KML files that may not export well using ESRI’s built-in tool.Can create SLD files for use on your own open source GIS server.Costs money for additional features; closed source.
  • 88. Developing your GIS ServerA GIS Server can be relatively simple, providing file or database storage while serving data through the intranet or Web.A GIS Server can be run on one workstation or on a cluster of servers.Your ultimate configuration depends on your needs, budget, and level of know-how.
  • 89. Assumptions MadeWhile we will discuss GIS Servers in general terms, we will focus on a few software offerings.The software in this workshop is open source, feature rich, well-documented, and relatively straightforward to install and manage.While it may not be the right fit for you, what we discuss today you should be able to try at home with your time being the only cost.
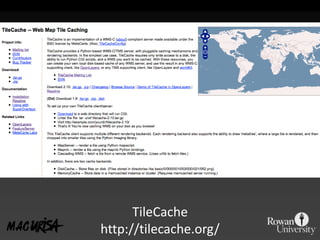
  • 90. Technologies UsedGeoServerA Java-based OGC-compliant, WFS-T capable GIS Server. Handles data and map rendering.TileCache & OpenLayersEnables you to host your own “slippy” maps.PostgreSQL & PostGISOpen source GIS database technology. Compatible with ArcSDE.
  • 91. Technologies UsedGeoServer, TileCache, and PostgreSQL can be switched out for similar software.However, this configuration works with minimal tweaking required.All are open source and freely available.All run on Linux, Mac OS X and Windows.Each has their own dedicated support community and options for purchased support.
  • 92. GeoServerBased on the GeoTools Java toolkit.Standards compliant & arguably the easiest server platform to incorporate into other GIS systems and products.Java Servlet technology; can run in a container or standalone.Simple to install (binaries available) and manage. Web-based user interface.
  • 94. Open Source SupportBefore we proceed, it should be stated that open source software is not “fix it yourself.”Many organization are hesitant to use open source for “enterprise” level applications due to the perceived lack of support.OpenGeo is the developer behind Geoserver.While open source, OpenGeo provides technical support and custom development to users of GeoServer.
  • 96. GeoServer ConfigurationMost features managed through a web interface.GeoServer is undoubtedly one of the easiest GIS servers to deploy.Upload data to server, then point-and-click configuration.Symbology defined using Styled Layer Descriptors (SLD).
  • 97. GeoServer InstallationDeploy as WAR from within a servlet containerInstall stand-alone.May need to install some dependencies for additional features.GDAL/OGRPlugins
  • 98. Post-InstallLog in to your server via a web interface.If installing on your own Windows desktop, it’s simply http://localhost:8080/geoserver/webFrom there, you can add data to the server, configure layers to serve, access service capabilities and much more.
  • 100. List of Layers Available
  • 101. Styled Layer DescriptorsSLDs are used to define symbology in GeoServer and in other open source projects.Is an OGC open format. Subset of WMS.You can define several SLDs to be used with a data layer, and give the option for the user to switch between them.Edit SLDs from GeoServer web interface.
  • 103. Yes, SLDs are XMLSLDs are very powerful, but not user-friendly.A GUI editor for SLDs within GeoServer is under development.Part of the GeoExt project for web GIS interfaces in JavaScript.
  • 104. SLD CookbookGeoServer’s documentation covers frequently-desired cartographic effects implemented with SLDs.Also available is an SLD reference, that includes notes on vendor-specific (GeoServer only) features.
  • 105. Now What?Now that you have your data in your server, what can you do with it?Serve the data to users via WMS or WFS, allowing ArcGIS Desktop users access.Serve the data to users through a website.
  • 106. ArcGIS WMS & WFS AccessArcGIS allows for direct access to WMS services.Under “GIS Servers” select Add New WMSEnter the URL to your server. Use the WMS link on the homepage.NJ’s aerial photography is available through WMS.
  • 107. WMS Layers in ArcMap
  • 108. Getting Started with Web MapsOn your organization’s website, you can create a page that uses the OpenLayers JavaScript library to create a slippy map on a page of your choosing.You can also install TileCache to speed up the rendering of the slippy map.Warning: some programming ahead!
  • 109. OpenLayersA JavaScript library for implementing slippy-style web maps.Originally developed by MetaCarta, then became an OSGeo project.Open source and no cost.Can interface with WMS services as well as ArcGIS Server.
  • 110. Why not Google Maps?While the Google Maps API seems ubiquitous, there are limitations that may impact your use.While free at first, Google will charge for high-traffic sites using its API.Version 2 is deprecated and they are going to turn it off eventually.Cannot be used on your intranet. All pages using the API must be public.
  • 111. Using OpenLayersOpenLayers provides the same basic functionality as Google Maps. Additional functionality such as in-map editing of vector features, easy configuration of custom projections, etc.If you’re familiar with the Google Maps API, OpenLayers should be an easy transition.OpenLayers does not come with base maps; provide your own or use Google, Bing, Yahoo!
  • 112. Entirely Your OwnWhile you may want to use Google/Bing as a base map, using their APIs may restrict you from tailoring the application to your users.You can host your own copy of OpenLayers and modify it as neededFrom the map functionality through to the user interface, the API is customizable.
  • 114. Starting from ExampleOne of the OpenLayers examples is a basic web map using a WMS service for the map tiles. We can copy that example to our own website and replace the example WMS URL with our own.Change the starting coordinates and zoom level and we’re off!
  • 117. Additional FunctionalityOpenLayers or Google Maps are the frameworks for developing custom interactions with the maps and data.OpenLayers even has code for manipulating vector data; modifying vertices in a feature.Additional functionality is performed server side, such as spatial or network analysis.Your server must be able to support those functions.
  • 119. TileCacheOnce your web mapping application is nearing release, you should consider taking steps to optimize your users’ experience.Caching map tiles will improve overall rendering speeds.Increased storage costs, but reduced CPU & DB demands as you are no longer rendering repeatedly from GIS data.
  • 120. IntermediaryTileCache sits between your interface and your rendering engine.It handles WMS requests, so your interface can continue to use the same request methods.WMS requests that have not been cached are passed along to the rendering engine, then stored when returned to the interface.Caches can be pre-rendered or rendered as needed.
  • 121. Caching On-The-FlyWeb MapGIS ServerTileCacheCacheMap Tile does not exist:Rendered then stored.Web MapGIS ServerTileCacheCacheMap Tile does exist:Pre-rendered tile returned.
  • 122. Configuring TileCacheTileCache is written in Python and can run on most modern platforms with minimal configuration.Define layers to be cached using a text-based configuration file.WMS ServiceConfigured for use in a Google-style mashup.
  • 123. Pieces In PlaceWe now have the pieces to develop our own Distributed GIS system.GeoServer– rendering and processing our GIS dataOpenLayers –providing a map interface in a web browserTileCache –optimizing delivery of map data
  • 124. Section 6Putting The Pieces Together
  • 125. Your Distributed GISWe have covered the various options available to move your data into a Distributed GIS.Not every tool will work for you, but one or more may be a part of your Distributed GIS.Let’s take a look at a few examples of Distributed GIS systems and see how they are implemented.
  • 126. National Weather ServiceThe NWS uses KML to distribute weather updates, advisories and radar/satellite imagery.The KML files use network links, allowing for automatic refreshing of the weather data.Weather data is always changing and the interface has to suit a general audience.
  • 127. Rowan’s Land Change ViewerBuilt as a part of the ongoing “Changing Landscapes of the Garden State” research jointly conducted by Rowan & Rutgers.Series of animated web maps showing changes in land use in New Jersey over 21 years.Developed using a multiple Distributed GIS technologies and distributed across the Web.
  • 129. Distributed Land Change ViewerLand Change ViewerGoogle MapsBase MapsBing MapsBird’s EyeCloudFrontGeoServerAmazon S3TileCache
  • 130. Land Change ViewerThe Land Change Viewer relies on a mix of hosted and cloud-based services.GeoServer was used to render the Land Use data for the entire state.TileCache generated local and S3-based map tile caches for the interactive maps.Amazon S3 was used to store the production map tiles & CloudFront to distribute.
  • 131. Tile CreationBy using CloudFront to distribute the map tiles using Amazon’s infrastructure, we needed to pre-build our cache.Map tiles were limited to zoom level 8 (all of NJ) through 15 (small town/neighborhood scale)Tile rendering had to begin well in advance of the release date.
  • 132. Tile MathFor the extent of NJ, zoom levels 8-15, approximately 60,000 tiles needed to be created.Each animation frame was one set of tiles.Approximately 1.5 million tiles had to be generated.
  • 133. Land Change ViewerAfter testing other possible implementation strategies, we selected a JS-based web map.Authoring the JS, configuring the server and rendering the tiles took about 4 weeks.Distributed GIS allows the user interface to be quick and responsive.More on the NJ Land Change Viewer at the MAC URISA Interactive Expo.
  • 135. Just the Beginning…While we covered many different technologies and topics, this is just a preview of the new direction GIS is heading.Distributed GIS has been around for several years, but it has never been as easy or available to smaller firms and groups as it is today.
  • 136. Implementing Your GISWhile the goals of your individual organizations vary, informing the public is likely a common goal.A Distributed GIS system can help you in delivering your data while also making it easier for the public to access and understand.The key is finding the right mix of technology to achieve that goal.
  • 137. Available TechnologyArcGIS ServerCloudServicesArcGIS.comServersGoogle AppEngineFME 2010GeoServerAmazon AWSERDAS ApolloWindows AzureMapServerChange Components To Suit Your NeedsBing MapsYahoo! MapsMapnikArc2EarthGoogle MapsESRI JS & FlexMap TileCreationInterfaceAPIsOpenLayersTileCacheGeoMooseMapstractionPolyMapsGeoEXTGeoWebCache
  • 138. Community SupportWhile not all of the open source packages have technical support, all have a community of users and developers to help with a project.Get involved with your platform’s community.Provide assistance to others.Show off your work.The community drives interest in the technology and sets the course for future development.
  • 139. After the WorkshopTry some of the different applications out with your own data. Many of the applications are free.Start a discussion in your organization on how you can better distribute your data using Distributed GIS technology.
  • 140. Thank YouI hope you enjoyed this discussion of Distributed GIS.Questions or comments:John [email protected]://njgeo.org/http://gis.rowan.edu/@johnjreiser (twitter)856-347-0047