HTML5 Charting in ASP.NET using RadHtmlChart
Download as pptx, pdf0 likes4,240 views

This document summarizes a presentation about HTML5 charting using Telerik's RadHtmlChart control. It includes an agenda that covers HTML5, visualization techniques like SVG and Canvas, a demo of SVG and Canvas, and a demo of RadHtmlChart. The presentation provides information on RadHtmlChart features like various chart types, data binding, customization options, and browser support.
1 of 21
Download to read offline


Ad
Recommended
Easy HTML5 Data Visualization with Kendo UI DataViz
Easy HTML5 Data Visualization with Kendo UI DataVizLohith Goudagere Nagaraj This document discusses Kendo UI DataViz, an HTML5-based JavaScript framework for data visualization. It provides easy and effective ways to visualize data through charts, gauges and other graphical representations. The document outlines why visualization is important, how HTML5 technologies like SVG and Canvas can be used to create visualizations, and introduces various widgets in Kendo UI DataViz like charts and gauges. It also includes demonstrations of the framework in action.
Developing ASP.NET MVC Applications Quicker With Kendo UI
Developing ASP.NET MVC Applications Quicker With Kendo UILohith Goudagere Nagaraj The document discusses the use of Kendo UI for developing ASP.NET MVC applications efficiently, highlighting its capabilities as a unified framework for HTML5 and JavaScript apps. It details features such as customization, a built-in MVVM framework, and ASP.NET MVC wrappers for enhanced productivity and easy data binding. Additionally, it showcases a demo of an Adventure Works dashboard to illustrate the framework's practical application.
Cloud Based Enterprise Apps using Everlive
Cloud Based Enterprise Apps using EverliveDhananjay Kumar This document discusses using cloud-based enterprise apps with Icenium Everlive. It covers what enterprise apps need, such as working with large files, backend data, CRUD operations, users, roles, authentication, authorization, and notifications. It introduces Icenium Everlive as a backend as a service that provides these features. The document demonstrates consuming Everlive services in different clients like .NET SDK, JavaScript SDK, Windows Phone 8 SDK, and via REST API. It provides an agenda for a portal walkthrough and demo of Everlive.
MVVM & Validation with Kendo UI
MVVM & Validation with Kendo UILohith Goudagere Nagaraj Kendo UI provides a single package solution for building web applications with JavaScript, HTML5 and CSS3. It includes UI widgets, frameworks, and tools for data binding, visualization and building mobile apps. Kendo UI uses the MVVM pattern to separate data models from views through ViewModels. It includes ObservableObject and ObservableArray classes to enable two-way data binding between UI elements and data. Validation capabilities are also provided to augment HTML5 form validation and make it work consistently across browsers.
Kendo UI Wrappers in ASP.NET Core
Kendo UI Wrappers in ASP.NET CoreLohith Goudagere Nagaraj The document discusses using Kendo UI wrappers in ASP.NET MVC Core 1.0. It provides an overview of ASP.NET Core 1.0, Kendo UI, and using Kendo UI in ASP.NET Core projects. Tag helpers are introduced as an improved way over HTML helpers to incorporate Kendo UI wrappers in ASP.NET Core views. The presentation includes a demo of using Kendo UI in an ASP.NET Core application.
Introduzione a web e servizi con .net e azure
Introduzione a web e servizi con .net e azuredotnetabruzzo This document discusses Microsoft Azure and .NET development. It provides an overview of the Azure platform and services available, including Web Sites, SQL Database, Storage, Mobile Services, and the Azure Portal. It encourages attendees to try out Azure with a free one-month $150 credit that can be used across all Azure services. Additional .NET and Azure resources are also referenced.
Build Hybrid Mobile Applications for Nokia Lumia Devices
Build Hybrid Mobile Applications for Nokia Lumia DevicesLohith Goudagere Nagaraj This document discusses building hybrid mobile applications using Telerik Kendo UI. It defines hybrid apps as those written with web technologies but run natively on devices by leveraging the device's browser engine. Hybrid apps allow targeting multiple mobile platforms while still accessing device capabilities. Telerik Kendo UI is an HTML5 framework for building such hybrid mobile apps using its widgets. Telerik AppBuilder is a hybrid mobile app IDE, and it also has a Visual Studio extension to facilitate hybrid app development. The document concludes with a demo of a media player hybrid mobile app.
Angular Introduction (RS)
Angular Introduction (RS)Rishikesh Shukla Angular 7 is a platform for building web, mobile, and desktop applications using TypeScript and following a modular structure. It helps build single page applications that are simplified to develop and debug. New features in Angular 7 include CLI prompts, support for TypeScript 3.1 and newer versions of dependencies, modules for virtual scrolling, drag and drop, and bundle size tracking.
Inside Wijmo 5, a Large-scale JavaScript Product
Inside Wijmo 5, a Large-scale JavaScript ProductChris Bannon Wijmo 5 is a JavaScript UI controls library specializing in data grids and charts, known for its high performance and zero dependencies. It features a core set of extensible controls, including the FlexGrid, and is built entirely in TypeScript, allowing developers to leverage C#-like syntax. The framework integrates well with AngularJS and Bootstrap, providing tools and resources for modern web application development.
Asp
AspFred Rodriguez Active Server Pages (ASP) is a server-side scripting technology that allows users to create dynamic web pages using HTML, scripts, and reusable components. ASP enables scripting for IIS using VBScript and Jscript. While ASP is not a silver bullet that can solve all web development problems, it provides an open environment for non-programmers to build applications without writing code.
Create Hybrid Mobile Application with Icenium and Kendo UI Mobile
Create Hybrid Mobile Application with Icenium and Kendo UI Mobile Dhananjay Kumar This document discusses how to create hybrid mobile applications using Icenium and Kendo UI Mobile. It begins with an agenda and introduction of the presenter. It then covers the basics of hybrid apps, introducing Icenium as a cloud-based IDE and Kendo UI Mobile for building cross-platform UIs. The document demonstrates an example app architecture and shows the steps to develop a hybrid app. It highlights features of Icenium and widgets in Kendo UI Mobile before concluding with a demo and Q&A section.
5 'Real-world' Reasons to Go Headless by Devotion
5 'Real-world' Reasons to Go Headless by DevotionKentico Software The document discusses the advantages of using a headless CMS like Kentico Cloud from an agency perspective, emphasizing flexibility, accessibility, control, speed, and creativity. It highlights how a headless CMS allows for streamlined content development processes and faster market delivery while separating content management from presentation. Various case studies illustrate the practical benefits experienced by agencies through the implementation of Kentico Cloud.
Togu CMS
Togu CMSAlessandro Siragusa The document discusses Togu, a WYSIWYG content management framework based on HTML5 that allows for easy content creation and customization. It has native support for responsive design and components. Content can be edited in-place with drag and drop. Views are plain Mustache templates with custom directives, using two-way data binding and dependency injection. The server acts as a data provider with REST APIs, and the frontend design is agnostic from the backend implementation.
Web Based Development Introduction
Web Based Development IntroductionEdy Segura This document discusses web-based development and the main technologies involved, including web architecture, HTTP, HTML, CSS, JavaScript, and APIs. It notes that JavaScript is becoming increasingly important and prevalent across web servers, libraries, databases, and languages, so learning JavaScript is important to avoid being left behind in web development. The document also mentions building web applications using these technologies and having hands-on practice.
Visualizing large data sets with wijmo enterprise webinar
Visualizing large data sets with wijmo enterprise webinarRoss Dederer This document provides a summary of a presentation about visualizing large data sets with Wijmo Enterprise. The presentation covers an introduction to Wijmo, challenges of web development today, techniques for visualizing large datasets using Wijmo charts and grids, and includes live demos. Specifically, it discusses how to optimize charts for large datasets, use grids to visualize large amounts of data, handle the data layer with CollectionView, and visualize qualitative data with annotations and drill-down capabilities.
Pros and Cons of developing a Thick Clientside App
Pros and Cons of developing a Thick Clientside AppRavi Teja The document discusses the pros and cons of developing thick client-side applications, emphasizing the benefits of a decoupled architecture and improved user experience, while also noting challenges such as complexity and performance issues. It highlights the importance of client-side templating, the hybrid model for rendering, and technical components used in developing the DelightCircle web app. Additionally, it touches on communication strategies between the web app and its API.
Rails-like Asp.Net Development Shared
Rails-like Asp.Net Development Sharedcurtismitchell The document discusses making ASP.NET development more like Ruby on Rails by following principles of Rails such as DRY (Don't Repeat Yourself), Convention Over Configuration, and Separation of Concerns. It promotes using ASP.NET MVC, Migrator.NET, FluentNHibernate, Spark View Engine, and FluentValidation to increase productivity and ease of development and maintenance while adhering to best practices. A quick overview of Rails is followed by examining what a Rails-like approach means for ASP.NET and the tools that comprise the recommended stack.
Developpement informatique
Developpement informatiquebrokerslip0 jQuery is a JavaScript library that makes coding JavaScript easier by providing modular and concise functions. It is updated regularly to maintain compatibility with evolving web standards and browsers. While JavaScript syntax resembles C, JavaScript and Java are different languages. JavaScript is commonly used for client-side web development due to its support across browsers, ability to validate forms and interact with servers, and availability of libraries like jQuery. It also allows for local data storage and geo-location capabilities in web applications.
Welcome to Wijmo 5
Welcome to Wijmo 5Chris Bannon The document discusses the evolution of JavaScript and introduces Wijmo 5, a new generation of JavaScript controls optimized for modern browsers and mobile devices. It outlines the migration process from Silverlight to HTML5 using Wijmo 5 controls, emphasizing ease of use and integration with various frameworks. The document concludes with the advantages of Wijmo 5, highlighting its performance, lightweight design, and extensive control library.
What Is a Cloud-first Headless CMS
What Is a Cloud-first Headless CMSKentico Software A cloud-first headless CMS is designed to meet the needs of a multi-channel digital world by separating content management from its presentation, enabling content delivery across various platforms like web, mobile, and IoT. Traditional CMS models, which are tied to specific programming languages and page-oriented structures, are increasingly inadequate for modern demands, leading to the rise of headless options that allow developers more flexibility and control using APIs. As companies shift towards a SaaS model, a cloud-first headless CMS offers significant advantages, including reduced operational worries, improved security, and faster time to market.
The RAW stack
The RAW stackMaurice De Beijer [MVP] The document discusses the RAW Stack, which includes RavenDB as a NoSQL database, AngularJS as a client-side MVC framework, and WebAPI as a REST framework. RavenDB is an open-source, schema-less document database for .NET with asynchronous support. AngularJS makes it easy to build single-page applications with modules and dependency injection. WebAPI serves data in a RESTful way that can be consumed by AngularJS. The stack also includes ASP.NET MVC, Bootstrap, and more. Code demos and sources are provided.
ASP.NET MVC 4 Introduction
ASP.NET MVC 4 IntroductionLohith Goudagere Nagaraj This document summarizes the new features in ASP.NET MVC 4, including enhanced default project templates, new mobile project templates, display modes for desktop and mobile browsers, an empty project template, the ability to add controllers to any folder, the new Web API framework, and bundling and minification capabilities. It then provides more detail on mobile web applications, selective views for mobile, Web API features, and how bundling and minification works.
Event sourcing your React-Flux applications
Event sourcing your React-Flux applicationsMaurice De Beijer [MVP] The document discusses React applications using event sourcing and command query responsibility segregation. It introduces Maurice de Beijer as a software engineer and trainer who will discuss building React applications with Redux using event sourcing principles like storing commands and events instead of directly modifying data. The document outlines some key concepts like using command and query services, generating events from commands, and projecting current state from events.
Maurice de Beijer
Maurice de BeijerCodeFest ASP.NET Core introduces a new project structure that is totally modular, allowing for a faster development cycle. It runs on .NET Core which is cross-platform, supporting on-premises and cloud deployments. Key aspects include MVC and Web API, inversion of control and the ability to choose editors and tools.
How to automate your BizTalk Installations and Deployments with Chef
How to automate your BizTalk Installations and Deployments with ChefBizTalk360 The document discusses the automation of BizTalk installations and deployments using Chef, a framework designed for building automated scripts. It outlines the importance of automation, presents the Chef architecture, and describes the components involved such as cookbooks and recipes. Additionally, resources for further exploration and practical implementation are provided.
ASP.NET Loves HTML5, Javascript and CSS3, or what's new in VS2013 for Web Dev...
ASP.NET Loves HTML5, Javascript and CSS3, or what's new in VS2013 for Web Dev...Microsoft The document discusses the integration of ASP.NET with HTML5, JavaScript, and CSS3, highlighting new features in Visual Studio 2013 for web developers. It covers improvements such as browser link, editor enhancements, and introduces Windows Azure and Visual Studio Online as platforms for development. Additionally, it emphasizes the unification of web tools and the capabilities within the Azure ecosystem.
Wijmo 5 - GrapeCity Echo Tokyo
Wijmo 5 - GrapeCity Echo TokyoChris Bannon Wijmo 5 is a next-generation suite of HTML5/JavaScript controls designed for touch-first applications with a focus on performance, simplicity, and type safety using TypeScript. It offers various components such as grids and charts, with no external dependencies, and is optimized for modern web development frameworks like Angular. The roadmap aims to expand its offerings based on user feedback, including support for Angular 2.0 and more controls and samples.
Kentico Virtual Roadshow - June 2017
Kentico Virtual Roadshow - June 2017Kentico Software The document discusses Kentico's dual-rail strategy of developing both Kentico EMS and Kentico Cloud side-by-side. Kentico Cloud is positioned as a cloud-first digital experience platform for agencies and clients, while Kentico EMS focuses on robust, scalable features for digital experiences, content management, e-commerce, and online marketing. Upcoming releases of Kentico 11 and 12 will add new email marketing and ecommerce capabilities to Kentico EMS. The roadmap also includes initiatives around GDPR, technology partnerships, and a commerce-first platform.
VizEx View HTML5 Workshop
VizEx View HTML5 WorkshopDavid Manock The document outlines the Vizex View HTML5 technology workshop held from February 23rd-25th, 2016, led by presenter Don Larson and moderated by Dave Manock. It covers key features such as CGM support, fast rendering without plug-ins, and a customizable toolbar, emphasizing the transition from ActiveX technology to HTML5 for web-based CGM file viewing. The workshop includes demonstrations, Q&A sessions, and invitations to join the evaluation program for stakeholders interested in implementing this technology.
VizEx View HTML5 Workshop
VizEx View HTML5 WorkshopLarson Software Technology The document outlines a technology workshop on Vizex View HTML5, presenting a new tool for rendering CGM files without the need for plugins like ActiveX. It highlights the advantages of HTML5, including multimedia integration and compatibility across various devices, while providing details on the workshop agenda, background on computer graphics standards, and an evaluation program for implementation. The session concludes with a Q&A and invitations to join the feedback program for developers.
More Related Content
What's hot (20)
Inside Wijmo 5, a Large-scale JavaScript Product
Inside Wijmo 5, a Large-scale JavaScript ProductChris Bannon Wijmo 5 is a JavaScript UI controls library specializing in data grids and charts, known for its high performance and zero dependencies. It features a core set of extensible controls, including the FlexGrid, and is built entirely in TypeScript, allowing developers to leverage C#-like syntax. The framework integrates well with AngularJS and Bootstrap, providing tools and resources for modern web application development.
Asp
AspFred Rodriguez Active Server Pages (ASP) is a server-side scripting technology that allows users to create dynamic web pages using HTML, scripts, and reusable components. ASP enables scripting for IIS using VBScript and Jscript. While ASP is not a silver bullet that can solve all web development problems, it provides an open environment for non-programmers to build applications without writing code.
Create Hybrid Mobile Application with Icenium and Kendo UI Mobile
Create Hybrid Mobile Application with Icenium and Kendo UI Mobile Dhananjay Kumar This document discusses how to create hybrid mobile applications using Icenium and Kendo UI Mobile. It begins with an agenda and introduction of the presenter. It then covers the basics of hybrid apps, introducing Icenium as a cloud-based IDE and Kendo UI Mobile for building cross-platform UIs. The document demonstrates an example app architecture and shows the steps to develop a hybrid app. It highlights features of Icenium and widgets in Kendo UI Mobile before concluding with a demo and Q&A section.
5 'Real-world' Reasons to Go Headless by Devotion
5 'Real-world' Reasons to Go Headless by DevotionKentico Software The document discusses the advantages of using a headless CMS like Kentico Cloud from an agency perspective, emphasizing flexibility, accessibility, control, speed, and creativity. It highlights how a headless CMS allows for streamlined content development processes and faster market delivery while separating content management from presentation. Various case studies illustrate the practical benefits experienced by agencies through the implementation of Kentico Cloud.
Togu CMS
Togu CMSAlessandro Siragusa The document discusses Togu, a WYSIWYG content management framework based on HTML5 that allows for easy content creation and customization. It has native support for responsive design and components. Content can be edited in-place with drag and drop. Views are plain Mustache templates with custom directives, using two-way data binding and dependency injection. The server acts as a data provider with REST APIs, and the frontend design is agnostic from the backend implementation.
Web Based Development Introduction
Web Based Development IntroductionEdy Segura This document discusses web-based development and the main technologies involved, including web architecture, HTTP, HTML, CSS, JavaScript, and APIs. It notes that JavaScript is becoming increasingly important and prevalent across web servers, libraries, databases, and languages, so learning JavaScript is important to avoid being left behind in web development. The document also mentions building web applications using these technologies and having hands-on practice.
Visualizing large data sets with wijmo enterprise webinar
Visualizing large data sets with wijmo enterprise webinarRoss Dederer This document provides a summary of a presentation about visualizing large data sets with Wijmo Enterprise. The presentation covers an introduction to Wijmo, challenges of web development today, techniques for visualizing large datasets using Wijmo charts and grids, and includes live demos. Specifically, it discusses how to optimize charts for large datasets, use grids to visualize large amounts of data, handle the data layer with CollectionView, and visualize qualitative data with annotations and drill-down capabilities.
Pros and Cons of developing a Thick Clientside App
Pros and Cons of developing a Thick Clientside AppRavi Teja The document discusses the pros and cons of developing thick client-side applications, emphasizing the benefits of a decoupled architecture and improved user experience, while also noting challenges such as complexity and performance issues. It highlights the importance of client-side templating, the hybrid model for rendering, and technical components used in developing the DelightCircle web app. Additionally, it touches on communication strategies between the web app and its API.
Rails-like Asp.Net Development Shared
Rails-like Asp.Net Development Sharedcurtismitchell The document discusses making ASP.NET development more like Ruby on Rails by following principles of Rails such as DRY (Don't Repeat Yourself), Convention Over Configuration, and Separation of Concerns. It promotes using ASP.NET MVC, Migrator.NET, FluentNHibernate, Spark View Engine, and FluentValidation to increase productivity and ease of development and maintenance while adhering to best practices. A quick overview of Rails is followed by examining what a Rails-like approach means for ASP.NET and the tools that comprise the recommended stack.
Developpement informatique
Developpement informatiquebrokerslip0 jQuery is a JavaScript library that makes coding JavaScript easier by providing modular and concise functions. It is updated regularly to maintain compatibility with evolving web standards and browsers. While JavaScript syntax resembles C, JavaScript and Java are different languages. JavaScript is commonly used for client-side web development due to its support across browsers, ability to validate forms and interact with servers, and availability of libraries like jQuery. It also allows for local data storage and geo-location capabilities in web applications.
Welcome to Wijmo 5
Welcome to Wijmo 5Chris Bannon The document discusses the evolution of JavaScript and introduces Wijmo 5, a new generation of JavaScript controls optimized for modern browsers and mobile devices. It outlines the migration process from Silverlight to HTML5 using Wijmo 5 controls, emphasizing ease of use and integration with various frameworks. The document concludes with the advantages of Wijmo 5, highlighting its performance, lightweight design, and extensive control library.
What Is a Cloud-first Headless CMS
What Is a Cloud-first Headless CMSKentico Software A cloud-first headless CMS is designed to meet the needs of a multi-channel digital world by separating content management from its presentation, enabling content delivery across various platforms like web, mobile, and IoT. Traditional CMS models, which are tied to specific programming languages and page-oriented structures, are increasingly inadequate for modern demands, leading to the rise of headless options that allow developers more flexibility and control using APIs. As companies shift towards a SaaS model, a cloud-first headless CMS offers significant advantages, including reduced operational worries, improved security, and faster time to market.
The RAW stack
The RAW stackMaurice De Beijer [MVP] The document discusses the RAW Stack, which includes RavenDB as a NoSQL database, AngularJS as a client-side MVC framework, and WebAPI as a REST framework. RavenDB is an open-source, schema-less document database for .NET with asynchronous support. AngularJS makes it easy to build single-page applications with modules and dependency injection. WebAPI serves data in a RESTful way that can be consumed by AngularJS. The stack also includes ASP.NET MVC, Bootstrap, and more. Code demos and sources are provided.
ASP.NET MVC 4 Introduction
ASP.NET MVC 4 IntroductionLohith Goudagere Nagaraj This document summarizes the new features in ASP.NET MVC 4, including enhanced default project templates, new mobile project templates, display modes for desktop and mobile browsers, an empty project template, the ability to add controllers to any folder, the new Web API framework, and bundling and minification capabilities. It then provides more detail on mobile web applications, selective views for mobile, Web API features, and how bundling and minification works.
Event sourcing your React-Flux applications
Event sourcing your React-Flux applicationsMaurice De Beijer [MVP] The document discusses React applications using event sourcing and command query responsibility segregation. It introduces Maurice de Beijer as a software engineer and trainer who will discuss building React applications with Redux using event sourcing principles like storing commands and events instead of directly modifying data. The document outlines some key concepts like using command and query services, generating events from commands, and projecting current state from events.
Maurice de Beijer
Maurice de BeijerCodeFest ASP.NET Core introduces a new project structure that is totally modular, allowing for a faster development cycle. It runs on .NET Core which is cross-platform, supporting on-premises and cloud deployments. Key aspects include MVC and Web API, inversion of control and the ability to choose editors and tools.
How to automate your BizTalk Installations and Deployments with Chef
How to automate your BizTalk Installations and Deployments with ChefBizTalk360 The document discusses the automation of BizTalk installations and deployments using Chef, a framework designed for building automated scripts. It outlines the importance of automation, presents the Chef architecture, and describes the components involved such as cookbooks and recipes. Additionally, resources for further exploration and practical implementation are provided.
ASP.NET Loves HTML5, Javascript and CSS3, or what's new in VS2013 for Web Dev...
ASP.NET Loves HTML5, Javascript and CSS3, or what's new in VS2013 for Web Dev...Microsoft The document discusses the integration of ASP.NET with HTML5, JavaScript, and CSS3, highlighting new features in Visual Studio 2013 for web developers. It covers improvements such as browser link, editor enhancements, and introduces Windows Azure and Visual Studio Online as platforms for development. Additionally, it emphasizes the unification of web tools and the capabilities within the Azure ecosystem.
Wijmo 5 - GrapeCity Echo Tokyo
Wijmo 5 - GrapeCity Echo TokyoChris Bannon Wijmo 5 is a next-generation suite of HTML5/JavaScript controls designed for touch-first applications with a focus on performance, simplicity, and type safety using TypeScript. It offers various components such as grids and charts, with no external dependencies, and is optimized for modern web development frameworks like Angular. The roadmap aims to expand its offerings based on user feedback, including support for Angular 2.0 and more controls and samples.
Kentico Virtual Roadshow - June 2017
Kentico Virtual Roadshow - June 2017Kentico Software The document discusses Kentico's dual-rail strategy of developing both Kentico EMS and Kentico Cloud side-by-side. Kentico Cloud is positioned as a cloud-first digital experience platform for agencies and clients, while Kentico EMS focuses on robust, scalable features for digital experiences, content management, e-commerce, and online marketing. Upcoming releases of Kentico 11 and 12 will add new email marketing and ecommerce capabilities to Kentico EMS. The roadmap also includes initiatives around GDPR, technology partnerships, and a commerce-first platform.
Similar to HTML5 Charting in ASP.NET using RadHtmlChart (20)
VizEx View HTML5 Workshop
VizEx View HTML5 WorkshopDavid Manock The document outlines the Vizex View HTML5 technology workshop held from February 23rd-25th, 2016, led by presenter Don Larson and moderated by Dave Manock. It covers key features such as CGM support, fast rendering without plug-ins, and a customizable toolbar, emphasizing the transition from ActiveX technology to HTML5 for web-based CGM file viewing. The workshop includes demonstrations, Q&A sessions, and invitations to join the evaluation program for stakeholders interested in implementing this technology.
VizEx View HTML5 Workshop
VizEx View HTML5 WorkshopLarson Software Technology The document outlines a technology workshop on Vizex View HTML5, presenting a new tool for rendering CGM files without the need for plugins like ActiveX. It highlights the advantages of HTML5, including multimedia integration and compatibility across various devices, while providing details on the workshop agenda, background on computer graphics standards, and an evaluation program for implementation. The session concludes with a Q&A and invitations to join the feedback program for developers.
[D2 campus seminar]웹브라우저 엔진
[D2 campus seminar]웹브라우저 엔진NAVER D2 This document discusses browser engines and summarizes key points:
1. It describes how browsers work at a high level, including parsing HTML and CSS to build DOM and render trees, performing layout and painting, and using JavaScript engines.
2. It covers advanced rendering technologies like hardware acceleration, compositing, and threaded rendering to improve performance.
3. It provides tips for engine developers to optimize layout, painting, and rendering, such as using layers and translation instead of positioning to reduce reflows.
Web Design Tools
Web Design Toolslillianabe This document provides summaries of several free web design tools and resources. It describes The Square Grid, a CSS framework based on 35 equal-width columns. It also describes Jo, a lightweight JavaScript framework for HTML5 apps. Additionally it summarizes tools for creating wireframes, generating CSS gradients, displaying quotes with jQuery, and generating grid layouts. The document is intended to help designers and developers find useful free tools.
Make windows forms speak the windows 8 modern ui design
Make windows forms speak the windows 8 modern ui designLohith Goudagere Nagaraj This webinar will demonstrate how to use Telerik's RadControls for WinForms to build a modern user interface for desktop applications. It will cover the principles of modern UI design, showcase the RadPanorama control which allows grouping and reordering content tiles, and include a live demo. Attendees can enter a drawing to win a .NET Ninja t-shirt.
Building a Better Web with HTML5 and CSS3
Building a Better Web with HTML5 and CSS3Karambir Singh Nain HTML5 and CSS3 provide improvements to building the web. HTML5 introduces more semantic tags that improve accessibility and cleaner code. It also provides native support for video, audio, local storage and better interactions. CSS3 enhances presentation. HTML5 is supported across modern browsers and on mobile, allowing responsive design. New features like canvas and WebGL enable graphic effects. Geolocation allows accessing a user's location with permission. HTML5 aims to make the web platform more powerful and flexible.
Html5 (games)
Html5 (games)chamsddine bouzaine HTML5 provides capabilities for building games in a cross-platform and lightweight manner without dependencies. It includes powerful APIs like the canvas element for 2D drawing and WebGL for 3D rendering. Common elements of HTML5 games include using <canvas> to define a drawing area, a 2D or 3D API to render shapes and objects, physics engines to simulate movement and interactions, and technologies like local storage for data caching. Tools like game engines, libraries, and bundlers can help develop HTML5 games.
Html5 Overview
Html5 OverviewDaniel Arndt Alves This document provides an overview of HTML5, including its history, timeline, new features, and compatibility with browsers. Some key points:
- HTML5 development is led by the WHATWG and W3C to standardize web applications. It simplifies HTML and introduces new semantic elements like <article>, <aside>, <header>.
- New features include multimedia with <audio> and <video> tags, 3D graphics with Canvas, and offline/storage APIs. Forms are enhanced with new input types.
- CSS3 adds animation, transitions and transforms. Performance improves with Web Workers and XMLHttpRequest Level 2.
- Browser support for HTML5 features is tracked on http://caniuse
Academy PRO: HTML5 API graphics
Academy PRO: HTML5 API graphicsBinary Studio The document discusses various HTML5 graphics APIs, including Canvas, SVG, and WebGL, highlighting their features and use cases. Canvas allows pixel manipulation and is suitable for gaming and animations, while SVG, described as an XML-based graphic format, is great for interactive and scalable graphics despite being larger in file size. WebGL enables 3D graphics rendering using the GPU within a browser context, offering a powerful standard for web applications but currently lacks support across all browsers.
Html5 Game Development with Canvas
Html5 Game Development with CanvasPham Huy Tung This document provides an overview of using HTML5 Canvas for game development. It discusses how Canvas allows 2D drawing directly in the browser using JavaScript. Common Canvas methods like fillRect() and strokeRect() are used to draw shapes. Canvas is useful for games, animations, and data visualization. Optimization techniques like requestAnimationFrame can improve game performance. Popular JavaScript libraries that are useful for HTML5 games include Box2D for physics and SoundManager2 for audio. The document provides examples of simple games built with Canvas in a short time period, such as a 2-week Mario game project. It concludes with further resources for learning HTML5 and Canvas game development.
Your Bespoke Software Developers.pdf
Your Bespoke Software Developers.pdfOceanstart The document outlines a web and custom software development company that provides skilled developers for nearshore staffing or full project outsourcing across various technologies, including C#, PHP, and Java. It describes the company's services, such as building complex software solutions and substituting in-house developers, alongside highlighting its extensive experience and completed projects. The content also touches upon a specific fintech project where the company collaborated to create a custom cryptocurrency analytics service.
Ie9 dev overview (300) beta
Ie9 dev overview (300) betaKirk Yamamoto Internet Explorer 9 provides major improvements in performance, standards support, and developer tools. It features a new JavaScript engine called Chakra that compiles JavaScript in the background for faster execution. IE9 supports HTML5 features like <canvas>, <video>, and <audio> with hardware acceleration for smooth playback. It also has full support for Scalable Vector Graphics (SVG) and WOFF web fonts. CSS3 features like rounded corners, shadows, gradients, and new color functions are implemented. The developer tools have been enhanced with tools for network inspection, debugging JavaScript, and viewing SVG. IE9 aims to be faster, cleaner, standards-compliant through same markup across browsers, and utilize the full power of users' hardware.
SnapyX
SnapyXekino This document summarizes a presentation about building a single page image editing application called SnapyX using HTML5 and related technologies. It describes using HTML5 features like canvas and File API for image uploading and processing, CSS3 grids for layout, and Backbone.js with plugins for the client-side architecture including offline storage with IndexedDB. It acknowledges challenges with experimental browsers and technologies but is proud of publishing an app to the Windows Store.
SnapyX - ParisJS
SnapyX - ParisJSflorianharmel The document outlines the development of a client-side HTML5 application named Snapyx, which utilizes various technologies including Backbone.js and IndexedDB for storage and rendering. It discusses the project structure, including the use of CSS3 Grid layout and file APIs for image handling. Additionally, it highlights challenges in performance and browser support while referencing related resources and tools utilized in the project.
Html5 more than just html5 v final
Html5 more than just html5 v finalLohith Goudagere Nagaraj 1. HTML5 is a major revision to the HTML standard that is still under development and aims to be the future of the web.
2. It includes new elements like <video>, <audio>, and <canvas> that allow embedding multimedia without plugins, as well as features like geolocation.
3. The HTML5 specification is very large, covering HTML, SVG, CSS, and APIs. It aims to provide a common standard for web applications.
4. HTML5 is not just a marketing term - it represents an ongoing effort to develop a unified standard for the next generation of the web.
Daniel Egan Msdn Tech Days Oc
Daniel Egan Msdn Tech Days OcDaniel Egan The document provides details about a presentation given by Daniel Egan on what's new in ASP.Net 4.0. It includes an agenda that covers new features in ASP.Net web forms, ASP.Net AJAX, ASP.Net templates, and integrating jQuery. It also provides resources and contact information for Daniel Egan.
HTML 5 - A developers perspective
HTML 5 - A developers perspectiveSanthosh Kumar Srinivasan HTML5 is the next major revision of the HTML standard currently under development by the WHATWG and W3C. It introduces many new features including new semantic elements, canvas element for 2D graphics, video and audio elements, local storage, and geographic location. CSS3 also introduces many new features such as rounded corners, box shadows, gradients, transitions and 2D/3D transforms allowing developers to create richer designs. Together, HTML5 and CSS3 make web development easier by handling more tasks like drag and drop and client side storage, allowing developers to focus on the core functionality of their applications.
[RakutenTechConf2013] [E-2] HTML5 in Rakuten
[RakutenTechConf2013] [E-2] HTML5 in RakutenRakuten Group, Inc. The document outlines the activities and objectives of the HTML5 Project Team at Rakuten, led by Tsutomu Ogasawara. It covers the team's structure, mission, and several HTML5 implementations and evangelization efforts within the company. Additionally, it highlights various HTML5 applications, tools, and a detailed implementation guide aimed at expanding HTML5 usage across Rakuten's platforms.
Make your animations perform well - Anna Migas - Codemotion Rome 2017
Make your animations perform well - Anna Migas - Codemotion Rome 2017Codemotion The document discusses animation performance techniques for web development, comparing CSS and JavaScript animations, as well as highlighting when to use animations effectively. It covers browser rendering processes, the importance of utilizing GPU acceleration, and best practices such as using 'will-change' and 'requestAnimationFrame'. Additionally, it advises on minimizing resource use and testing animations for optimal performance.
Introduction to HTML5 & CSS3
Introduction to HTML5 & CSS3Pravasini Sahoo This document provides an overview of HTML5 features including new tags, forms, graphics capabilities with canvas and SVG, storage with WebSQL and Web Storage, real-time communication with WebSockets, multimedia with audio and video, geolocation, and performance improvements with Web Workers. It also summarizes skills and certifications in areas like PHP, MySQL, CSS3, and frameworks like Zend and Twitter Bootstrap.
Ad
More from Lohith Goudagere Nagaraj (20)
Porting Hybrid Apps to Native Apps
Porting Hybrid Apps to Native AppsLohith Goudagere Nagaraj The document discusses hybrid mobile apps, native mobile apps, and NativeScript. Hybrid apps are developed with web technologies like HTML, CSS, and JavaScript but have limitations in terms of performance and plugin availability. Native apps are developed specifically for each platform using languages like Java and Swift but have full access to device capabilities. NativeScript allows developing cross-platform native mobile apps using JavaScript, CSS, and XML, with a single codebase and direct access to native APIs.
Hybrid Mobile App Development With Cordova
Hybrid Mobile App Development With CordovaLohith Goudagere Nagaraj The document discusses hybrid mobile app development, detailing the differences between native apps, hybrid apps, and web mobile apps, and introduces Apache Cordova as a framework for cross-platform development. It outlines the installation prerequisites, including Node.js and Cordova, and provides commands for creating and managing applications across multiple platforms. The author, Lohith GN, is a Microsoft MVP and a technical evangelist, sharing his expertise in mobile development.
Building Web Apps & APIs With Node JS
Building Web Apps & APIs With Node JSLohith Goudagere Nagaraj The document provides an overview of Node.js, describing it as an open-source, cross-platform JavaScript runtime environment that interprets JavaScript using Google’s V8 engine. It highlights the advantages of using Node.js, such as familiarity with JavaScript, speed, extensive tooling, and support for real-time applications. The document also includes a brief mention of Express.js and MongoDB with Mongoose, indicating practical demonstrations of these technologies.
Even Quicker Development with Xamarin Forms Using Telerik UI for Xamarin
Even Quicker Development with Xamarin Forms Using Telerik UI for XamarinLohith Goudagere Nagaraj The document covers a webinar on developing modern cross-platform mobile apps using Xamarin.Forms and Telerik UI. It highlights various UI components offered by Telerik for Xamarin, including charts, listviews, dataforms, sidedrawers, and calendars, detailing their key features and functionalities. The presentation is hosted by Lohith Kashyapa and Nish Anil, both affiliated with Progress Software and Microsoft.
You Know Angular 2, You Know Native Mobile App Development
You Know Angular 2, You Know Native Mobile App DevelopmentLohith Goudagere Nagaraj This document introduces NativeScript, a framework that enables the development of native mobile apps using Angular 2.0 and TypeScript, allowing developers to leverage existing web skills while achieving high performance on iOS and Android. It highlights features such as shared UI code, full access to platform APIs, and the ability to create rich native user interfaces. Additionally, it encourages exploration of NativeScript through app store examples and community engagement.
Connecting your .Net Applications to NoSQL Databases - MongoDB & Cassandra
Connecting your .Net Applications to NoSQL Databases - MongoDB & CassandraLohith Goudagere Nagaraj The document discusses various ways to connect .NET applications to NoSQL databases like MongoDB and Cassandra. It covers client SDK APIs, REST/SOAP APIs, and SQL-based connectivity options. For SQL connectivity, the document explains that Progress DataDirect drivers normalize the NoSQL data model to expose it through SQL. Examples demonstrate connecting to MongoDB and Cassandra using the MongoDB and Cassandra .NET drivers, their REST APIs, and Progress DataDirect's ODBC drivers with SQL. The document concludes that SQL connectivity requires data normalization but offers familiar skills and easy BI integration.
Angular JS 2.0 & React with Kendo UI
Angular JS 2.0 & React with Kendo UILohith Goudagere Nagaraj The document discusses Angular 2.0, React, and Kendo UI. It provides an overview of these frameworks and libraries and demonstrates how Kendo UI can be used with Angular 2.0 and React. Specifically, it discusses integrating Kendo UI components like buttons, sliders, and dropdowns into applications built with Angular 2.0 and React.
Seamless Access to Data from BI Tools using DataDirect Cloud
Seamless Access to Data from BI Tools using DataDirect CloudLohith Goudagere Nagaraj The document discusses accessing data from business intelligence (BI) tools using DataDirect Cloud (D2C). It introduces D2C and how to configure data sources within it. It then explains how to access data from D2C using various protocols - via ODBC from QlikView, via JDBC from Yellowfin, and via OData from Microsoft Power BI. The summary encourages trying out D2C to access data from BI tools.
The Bleeding Edge - Whats New in Angular 2
The Bleeding Edge - Whats New in Angular 2Lohith Goudagere Nagaraj Angular 2 introduces significant changes from Angular 1 including being faster, supporting mobile with features like smooth scrolling, and allowing flexible development in JavaScript, TypeScript, or Dart. Key changes are that Angular 2 uses ES6 modules instead of Angular's own modules, most directives now databind to element properties instead of existing, and everything is a component. The presenter then offers to demonstrate some Angular 2 code.
Introduction to UWP - Universal Windows Platform Application Development
Introduction to UWP - Universal Windows Platform Application DevelopmentLohith Goudagere Nagaraj The document discusses the Universal Windows Platform (UWP), highlighting its ability to unify app development across various devices including phones, tablets, desktops, and Xbox. It emphasizes the use of a single SDK and adaptive user interfaces, allowing apps to be built once and deployed across multiple device families. Additionally, it mentions the UWP's capability for independent updates and the use of diverse programming languages and technologies.
Cross Platform Web Applications Using ASP.NET Core 1.0
Cross Platform Web Applications Using ASP.NET Core 1.0Lohith Goudagere Nagaraj The document provides an overview of ASP.NET Core 1.0, emphasizing its cross-platform capabilities on Windows, Linux, and OSX, and highlighting its open-source nature. It discusses the integration with .NET Framework 4.6, various components like the next-gen JIT, and back-end tools for development. Additionally, it outlines setup procedures for developing on Linux and the use of Kestrel as the web server.
Build Leaner, Faster Web Applications with ASP.NET
Build Leaner, Faster Web Applications with ASP.NETLohith Goudagere Nagaraj The document discusses .NET Framework 4.6 and .NET Core 1.0. .NET Framework 4.6 provides a full-featured .NET implementation for Windows, while .NET Core 1.0 provides a cross-platform implementation of .NET developed in an open source manner. Both frameworks include innovations like the next generation JIT compiler RyuJIT and SIMD, as well as shared runtime components, compilers, and libraries. ASP.NET Core 1.0 introduces a modular, cross-platform version of ASP.NET that is optimized for server and cloud workloads and allows easier transition from on-premises to cloud applications.
JavaScript Task Runners - Gulp & Grunt
JavaScript Task Runners - Gulp & GruntLohith Goudagere Nagaraj This document discusses JavaScript task runners Gulp and Grunt. It describes common web development tasks like compiling Sass/Less to CSS, concatenating and minifying JavaScript files. Task runners automate repetitive tasks and are also called build systems. Gulp is a streaming build system while Grunt uses configuration over code. Both are useful for modern front-end workflows involving preprocessors, package managers, and building/optimizing assets.
Visual Studio 2015 - Whats New ?
Visual Studio 2015 - Whats New ?Lohith Goudagere Nagaraj Visual Studio 2015 introduces a new setup experience, the ability to sign into multiple accounts, target multiple platforms including Xamarin mobile apps and Unity games, connect apps to Azure and other services, customize window layouts, use live code analysis with Roslyn, share projects between apps, and get IntelliSense for Bower and NPM packages directly in the code editor. The document provides an overview of new features in Visual Studio 2015 presented by Microsoft MVP Lohith G N.
Introduction to React JS
Introduction to React JSLohith Goudagere Nagaraj This document introduces React JS, a JavaScript library for building user interfaces. It discusses that React uses a virtual DOM for efficient updates, implements one-way reactive data flow, and uses composable components. Key aspects of React covered include JSX syntax, the component lifecycle, managing component state, and thinking in React by breaking down requirements into UI components.
Online Spreadsheet for your Web Applications using Kendo UI
Online Spreadsheet for your Web Applications using Kendo UILohith Goudagere Nagaraj This document discusses Kendo UI, an online spreadsheet tool using Kendo UI. It provides an overview of Kendo UI, including what it includes like widgets, frameworks and data visualization. It then discusses the new spreadsheet widget in beta, highlighting key features like cell formatting, multiple sheets and merging cells. Finally, it briefly mentions experimental Angular 2 support and new web component support in Kendo UI.
NativeScript + Push Notifications
NativeScript + Push NotificationsLohith Goudagere Nagaraj The document introduces NativeScript, a framework for building native mobile applications using JavaScript, CSS, and XML with a single code base. It covers the integration of push notifications through Telerik Backend, highlighting the ease of use and flexibility of the platform. The document also outlines steps to get started with NativeScript and emphasizes its capability to access native APIs and manage cross-platform differences in a straightforward manner.
10 Useful New Features of ECMA Script 6
10 Useful New Features of ECMA Script 6Lohith Goudagere Nagaraj ES6 introduced 10 new features to the JavaScript language including let and const keywords for block scoping, default parameters, template strings, arrow functions, rest parameters, generators, maps, classes, modules, and more. While feature complete in 2014 and standardized in 2015, browser support is still evolving as vendors implement the new standards. Transpilers like Babel can convert ES6 code to ES5 to provide support across browsers.
New Enterprisre Capabilities in Telerik Platform
New Enterprisre Capabilities in Telerik PlatformLohith Goudagere Nagaraj This document introduces new enterprise mobile capabilities with Telerik Platform, including data connectors, Screen Builder for visually building screens, offline support for caching and syncing data, AppManager LiveSync for pushing updates to apps, building native Android and iOS apps with NativeScript, and application templates to help jumpstart development. It discusses key challenges enterprises face in mobile development and how Telerik Platform addresses these challenges through its open and modular architecture for designing, building, connecting, testing, managing, measuring and deploying enterprise mobile apps.
Creating Custom HTML Helpers in ASP.NET MVC
Creating Custom HTML Helpers in ASP.NET MVCLohith Goudagere Nagaraj This document discusses custom HTML helpers in ASP.NET MVC. It begins by explaining what HTML helpers are and how they avoid tedious HTML tagging. It then outlines some standard helpers like label, textbox, and dropdown list helpers. The document demonstrates how to create custom helpers using @helper, static methods, and extension methods. It concludes by thanking the audience and providing contact information.
Ad
Recently uploaded (20)
OpenPOWER Foundation & Open-Source Core Innovations
OpenPOWER Foundation & Open-Source Core InnovationsIBM penPOWER offers a fully open, royalty-free CPU architecture for custom chip design.
It enables both lightweight FPGA cores (like Microwatt) and high-performance processors (like POWER10).
Developers have full access to source code, specs, and tools for end-to-end chip creation.
It supports AI, HPC, cloud, and embedded workloads with proven performance.
Backed by a global community, it fosters innovation, education, and collaboration.
Cluster-Based Multi-Objective Metamorphic Test Case Pair Selection for Deep N...
Cluster-Based Multi-Objective Metamorphic Test Case Pair Selection for Deep N...janeliewang985 the slides of the MP selection approach CMPS
AI VIDEO MAGAZINE - June 2025 - r/aivideo
AI VIDEO MAGAZINE - June 2025 - r/aivideo1pcity Studios, Inc AI VIDEO MAGAZINE - r/aivideo community newsletter – Exclusive Tutorials: How to make an AI VIDEO from scratch, PLUS: How to make AI MUSIC, Hottest ai videos of 2025, Exclusive Interviews, New Tools, Previews, and MORE - JUNE 2025 ISSUE -
Salesforce Summer '25 Release Frenchgathering.pptx.pdf
Salesforce Summer '25 Release Frenchgathering.pptx.pdfyosra Saidani Salesforce Summer '25 Release Frenchgathering.pptx.pdf
Lessons Learned from Developing Secure AI Workflows.pdf
Lessons Learned from Developing Secure AI Workflows.pdfPriyanka Aash Lessons Learned from Developing Secure AI Workflows
"How to survive Black Friday: preparing e-commerce for a peak season", Yurii ...
"How to survive Black Friday: preparing e-commerce for a peak season", Yurii ...Fwdays We will explore how e-commerce projects prepare for the busiest time of the year, which key aspects to focus on, and what to expect. We’ll share our experience in setting up auto-scaling, load balancing, and discuss the loads that Silpo handles, as well as the solutions that help us navigate this season without failures.
MuleSoft for AgentForce : Topic Center and API Catalog
MuleSoft for AgentForce : Topic Center and API Catalogshyamraj55 This presentation dives into how MuleSoft empowers AgentForce with organized API discovery and streamlined integration using Topic Center and the API Catalog. Learn how these tools help structure APIs around business needs, improve reusability, and simplify collaboration across teams. Ideal for developers, architects, and business stakeholders looking to build a connected and scalable API ecosystem within AgentForce.
AI vs Human Writing: Can You Tell the Difference?
AI vs Human Writing: Can You Tell the Difference?Shashi Sathyanarayana, Ph.D This slide illustrates a side-by-side comparison between human-written, AI-written, and ambiguous content. It highlights subtle cues that help readers assess authenticity, raising essential questions about the future of communication, trust, and thought leadership in the age of generative AI.
Coordinated Disclosure for ML - What's Different and What's the Same.pdf
Coordinated Disclosure for ML - What's Different and What's the Same.pdfPriyanka Aash Coordinated Disclosure for ML - What's Different and What's the Same
UserCon Belgium: Honey, VMware increased my bill
UserCon Belgium: Honey, VMware increased my billstijn40 VMware’s pricing changes have forced organizations to rethink their datacenter cost management strategies. While FinOps is commonly associated with cloud environments, the FinOps Foundation has recently expanded its framework to include Scopes—and Datacenter is now officially part of the equation. In this session, we’ll map the FinOps Framework to a VMware-based datacenter, focusing on cost visibility, optimization, and automation. You’ll learn how to track costs more effectively, rightsize workloads, optimize licensing, and drive efficiency—all without migrating to the cloud. We’ll also explore how to align IT teams, finance, and leadership around cost-aware decision-making for on-prem environments. If your VMware bill keeps increasing and you need a new approach to cost management, this session is for you!
cnc-processing-centers-centateq-p-110-en.pdf
cnc-processing-centers-centateq-p-110-en.pdfAmirStern2 מרכז עיבודים תעשייתי בעל 3/4/5 צירים, עד 22 החלפות כלים עם כל אפשרויות העיבוד הדרושות. בעל שטח עבודה גדול ומחשב נוח וקל להפעלה בשפה העברית/רוסית/אנגלית/ספרדית/ערבית ועוד..
מסוגל לבצע פעולות עיבוד שונות המתאימות לענפים שונים: קידוח אנכי, אופקי, ניסור, וכרסום אנכי.
Smarter Aviation Data Management: Lessons from Swedavia Airports and Sweco
Smarter Aviation Data Management: Lessons from Swedavia Airports and SwecoSafe Software Managing airport and airspace data is no small task, especially when you’re expected to deliver it in AIXM format without spending a fortune on specialized tools. But what if there was a smarter, more affordable way?
Join us for a behind-the-scenes look at how Sweco partnered with Swedavia, the Swedish airport operator, to solve this challenge using FME and Esri.
Learn how they built automated workflows to manage periodic updates, merge airspace data, and support data extracts – all while meeting strict government reporting requirements to the Civil Aviation Administration of Sweden.
Even better? Swedavia built custom services and applications that use the FME Flow REST API to trigger jobs and retrieve results – streamlining tasks like securing the quality of new surveyor data, creating permdelta and baseline representations in the AIS schema, and generating AIXM extracts from their AIS data.
To conclude, FME expert Dean Hintz will walk through a GeoBorders reading workflow and highlight recent enhancements to FME’s AIXM (Aeronautical Information Exchange Model) processing and interpretation capabilities.
Discover how airports like Swedavia are harnessing the power of FME to simplify aviation data management, and how you can too.
Techniques for Automatic Device Identification and Network Assignment.pdf
Techniques for Automatic Device Identification and Network Assignment.pdfPriyanka Aash Techniques for Automatic Device Identification and Network Assignment
Wenn alles versagt - IBM Tape schützt, was zählt! Und besonders mit dem neust...
Wenn alles versagt - IBM Tape schützt, was zählt! Und besonders mit dem neust...Josef Weingand IBM LTO10
Mastering AI Workflows with FME by Mark Döring
Mastering AI Workflows with FME by Mark DöringSafe Software Harness the full potential of AI with FME: From creating high-quality training data to optimizing models and utilizing results, FME supports every step of your AI workflow. Seamlessly integrate a wide range of models, including those for data enhancement, forecasting, image and object recognition, and large language models. Customize AI models to meet your exact needs with FME’s powerful tools for training, optimization, and seamless integration
Curietech AI in action - Accelerate MuleSoft development
Curietech AI in action - Accelerate MuleSoft developmentshyamraj55 CurieTech AI in Action – Accelerate MuleSoft Development
Overview:
This presentation demonstrates how CurieTech AI’s purpose-built agents empower MuleSoft developers to create integration workflows faster, more accurately, and with less manual effort
linkedin.com
+12
curietech.ai
+12
meetups.mulesoft.com
+12
.
Key Highlights:
Dedicated AI agents for every stage: Coding, Testing (MUnit), Documentation, Code Review, and Migration
curietech.ai
+7
curietech.ai
+7
medium.com
+7
DataWeave automation: Generate mappings from tables or samples—95%+ complete within minutes
linkedin.com
+7
curietech.ai
+7
medium.com
+7
Integration flow generation: Auto-create Mule flows based on specifications—speeds up boilerplate development
curietech.ai
+1
medium.com
+1
Efficient code reviews: Gain intelligent feedback on flows, patterns, and error handling
youtube.com
+8
curietech.ai
+8
curietech.ai
+8
Test & documentation automation: Auto-generate MUnit test cases, sample data, and detailed docs from code
curietech.ai
+5
curietech.ai
+5
medium.com
+5
Why Now?
Achieve 10× productivity gains, slashing development time from hours to minutes
curietech.ai
+3
curietech.ai
+3
medium.com
+3
Maintain high accuracy with code quality matching or exceeding manual efforts
curietech.ai
+2
curietech.ai
+2
curietech.ai
+2
Ideal for developers, architects, and teams wanting to scale MuleSoft projects with AI efficiency
Conclusion:
CurieTech AI transforms MuleSoft development into an AI-accelerated workflow—letting you focus on innovation, not repetition.
" How to survive with 1 billion vectors and not sell a kidney: our low-cost c...
" How to survive with 1 billion vectors and not sell a kidney: our low-cost c...Fwdays Let's talk about our history. How we started the project with a small vector database of less than 2 million records. Later, we received a request for +100 million records, then another +100... And so gradually we reached almost 1 billion. Standard tools were quickly running out of steam - we were running into performance, index size, and very limited resources. After a long series of trials and errors, we built our own low-cost cluster, which today stably processes thousands of queries to more than 1B vectors.
The Future of Product Management in AI ERA.pdf
The Future of Product Management in AI ERA.pdfAlyona Owens Hi, I’m Aly Owens, I have a special pleasure to stand here as over a decade ago I graduated from CityU as an international student with an MBA program. I enjoyed the diversity of the school, ability to work and study, the network that came with being here, and of course the price tag for students here has always been more affordable than most around.
Since then I have worked for major corporations like T-Mobile and Microsoft and many more, and I have founded a startup. I've also been teaching product management to ensure my students save time and money to get to the same level as me faster avoiding popular mistakes. Today as I’ve transitioned to teaching and focusing on the startup, I hear everybody being concerned about Ai stealing their jobs… We’ll talk about it shortly.
But before that, I want to take you back to 1997. One of my favorite movies is “Fifth Element”. It wowed me with futuristic predictions when I was a kid and I’m impressed by the number of these predictions that have already come true. Self-driving cars, video calls and smart TV, personalized ads and identity scanning. Sci-fi movies and books gave us many ideas and some are being implemented as we speak. But we often get ahead of ourselves:
Flying cars,Colonized planets, Human-like AI: not yet, Time travel, Mind-machine neural interfaces for everyone: Only in experimental stages (e.g. Neuralink).
Cyberpunk dystopias: Some vibes (neon signs + inequality + surveillance), but not total dystopia (thankfully).
On the bright side, we predict that the working hours should drop as Ai becomes our helper and there shouldn’t be a need to work 8 hours/day. Nobody knows for sure but we can require that from legislation. Instead of waiting to see what the government and billionaires come up with, I say we should design our own future.
So, we as humans, when we don’t know something - fear takes over. The same thing happened during the industrial revolution. In the Industrial Era, machines didn’t steal jobs—they transformed them but people were scared about their jobs. The AI era is making similar changes except it feels like robots will take the center stage instead of a human. First off, even when it comes to the hottest space in the military - drones, Ai does a fraction of work. AI algorithms enable real-time decision-making, obstacle avoidance, and mission optimization making drones far more autonomous and capable than traditional remote-controlled aircraft. Key technologies include computer vision for object detection, GPS-enhanced navigation, and neural networks for learning and adaptation. But guess what? There are only 2 companies right now that utilize Ai in drones to make autonomous decisions - Skydio and DJI.
HTML5 Charting in ASP.NET using RadHtmlChart
- 1. Today’s session will be recorded and available 24/7 on http://telerikhelper.net facebook.com/telerik @telerik HTML5 Charting in ASP.NET
- 2. Introduction Lohith G N Microsoft MVP, MCP Developer Evangelist, Telerik Email: [email protected] Twitter: @kashyapa Blog: http://www.kashyapas.com Blog: http://telerikhelper.net
- 3. Roadmap for Today HTML5 Charting RadControls RadHtmlChart Demo
- 4. Webinar Giveaway • 2 attendee will receive .NET Ninja T-Shirt • The Winner will be announced telerikhelper.net in a blog post
- 6. HTML5 One Web For All – W3C
- 7. Visualization Techniques SVG Scalable Vector Graphics Vector Based Graphics for Web XML Format Zoom or Resize – no loss Every Element/Attribute can be animated W3C recommendation Integrates with DOM Ideal for charts Canvas 2D drawing surface Use JS API to draw Raster Based Graphics Ideal for large scale graphical applications like Games
- 8. Demo SVG & Canvas in action
- 9. RadControls for ASP.NET AJAX
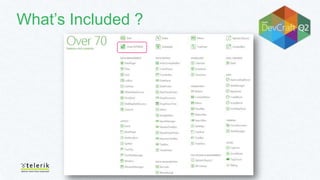
- 10. RadControls for ASP.NET AJAX Development toolset 70 ASP.NET AJAX Controls Rapid UI Development
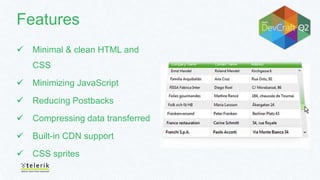
- 11. Features Minimal & clean HTML and CSS Minimizing JavaScript Reducing Postbacks Compressing data transferred Built-in CDN support CSS sprites
- 13. HTML5 Charting in ASP.NET AJAX
- 14. RadHtmlChart Charting Component Based on HTML5 All Chart Types Client side rendering SVG output
- 15. Features Any Essential Chart Type Pie DoNut Line Area Bar Column Scatter ScatterLine Bubble CandleStick
- 17. Features Support Various Data Types SVG output – Modern Browsers Fallback to VML – Older Browsers Easy Customization – Appearance Interactions – Animations/Highlighting Client Side Events/Rich Server Side API
- 18. Features Multiple Series & Combination Charts
- 19. Browser Support
- 21. Email Twitter [email protected] @kashyapa Download RadControls for ASP.NET AJAX at http://www.telerik.com/products/aspnet-ajax.aspx Q & A