SlideShare a Scribd company logo
Algorithms
(Supervised + Unsupervised)
Hello!
I am Hridyesh Bisht
I am here because I am very intrigued by algorithms.
You can find more about me at @hridyesh_bisht
What do you mean by an Algorithm?
An algorithm is a set of well-defined steps or rules that you need to follow to obtain a predetermined
result.
3
Credits: https://cstoredecisions.com/wp-content/uploads/2015/10/PBJ-Sandwich.jpg
What could be an Algorithm Here?
4
Credits:https://mir-s3-cdn-cf.behance.net/project_modules/max_1200/84c30761141211.5b860b055a562.jpg
There are 4 components to an algorithm,
1.Input (Bread, Peanut Butter and Jelly).
2.Algorithm processing or a set of instructions.
3. Output i.e: Pb&J sandwich
4.Testing, to make sure it taste alright.
A few Important Terminologies
1. Independent variables: A change in the
independent variable directly causes a
change in the dependent variable. The effect
on the dependent variable is measured and
recorded.
1. Dependent variable: When you take data
in an experiment, the dependent variable is
the one being measured.
5
Credits: https://explorable.com/sites/default/files/independent-and-dependent-variable2.png
1. Features: they are individual
independent variables which acts as
the input in the system. Prediction
models uses these features to make
predictions.
1. Label: they are the final output or
target Output. It can also be
considered as the output classes. We
obtain labels as output when provided
with features as input.
6
Credits: https://3.bp.blogspot.com/-UhZht-
S1fwU/W6D0MazazxI/AAAAAAAABQU/X-
LTeXBeYS0eeyPkUMuKBioUrX-BWnYzACLcBGAs/s1600/l.jpg
A few Important Terminologies
1.
Supervised Algorithms
In supervised learning, algorithms learn from
labeled data. After understanding the data, the
algorithm determines which label should be
given to new data by associating patterns to the
unlabeled new data.
Supervised learning uses a training set to teach
models to yield the desired output. This training
dataset includes inputs and correct outputs,
which allow the model to learn over time.
8
Credits: https://dataaspirant.com/wp-content/uploads/2014/09/Classification-and-Regression-
dataaspirant.png
A. Linear Regression
Linear regression is a statistical model that examines the linear
relationship between two or more variables a dependent variable
and independent variable(s). Simple Linear Regression predicts
Y on the basis of a single Predictor variable X. It assumes that
there is a linear relationship between X and Y.
y = θ0+ θ1.X, where θ0 = Intercept at Y and θ1 = slope.
1. θ0 and θ1 are known as model coefficients or
parameters
2. θ0 is the expected value of Y when X=0.
3. Θ1 is the average increase in Y as per one unit
increase in X.
9
Credits: https://miro.medium.com/max/1200/1*N1-K-A43_98pYZ27fnupDA.jpeg
What do you mean by a straight line?
Consider Amount of Peanut butter on X axis
and Taste on Y axis. Now we usually want a fair
balance between Jam and Peanut butter, so we
could draw a line between the two axis.
10
Credits:https://i.pinimg.com/474x/1e/4b/33/1e4b33db315bd01865b542a768506d3a.jpg
11
What if there are errors?
Ordinary Least Squares is a method in Linear Regression for
estimating the unknown parameters by creating a model
which will minimize the sum of the squared errors between
the observed data and the predicted one.
It works by making the total of the square of the errors as
small as possible (that is why it is called “least squares”). So,
when we square each of those errors and add them all up, the
total is as small as possible
.
12
Credits: https://bookdown.org/sbikienga/Intro_to_stat_book/images/chap7/ols.jpg
Gradient descent
Let’s say you are at top of a hill and you want to
reach the bottom of the hill. You have two options
to reach the bottom or minima of the hill. You could
either,
1. Take small steps and cover small distance per
step. This will ensure we reach the bottom, it
might be time consuming but it guarantees
reaching the bottom.
2. Take a snowboard and cover large distances.
This will ensure that you are really quick but
it might make you miss the bottom and go
further away from the bottom.
13
Credits: https://www.fromthegenesis.com/wp-
content/uploads/2019/10/gd1510.png
For gradient descent, the learning rate( size of
steps ) is a hyper parameter.
As we approach a local minimum , gradient
descent will automatically take smaller steps. So,
no need to decrease alpha over time.
14
B. classification
Classification algorithms used in machine learning
utilize input training data for the purpose of predicting
the likelihood or probability that the data that follows
will fall into one of the predetermined categories.
A.Binary Classification: we have only two class
labels.For example our spam email classification,
either our email is spam or not spam depending on our
value of classification threshold.
B.Multi class Classification: we have more than two
class labels. For example our ingredients in a
sandwich.
15
Credits: https://securonix.com/web/wp-content/uploads/2018/06/meme.png
A. Logistic Regression
We use logistic regression for the binary
classification of data-points.
Two of the important parts of logistic regression
are Hypothesis and Sigmoid Curve. With the
help of this hypothesis, we can derive the
likelihood of the event. The data generated from
this hypothesis can fit into the log function that
creates an S-shaped curve known as
“sigmoid”.
16
Credits: https://www.machinelearningplus.com/wp-
content/uploads/2017/09/linear_vs_logistic_regression.jpg
b. Decision Tree
A decision tree represents a procedure for
classifying categorical data based on their
attributes.
The tree should be compact, so that it
generalizes well to non-training data without
overfitting and it should predict labels of
training data accurately.
17
Credits:
https://miro.medium.com/max/1430/1*rSQIIAboJftqAv_BReNipg.png
2.Unsupervised Learning
Unsupervised learning use machine learning algorithms to analyze and cluster unlabeled datasets. These
algorithms discover hidden patterns or data groupings without the need for human intervention.
19
Credits: https://i.huffpost.com/gen/1257895/images/o-PEANUT-BUTTER-JELLY-facebook.jpg
Clustering
Clustering is a division of data into groups of
similar objects. With each group, called a cluster.
The quality of a clustering result depends on both
the similarity measure used by the method and its
implementation.And, the method’s ability to
discover some or all of the hidden patterns.
20
Credits: http://alexhwilliams.info/itsneuronalblog/img/clustering/clustering-
consistency.png
A. K-Nearest Neighbour
K-Nearest Neighbour (K-NN) is a simple
algorithm that stores all the available cases and
classifies the new data or case based on a
similarity measure. It queries the k points that are
closest to the sample point and returns the most
frequently used label of their class as the predicted
label.
21
Credits: https://cdn-images-1.medium.com/max/1600/1*2zYNhLc522h0zftD1zDh2g.png
How to choose K?
k is a free “hyperparameter” of the algorithm.
1. One option is to try different values of k when evaluating on
test data.
2. Use the validation data as “pseudo-test data” to tune (choose
best) k to do final evaluation on the test data only once
While Euclidean distance is useful in low dimensions, it doesn’t work
well in high dimensions and for categorical variables. As it ignores
the similarity between attributes.
22
1.Under fitting: When our model can’t find the pattern in the data this maybe due to various reasons
such as less data fed to the model for training.
2.Over fitting: When our model can find the pattern in our test data set and not in every data set this
maybe due to too much details or features in the data set.
23
Credits: https://1.cms.s81c.com/sites/default/files/2021-03-03/model-over-fitting.png
3.
Sage maker
At its core, SageMaker is a fully managed
service that provides the tools to build, train
and deploy machine learning models.
It has some components in it such as manage
notebooks and helping label and train models,
deploy models with a variety of ways to use
endpoints.
25
Credits: https://www.inawisdom.com/wp-
content/uploads/2018/06/SageMaker_Icon_Large.jpg
Building model
You can select more and more powerful
hardware along with the elastic interface, which
allows you to attach things such as GPUs or
graphic processing units to your notebook set up.
A point to remember SageMaker is shared by
everybody with this Amazon account, not just
IAM account.
26
Deploying The model
Coming out of the training job and especially
coming out of the notebook, you're also able
to use the Python objects or rather the
framework's objects and import those into
other machine learning frameworks.
So don't think you need to use SageMaker's
end point system in order to use your models.
It could actually be directly coded into your
existing applications, especially after an
export.
27
Credits: https://docs.aws.amazon.com/sagemaker/latest/dg/images/model-
monitor-how-it-works-2.jpg
Data Wrangler
Data Wrangler is a way to fast-track the loading and normalizing of data sets.
1. Data Pipelines enables you to integrate clean that cleansing a normalization process with
modeling and combine them into a workflow that could be shared across teams in a very visual
interface.
2. The SageMaker Feature Store enables you to save all of this process, the data loading, selection,
cleansing exploration, and visualization processes as a library so they can be used and reused by
other team members.
So the Data Wrangler service lets you complete each step of a data preparation workflow. So you can
have data ready for modeling sooner.
28
Ground Truth?
Amazon offers a semi-automated, semi-human
driven solution through Ground Truth. This
section of the platform actually allows you to
annotate your data sets by creating workflows.
And these workflows could either use some of
the previously mentioned machine learning
models.
Amazon labeled its data preparation stage,
Ground Truth.
29
Credits: https://d1.awsstatic.com/r2018/r/SageMaker/infographic-
Ground_Truth.5c5b9bd46222825b994ca05356322fc53e71755d.png
30
THANKS!
Any questions?
You can find me at @hridyesh_bisht
Ad

Recommended

PPTX
Algorithms Design Patterns
Ashwin Shiv
 
PDF
Evolving Reinforcement Learning Algorithms, JD. Co-Reyes et al, 2021
Chris Ohk
 
PPTX
Algorithms and Programming
Melanie Knight
 
PDF
Adversarial Reinforced Learning for Unsupervised Domain Adaptation
taeseon ryu
 
PPTX
Reinforcement Learning
DongHyun Kwak
 
PPTX
08 neural networks
ankit_ppt
 
PPTX
Hands-On Machine Learning with Scikit-Learn and TensorFlow - Chapter8
Hakky St
 
PPTX
Problem Formulation in Artificial Inteligence Projects
Dr. C.V. Suresh Babu
 
PPTX
Ml10 dimensionality reduction-and_advanced_topics
ankit_ppt
 
PDF
L05 language model_part2
ananth
 
PDF
Generative Adversarial Networks : Basic architecture and variants
ananth
 
PPTX
An Introduction to Reinforcement Learning - The Doors to AGI
Anirban Santara
 
PDF
Continuous Control with Deep Reinforcement Learning, lillicrap et al, 2015
Chris Ohk
 
PDF
Machine Learning Lecture 2 Basics
ananth
 
PDF
Trust Region Policy Optimization, Schulman et al, 2015
Chris Ohk
 
PDF
Mathematical Background for Artificial Intelligence
ananth
 
PDF
Dimensionality Reduction
Saad Elbeleidy
 
PDF
Feature Reduction Techniques
Vishal Patel
 
PPTX
InfoGAIL
Sungjoon Choi
 
PDF
GBM theory code and parameters
Venkata Reddy Konasani
 
PDF
Foundations: Artificial Neural Networks
ananth
 
PDF
L06 stemmer and edit distance
ananth
 
PDF
Proximal Policy Optimization Algorithms, Schulman et al, 2017
Chris Ohk
 
PDF
Machine learning
Andrea Iacono
 
PDF
Reinforcement learning
DongHyun Kwak
 
PPTX
Matrix decomposition and_applications_to_nlp
ankit_ppt
 
PPTX
K Nearest Neighbor Algorithm
Tharuka Vishwajith Sarathchandra
 
PDF
Dueling Network Architectures for Deep Reinforcement Learning
Yoonho Lee
 
PDF
Top Machine Learning Algorithms Used By AI Professionals ARTiBA.pdf
Artificial Intelligence Board of America
 
PDF
Machine Learning Algorithms Introduction.pdf
Vinodh58
 

More Related Content

What's hot (20)

PPTX
Ml10 dimensionality reduction-and_advanced_topics
ankit_ppt
 
PDF
L05 language model_part2
ananth
 
PDF
Generative Adversarial Networks : Basic architecture and variants
ananth
 
PPTX
An Introduction to Reinforcement Learning - The Doors to AGI
Anirban Santara
 
PDF
Continuous Control with Deep Reinforcement Learning, lillicrap et al, 2015
Chris Ohk
 
PDF
Machine Learning Lecture 2 Basics
ananth
 
PDF
Trust Region Policy Optimization, Schulman et al, 2015
Chris Ohk
 
PDF
Mathematical Background for Artificial Intelligence
ananth
 
PDF
Dimensionality Reduction
Saad Elbeleidy
 
PDF
Feature Reduction Techniques
Vishal Patel
 
PPTX
InfoGAIL
Sungjoon Choi
 
PDF
GBM theory code and parameters
Venkata Reddy Konasani
 
PDF
Foundations: Artificial Neural Networks
ananth
 
PDF
L06 stemmer and edit distance
ananth
 
PDF
Proximal Policy Optimization Algorithms, Schulman et al, 2017
Chris Ohk
 
PDF
Machine learning
Andrea Iacono
 
PDF
Reinforcement learning
DongHyun Kwak
 
PPTX
Matrix decomposition and_applications_to_nlp
ankit_ppt
 
PPTX
K Nearest Neighbor Algorithm
Tharuka Vishwajith Sarathchandra
 
PDF
Dueling Network Architectures for Deep Reinforcement Learning
Yoonho Lee
 
Ml10 dimensionality reduction-and_advanced_topics
ankit_ppt
 
L05 language model_part2
ananth
 
Generative Adversarial Networks : Basic architecture and variants
ananth
 
An Introduction to Reinforcement Learning - The Doors to AGI
Anirban Santara
 
Continuous Control with Deep Reinforcement Learning, lillicrap et al, 2015
Chris Ohk
 
Machine Learning Lecture 2 Basics
ananth
 
Trust Region Policy Optimization, Schulman et al, 2015
Chris Ohk
 
Mathematical Background for Artificial Intelligence
ananth
 
Dimensionality Reduction
Saad Elbeleidy
 
Feature Reduction Techniques
Vishal Patel
 
InfoGAIL
Sungjoon Choi
 
GBM theory code and parameters
Venkata Reddy Konasani
 
Foundations: Artificial Neural Networks
ananth
 
L06 stemmer and edit distance
ananth
 
Proximal Policy Optimization Algorithms, Schulman et al, 2017
Chris Ohk
 
Machine learning
Andrea Iacono
 
Reinforcement learning
DongHyun Kwak
 
Matrix decomposition and_applications_to_nlp
ankit_ppt
 
K Nearest Neighbor Algorithm
Tharuka Vishwajith Sarathchandra
 
Dueling Network Architectures for Deep Reinforcement Learning
Yoonho Lee
 

Similar to Machine learning Algorithms with a Sagemaker demo (20)

PDF
Top Machine Learning Algorithms Used By AI Professionals ARTiBA.pdf
Artificial Intelligence Board of America
 
PDF
Machine Learning Algorithms Introduction.pdf
Vinodh58
 
PDF
AWS Certified Machine Learning Specialty
Adnan Rashid
 
PPTX
Deep learning from mashine learning AI..
premkumarlive
 
PPTX
Machine learning introduction
Anas Jamil
 
PDF
Machine learning
Dr Geetha Mohan
 
PDF
Machine learning cheat sheet
Hany Sewilam Abdel Hamid
 
PPTX
demo lecture for foundation class for btech
ROHIT738213
 
PDF
Choosing a Machine Learning technique to solve your need
GibDevs
 
PPTX
A_short_brief_on_Machine-Learning's and there types
Tayyaba Amber
 
PPTX
Machine Learning.pptx
NitinSharma134320
 
PDF
Cheatsheet supervised-learning
Steve Nouri
 
PPTX
Machine learning Method and techniques
MarkMojumdar
 
PDF
Machine learning
Mike Martinez
 
PPTX
AI_06_Machine Learning.pptx
Yousef Aburawi
 
PPTX
Reuqired ppt for machine learning algirthms and part
SiddheshMhatre27
 
PPTX
Machine Learning techniques used in AI.
ArchanaT32
 
PPTX
ML Lec 1 (1).pptx
MuhammadTalha278665
 
PDF
IRJET- Machine Learning: Survey, Types and Challenges
IRJET Journal
 
PDF
A tour of the top 10 algorithms for machine learning newbies
Vimal Gupta
 
Top Machine Learning Algorithms Used By AI Professionals ARTiBA.pdf
Artificial Intelligence Board of America
 
Machine Learning Algorithms Introduction.pdf
Vinodh58
 
AWS Certified Machine Learning Specialty
Adnan Rashid
 
Deep learning from mashine learning AI..
premkumarlive
 
Machine learning introduction
Anas Jamil
 
Machine learning
Dr Geetha Mohan
 
Machine learning cheat sheet
Hany Sewilam Abdel Hamid
 
demo lecture for foundation class for btech
ROHIT738213
 
Choosing a Machine Learning technique to solve your need
GibDevs
 
A_short_brief_on_Machine-Learning's and there types
Tayyaba Amber
 
Machine Learning.pptx
NitinSharma134320
 
Cheatsheet supervised-learning
Steve Nouri
 
Machine learning Method and techniques
MarkMojumdar
 
Machine learning
Mike Martinez
 
AI_06_Machine Learning.pptx
Yousef Aburawi
 
Reuqired ppt for machine learning algirthms and part
SiddheshMhatre27
 
Machine Learning techniques used in AI.
ArchanaT32
 
ML Lec 1 (1).pptx
MuhammadTalha278665
 
IRJET- Machine Learning: Survey, Types and Challenges
IRJET Journal
 
A tour of the top 10 algorithms for machine learning newbies
Vimal Gupta
 
Ad

More from Hridyesh Bisht (6)

PPTX
Tech-Writing-101
Hridyesh Bisht
 
PDF
Distributed Systems for Blockchain using Cloud
Hridyesh Bisht
 
PPTX
Data streaming algorithms
Hridyesh Bisht
 
PPTX
Intro to web dev
Hridyesh Bisht
 
PPTX
Bit by bit into data structures
Hridyesh Bisht
 
PPTX
Do you git it
Hridyesh Bisht
 
Tech-Writing-101
Hridyesh Bisht
 
Distributed Systems for Blockchain using Cloud
Hridyesh Bisht
 
Data streaming algorithms
Hridyesh Bisht
 
Intro to web dev
Hridyesh Bisht
 
Bit by bit into data structures
Hridyesh Bisht
 
Do you git it
Hridyesh Bisht
 
Ad

Recently uploaded (20)

PDF
624753984-Annex-A3-RPMS-Tool-for-Proficient-Teachers-SY-2024-2025.pdf
CristineGraceAcuyan
 
PDF
presentation4.pdf Intro to mcmc methodss
SergeyTsygankov6
 
PPSX
PPT1_CB_VII_CS_Ch3_FunctionsandChartsinCalc.ppsx
animaroy81
 
PPT
Reliability Monitoring of Aircrfat commerce
Rizk2
 
PDF
Boost Business Efficiency with Professional Data Entry Services
eloiacs eloiacs
 
PPTX
PPT2 W1L2.pptx.........................................
palicteronalyn26
 
DOCX
Starbucks in the Indian market through its joint venture.
sales480687
 
PPT
Camuflaje Tipos Características Militar 2025.ppt
e58650738
 
PPTX
最新版美国佐治亚大学毕业证(UGA毕业证书)原版定制
Taqyea
 
PDF
NVIDIA Triton Inference Server, a game-changing platform for deploying AI mod...
Tamanna36
 
DOCX
Artigo - Playing to Win.planejamento docx
KellyXavier15
 
PDF
Microsoft Power BI - Advanced Certificate for Business Intelligence using Pow...
Prasenjit Debnath
 
PPTX
Data Visualisation in data science for students
confidenceascend
 
PDF
Prescriptive Process Monitoring Under Uncertainty and Resource Constraints: A...
Mahmoud Shoush
 
PDF
Allotted-MBBS-Student-list-batch-2021.pdf
subhansaifi0603
 
PPTX
Model Evaluation & Visualisation part of a series of intro modules for data ...
brandonlee626749
 
PPTX
Mynd company all details what they are doing a
AniketKadam40952
 
PDF
11_L2_Defects_and_Trouble_Shooting_2014[1].pdf
gun3awan88
 
PPTX
美国毕业证范本中华盛顿大学学位证书CWU学生卡购买
Taqyea
 
PPTX
定制OCAD学生卡加拿大安大略艺术与设计大学成绩单范本,OCAD成绩单复刻
taqyed
 
624753984-Annex-A3-RPMS-Tool-for-Proficient-Teachers-SY-2024-2025.pdf
CristineGraceAcuyan
 
presentation4.pdf Intro to mcmc methodss
SergeyTsygankov6
 
PPT1_CB_VII_CS_Ch3_FunctionsandChartsinCalc.ppsx
animaroy81
 
Reliability Monitoring of Aircrfat commerce
Rizk2
 
Boost Business Efficiency with Professional Data Entry Services
eloiacs eloiacs
 
PPT2 W1L2.pptx.........................................
palicteronalyn26
 
Starbucks in the Indian market through its joint venture.
sales480687
 
Camuflaje Tipos Características Militar 2025.ppt
e58650738
 
最新版美国佐治亚大学毕业证(UGA毕业证书)原版定制
Taqyea
 
NVIDIA Triton Inference Server, a game-changing platform for deploying AI mod...
Tamanna36
 
Artigo - Playing to Win.planejamento docx
KellyXavier15
 
Microsoft Power BI - Advanced Certificate for Business Intelligence using Pow...
Prasenjit Debnath
 
Data Visualisation in data science for students
confidenceascend
 
Prescriptive Process Monitoring Under Uncertainty and Resource Constraints: A...
Mahmoud Shoush
 
Allotted-MBBS-Student-list-batch-2021.pdf
subhansaifi0603
 
Model Evaluation & Visualisation part of a series of intro modules for data ...
brandonlee626749
 
Mynd company all details what they are doing a
AniketKadam40952
 
11_L2_Defects_and_Trouble_Shooting_2014[1].pdf
gun3awan88
 
美国毕业证范本中华盛顿大学学位证书CWU学生卡购买
Taqyea
 
定制OCAD学生卡加拿大安大略艺术与设计大学成绩单范本,OCAD成绩单复刻
taqyed
 

Machine learning Algorithms with a Sagemaker demo

  • 2. Hello! I am Hridyesh Bisht I am here because I am very intrigued by algorithms. You can find more about me at @hridyesh_bisht
  • 3. What do you mean by an Algorithm? An algorithm is a set of well-defined steps or rules that you need to follow to obtain a predetermined result. 3 Credits: https://cstoredecisions.com/wp-content/uploads/2015/10/PBJ-Sandwich.jpg
  • 4. What could be an Algorithm Here? 4 Credits:https://mir-s3-cdn-cf.behance.net/project_modules/max_1200/84c30761141211.5b860b055a562.jpg There are 4 components to an algorithm, 1.Input (Bread, Peanut Butter and Jelly). 2.Algorithm processing or a set of instructions. 3. Output i.e: Pb&J sandwich 4.Testing, to make sure it taste alright.
  • 5. A few Important Terminologies 1. Independent variables: A change in the independent variable directly causes a change in the dependent variable. The effect on the dependent variable is measured and recorded. 1. Dependent variable: When you take data in an experiment, the dependent variable is the one being measured. 5 Credits: https://explorable.com/sites/default/files/independent-and-dependent-variable2.png
  • 6. 1. Features: they are individual independent variables which acts as the input in the system. Prediction models uses these features to make predictions. 1. Label: they are the final output or target Output. It can also be considered as the output classes. We obtain labels as output when provided with features as input. 6 Credits: https://3.bp.blogspot.com/-UhZht- S1fwU/W6D0MazazxI/AAAAAAAABQU/X- LTeXBeYS0eeyPkUMuKBioUrX-BWnYzACLcBGAs/s1600/l.jpg A few Important Terminologies
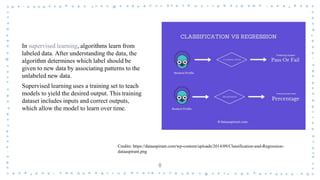
  • 8. In supervised learning, algorithms learn from labeled data. After understanding the data, the algorithm determines which label should be given to new data by associating patterns to the unlabeled new data. Supervised learning uses a training set to teach models to yield the desired output. This training dataset includes inputs and correct outputs, which allow the model to learn over time. 8 Credits: https://dataaspirant.com/wp-content/uploads/2014/09/Classification-and-Regression- dataaspirant.png
  • 9. A. Linear Regression Linear regression is a statistical model that examines the linear relationship between two or more variables a dependent variable and independent variable(s). Simple Linear Regression predicts Y on the basis of a single Predictor variable X. It assumes that there is a linear relationship between X and Y. y = θ0+ θ1.X, where θ0 = Intercept at Y and θ1 = slope. 1. θ0 and θ1 are known as model coefficients or parameters 2. θ0 is the expected value of Y when X=0. 3. Θ1 is the average increase in Y as per one unit increase in X. 9 Credits: https://miro.medium.com/max/1200/1*N1-K-A43_98pYZ27fnupDA.jpeg
  • 10. What do you mean by a straight line? Consider Amount of Peanut butter on X axis and Taste on Y axis. Now we usually want a fair balance between Jam and Peanut butter, so we could draw a line between the two axis. 10
  • 12. What if there are errors? Ordinary Least Squares is a method in Linear Regression for estimating the unknown parameters by creating a model which will minimize the sum of the squared errors between the observed data and the predicted one. It works by making the total of the square of the errors as small as possible (that is why it is called “least squares”). So, when we square each of those errors and add them all up, the total is as small as possible . 12 Credits: https://bookdown.org/sbikienga/Intro_to_stat_book/images/chap7/ols.jpg
  • 13. Gradient descent Let’s say you are at top of a hill and you want to reach the bottom of the hill. You have two options to reach the bottom or minima of the hill. You could either, 1. Take small steps and cover small distance per step. This will ensure we reach the bottom, it might be time consuming but it guarantees reaching the bottom. 2. Take a snowboard and cover large distances. This will ensure that you are really quick but it might make you miss the bottom and go further away from the bottom. 13 Credits: https://www.fromthegenesis.com/wp- content/uploads/2019/10/gd1510.png
  • 14. For gradient descent, the learning rate( size of steps ) is a hyper parameter. As we approach a local minimum , gradient descent will automatically take smaller steps. So, no need to decrease alpha over time. 14
  • 15. B. classification Classification algorithms used in machine learning utilize input training data for the purpose of predicting the likelihood or probability that the data that follows will fall into one of the predetermined categories. A.Binary Classification: we have only two class labels.For example our spam email classification, either our email is spam or not spam depending on our value of classification threshold. B.Multi class Classification: we have more than two class labels. For example our ingredients in a sandwich. 15 Credits: https://securonix.com/web/wp-content/uploads/2018/06/meme.png
  • 16. A. Logistic Regression We use logistic regression for the binary classification of data-points. Two of the important parts of logistic regression are Hypothesis and Sigmoid Curve. With the help of this hypothesis, we can derive the likelihood of the event. The data generated from this hypothesis can fit into the log function that creates an S-shaped curve known as “sigmoid”. 16 Credits: https://www.machinelearningplus.com/wp- content/uploads/2017/09/linear_vs_logistic_regression.jpg
  • 17. b. Decision Tree A decision tree represents a procedure for classifying categorical data based on their attributes. The tree should be compact, so that it generalizes well to non-training data without overfitting and it should predict labels of training data accurately. 17 Credits: https://miro.medium.com/max/1430/1*rSQIIAboJftqAv_BReNipg.png
  • 19. Unsupervised learning use machine learning algorithms to analyze and cluster unlabeled datasets. These algorithms discover hidden patterns or data groupings without the need for human intervention. 19 Credits: https://i.huffpost.com/gen/1257895/images/o-PEANUT-BUTTER-JELLY-facebook.jpg
  • 20. Clustering Clustering is a division of data into groups of similar objects. With each group, called a cluster. The quality of a clustering result depends on both the similarity measure used by the method and its implementation.And, the method’s ability to discover some or all of the hidden patterns. 20 Credits: http://alexhwilliams.info/itsneuronalblog/img/clustering/clustering- consistency.png
  • 21. A. K-Nearest Neighbour K-Nearest Neighbour (K-NN) is a simple algorithm that stores all the available cases and classifies the new data or case based on a similarity measure. It queries the k points that are closest to the sample point and returns the most frequently used label of their class as the predicted label. 21 Credits: https://cdn-images-1.medium.com/max/1600/1*2zYNhLc522h0zftD1zDh2g.png
  • 22. How to choose K? k is a free “hyperparameter” of the algorithm. 1. One option is to try different values of k when evaluating on test data. 2. Use the validation data as “pseudo-test data” to tune (choose best) k to do final evaluation on the test data only once While Euclidean distance is useful in low dimensions, it doesn’t work well in high dimensions and for categorical variables. As it ignores the similarity between attributes. 22
  • 23. 1.Under fitting: When our model can’t find the pattern in the data this maybe due to various reasons such as less data fed to the model for training. 2.Over fitting: When our model can find the pattern in our test data set and not in every data set this maybe due to too much details or features in the data set. 23 Credits: https://1.cms.s81c.com/sites/default/files/2021-03-03/model-over-fitting.png
  • 25. At its core, SageMaker is a fully managed service that provides the tools to build, train and deploy machine learning models. It has some components in it such as manage notebooks and helping label and train models, deploy models with a variety of ways to use endpoints. 25 Credits: https://www.inawisdom.com/wp- content/uploads/2018/06/SageMaker_Icon_Large.jpg
  • 26. Building model You can select more and more powerful hardware along with the elastic interface, which allows you to attach things such as GPUs or graphic processing units to your notebook set up. A point to remember SageMaker is shared by everybody with this Amazon account, not just IAM account. 26
  • 27. Deploying The model Coming out of the training job and especially coming out of the notebook, you're also able to use the Python objects or rather the framework's objects and import those into other machine learning frameworks. So don't think you need to use SageMaker's end point system in order to use your models. It could actually be directly coded into your existing applications, especially after an export. 27 Credits: https://docs.aws.amazon.com/sagemaker/latest/dg/images/model- monitor-how-it-works-2.jpg
  • 28. Data Wrangler Data Wrangler is a way to fast-track the loading and normalizing of data sets. 1. Data Pipelines enables you to integrate clean that cleansing a normalization process with modeling and combine them into a workflow that could be shared across teams in a very visual interface. 2. The SageMaker Feature Store enables you to save all of this process, the data loading, selection, cleansing exploration, and visualization processes as a library so they can be used and reused by other team members. So the Data Wrangler service lets you complete each step of a data preparation workflow. So you can have data ready for modeling sooner. 28
  • 29. Ground Truth? Amazon offers a semi-automated, semi-human driven solution through Ground Truth. This section of the platform actually allows you to annotate your data sets by creating workflows. And these workflows could either use some of the previously mentioned machine learning models. Amazon labeled its data preparation stage, Ground Truth. 29 Credits: https://d1.awsstatic.com/r2018/r/SageMaker/infographic- Ground_Truth.5c5b9bd46222825b994ca05356322fc53e71755d.png
  • 30. 30 THANKS! Any questions? You can find me at @hridyesh_bisht

Editor's Notes

  • #4: Define an algorithm Give an Peanut butter example
  • #6: New features can also be extracted from old features using a method known as ‘feature engineering’. Features are also called attributes and the number of features is dimensions
  • #11: Y axis is dependent and X axis is independent
  • #15: Hyper parameter are set in order to find ideal values of parameters, where we minimize the least squares error. For an example would be how many pb&j sandwiches could you have before you felt full.
  • #18: The construction of decision tree does not require any domain knowledge or parameter setting and therefore appropriate for exploratory knowledge discover. Entropy is a measure of uncertainty or impurity. More uncertainty, more entropy! The information gain when we divide the data using a particular feature is the reduction in entropy
  • #20: Its ability to discover similarities and differences in information make it the ideal solution for exploratory data analysis, cross-selling strategies, customer segmentation, and image recognition.
  • #28: But this is a really strong way of decoupling your machine learning and your production instance, in that your application developers and coders are able to just make an arrest call and get an inference result.
  • #31: https://aws.amazon.com/sagemaker/pricing/