what-is-machine-learning-and-its-importance-in-todays-world.pdfTemok IT Services
The document discusses machine learning as an AI method that enables computers to learn from data without explicit programming. It covers different types of machine learning, such as supervised, unsupervised, semi-supervised, and reinforcement learning, and explores its applications across various industries. The document also addresses challenges like ethical concerns, job impacts, and privacy issues related to the expansion of machine learning technologies.
This document provides an introduction to machine learning, covering various topics. It defines machine learning as a branch of artificial intelligence that uses algorithms and data to enable machines to learn. It discusses different types of machine learning, including supervised, unsupervised, and reinforcement learning. It also covers important machine learning concepts like overfitting, evaluation metrics, and well-posed learning problems. The history of machine learning is reviewed, from early work in the 1950s to recent advances in deep learning.
The document provides an introduction to machine learning, describing its definition, stages, applications across various industries such as transportation, finance, healthcare, government, and retail. It outlines different types of machine learning algorithms including supervised, unsupervised, semi-supervised, and reinforcement learning, along with their specific use cases. The content emphasizes the importance of data collection, analysis, and model training in building effective machine learning solutions.
Machine Learning is a subset of artificial intelligence that allows computers to learn without being explicitly programmed. It uses algorithms to recognize patterns in data and make predictions. The document discusses common machine learning algorithms like linear regression, logistic regression, decision trees, and k-means clustering. It also provides examples of machine learning applications such as face detection, speech recognition, fraud detection, and smart cars. Machine learning is expected to have an increasingly important role in the future.
This document provides an introduction to machine learning and data science. It discusses key concepts like supervised vs. unsupervised learning, classification algorithms, overfitting and underfitting data. It also addresses challenges like having bad quality or insufficient training data. Python and MATLAB are introduced as suitable software for machine learning projects.
The document addresses popular myths surrounding machine learning, emphasizing that it is distinct from AI and not all data is useful for training models. It highlights misconceptions about data requirements, the skills needed to develop machine learning systems, and the potential biases that can be amplified through data. Additionally, it discusses the dual-use nature of machine learning technologies and their impact on jobs, suggesting they will create new opportunities while also changing existing roles.
Supervised Machine Learning Techniques common algorithms and its applicationTara ram Goyal
The document provides an introduction to supervised machine learning, including definitions, techniques, and applications. It discusses how supervised machine learning involves training algorithms using labeled input data to make predictions on unlabeled data. Some common supervised learning algorithms mentioned are naive Bayes, decision trees, linear regression, support vector machines, and neural networks. Applications discussed include self-driving cars, online recommendations, fraud detection, and spam filtering. The key difference between supervised and unsupervised learning is that supervised learning uses labeled training data while unsupervised learning does not have pre-existing labels.
The document discusses machine learning methods including supervised learning, unsupervised learning, and reinforcement learning. It provides examples of how each method is used, such as using historical data for prediction in supervised learning and organizing unlabeled data in unsupervised learning. Random forest, an ensemble supervised learning algorithm, is also summarized. It states random forest combines decision trees for improved performance and discusses its use in sectors like banking, medicine, land use, and marketing.
Machine learning (ML) is a type of artificial intelligence that allows software to become more accurate at predicting outcomes without being explicitly programmed. ML uses historical data as input to predict new output values. Common uses of ML include recommendation engines, fraud detection, and predictive maintenance. There are four main types of ML: supervised learning where the input and output are defined, unsupervised learning which looks for patterns in unlabeled data, semi-supervised which uses some labeled and some unlabeled data, and reinforcement learning which programs an algorithm to seek rewards and avoid punishments to accomplish a goal.
This document provides an overview of machine learning. It defines machine learning as a branch of artificial intelligence that allows computers to learn without being explicitly programmed. It discusses applications such as sentiment analysis on Twitter, predicting global warming, and personalized cancer treatment. The document also covers supervised learning, unsupervised learning, common machine learning algorithms, and how to approach solving problems in machine learning. It emphasizes understanding the data and problem before selecting an appropriate algorithm. Finally, it notes that Python is a popular programming language for machine learning tasks due to its libraries for data processing, visualization, and more.
Machine learning is a scientific discipline that develops algorithms to allow systems to learn from data and improve automatically without being explicitly programmed. The document discusses several key machine learning concepts including supervised learning algorithms like decision trees and Naive Bayes classification. Decision trees use branching to represent classification or regression rules learned from data to make predictions. Naive Bayes classification is a simple probabilistic classifier that applies Bayes' theorem with strong independence assumptions between features.
Unlocking the Potential of Artificial Intelligence_ Machine Learning in Pract...eswaralaldevadoss
The document serves as a comprehensive beginner's guide to machine learning, detailing key concepts such as data, training, algorithms, and the differences between supervised and unsupervised learning. It also highlights the distinction between machine learning and deep learning, the relationship between AI and machine learning, and the challenges associated with big data analytics. Additionally, it outlines innovative applications of machine learning in product development and offers practical tips for individuals looking to get started in the field.
The document provides an introduction to machine learning including its history, components, classifications, and applications. It discusses key events in the history of machine learning from 1950 to 1985. It defines machine learning and describes how it works through algorithms and data to make autonomous decisions without human intervention. The main components of machine learning include gathering raw data, converting data into information, gathering knowledge from information, and using that knowledge to make decisions. The document also describes the main types of machine learning: supervised learning, unsupervised learning, and reinforcement learning. Finally, it outlines several applications of machine learning such as traffic prediction, speech and image recognition, medical diagnosis, spam detection, and more.
Introduction to Machine Learning for btech 7th semcse21216
Machine learning is a subset of artificial intelligence that enables computers to automatically learn from past data, improving their performance and making predictions without explicit programming. It encompasses various approaches, including supervised, unsupervised, and reinforcement learning, with applications in image recognition, fraud detection, and recommendation systems. The performance of machine learning algorithms is highly dependent on the quality and quantity of data provided, making it essential for solving complex tasks and uncovering patterns in large datasets.
Linear algebra provides the tools needed for machine learning algorithms by allowing complex operations to be described using matrices and vectors. It is widely used in machine learning because operations can be parallelized efficiently. Linear algebra also provides the foundation and notation used in other fields like calculus and probability that are important for machine learning. Machine learning involves feeding training data to algorithms that produce mathematical models to make predictions without being explicitly programmed. It works by learning from experience to improve performance at tasks over time. There are various applications of machine learning like image recognition, speech recognition, recommendations, and fraud detection.
This document discusses machine learning and artificial intelligence. It begins by defining AI and machine learning, noting that ML allows systems to learn tasks without being explicitly programmed. Machine learning is a subset of AI that uses data to learn, allowing systems to recognize patterns and make predictions. Three main types of machine learning are discussed: supervised learning, unsupervised learning, and reinforcement learning. Examples of applications are given for areas like banking, healthcare, and retail. Sources of errors in machine learning models are also explained, including bias, variance, and the bias-variance tradeoff. Overall, the document provides a high-level overview of key concepts in machine learning and AI.
The document discusses the key differences between image processing and computer vision. Image processing involves applying mathematical transformations to images, like smoothing or sharpening, without understanding the image content. Computer vision applies machine learning techniques to computer vision tasks like object recognition, classification, and interpretation of images, aiming to emulate human vision capabilities. While there is overlap, computer vision uses image processing techniques alongside pattern recognition and temporal information processing.
Machine learning applications nurturing growth of various business domainsShrutika Oswal
The document discusses various machine learning applications across different business domains and outlines the types of machine learning, including supervised, unsupervised, semi-supervised, and reinforcement learning. It highlights specific applications in healthcare, finance, retail, and virtual assistants, demonstrating how machine learning enhances decision-making and operational efficiency. The conclusion emphasizes the significant impact of machine learning on business growth and operational effectiveness due to increased computational power and available data.
This document provides an overview of machine learning, including definitions, types, steps, and applications. It defines machine learning as a field that gives computers the ability to learn without being explicitly programmed. The document outlines the main types of machine learning as supervised learning, unsupervised learning, semi-supervised learning, and reinforcement learning. It also describes the typical steps in a machine learning process as gathering data, preparing data, choosing a model, training, evaluation, and prediction. Examples of machine learning applications discussed include prediction, image recognition, natural language processing, and personal assistants. Popular machine learning languages and packages are also listed.
This course provides an introduction to machine learning techniques and methods. It covers machine learning paradigms such as supervised learning techniques including regression and classification algorithms, unsupervised learning techniques including clustering, and reinforcement learning. Students will learn how to apply machine learning algorithms to problems using programming tools like Matlab and Python. References listed provide additional resources for further learning on topics like neural networks, decision trees, naive Bayes classifiers, and more.
1. The document discusses machine learning types including supervised learning, unsupervised learning, and reinforcement learning. It provides examples of applications like spam filtering, recommendations, and fraud detection.
2. Key challenges in machine learning are discussed such as poor quality data, lack of training data, and imperfections when data grows.
3. The difference between data science and machine learning is explained - data science is a broader field that includes extracting insights from data using tools and models, while machine learning focuses specifically on making predictions using algorithms.
MACHINE LEARNING PPT.pptx for the machine learning studnetsAadityaRathi4
Machine learning, a subset of artificial intelligence, enables computers to learn from data and make decisions with minimal human intervention, evolving significantly since its early models in the 1940s. The field has advanced with applications like self-driving cars and facial recognition, and is increasingly data-driven, with organizations recognizing its potential across various industries. Understanding machine learning is crucial for exploiting its benefits in decision-making, data analysis, and addressing real-world challenges.
This document provides an overview of machine learning presented by Mr. Raviraj Solanki. It discusses topics like introduction to machine learning, model preparation, modelling and evaluation. It defines key concepts like algorithms, models, predictor variables, response variables, training data and testing data. It also explains the differences between human learning and machine learning, types of machine learning including supervised learning and unsupervised learning. Supervised learning is further divided into classification and regression problems. Popular algorithms for supervised learning like random forest, decision trees, logistic regression, support vector machines, linear regression, regression trees and more are also mentioned.
Lecture-1-Introduction to Deep learning.pptxJayChauhan100
The document provides an overview of deep learning techniques, including applications in various domains such as food science, healthcare, and natural language processing. It discusses the significance of feature engineering in machine learning, detailing methods for creating and transforming features, handling missing values and outliers, and various tools to automate the feature engineering process. Additionally, it contrasts traditional machine learning with deep learning, emphasizing deep learning's automatic feature extraction and ability to handle larger datasets.
Intro/Overview on Machine Learning PresentationAnkit Gupta
This document provides an overview of a presentation on machine learning given at Gurukul Kangri University in 2017. It defines machine learning as a field that allows computers to learn without being explicitly programmed. It discusses different machine learning algorithms including supervised learning, unsupervised learning, and semi-supervised learning. Examples of applications of machine learning discussed include data mining, natural language processing, image recognition, and expert systems. The document also contrasts artificial intelligence, machine learning, and deep learning.
Applied Artificial Intelligence Unit 3 Semester 3 MSc IT Part 2 Mumbai Univer...Madhav Mishra
The document discusses machine learning paradigms including supervised learning, unsupervised learning, clustering, artificial neural networks, and more. It then discusses how supervised machine learning works using labeled training data for tasks like classification and regression. Unsupervised learning is described as using unlabeled data to find patterns and group data. Semi-supervised learning uses some labeled and some unlabeled data. Reinforcement learning provides rewards or punishments to achieve goals. Inductive learning infers functions from examples to make predictions for new examples.
How to build machine learning apps.pdfJamieDornan2
The document discusses how to build machine learning applications, emphasizing its integration in various sectors such as self-driving cars and personalized recommendations. It outlines key components of machine learning, including data, models, and algorithms, and describes methods like supervised, unsupervised, semi-supervised, and reinforcement learning. The document also details various machine learning algorithms and techniques for classification and regression tasks, including decision trees, k-nearest neighbors, and support vector machines.
This document provides an introduction to machine learning fundamentals. It defines machine learning as giving computers the ability to learn from data rather than being explicitly programmed. The document discusses the differences between artificial intelligence, machine learning, deep learning, and data science. It also covers applications of machine learning, when to use and not use machine learning, and types of machine learning problems and workflows.
Connecting Data and Intelligence: The Role of FME in Machine LearningSafe Software
In this presentation, we want to explore powerful data integration and preparation for Machine Learning. FME is known for its ability to manipulate and transform geospatial data, connecting diverse data sources into efficient and automated workflows. By integrating FME with Machine Learning techniques, it is possible to transform raw data into valuable insights faster and more accurately, enabling intelligent analysis and data-driven decision making.
UserCon Belgium: Honey, VMware increased my billstijn40
VMware’s pricing changes have forced organizations to rethink their datacenter cost management strategies. While FinOps is commonly associated with cloud environments, the FinOps Foundation has recently expanded its framework to include Scopes—and Datacenter is now officially part of the equation. In this session, we’ll map the FinOps Framework to a VMware-based datacenter, focusing on cost visibility, optimization, and automation. You’ll learn how to track costs more effectively, rightsize workloads, optimize licensing, and drive efficiency—all without migrating to the cloud. We’ll also explore how to align IT teams, finance, and leadership around cost-aware decision-making for on-prem environments. If your VMware bill keeps increasing and you need a new approach to cost management, this session is for you!
More Related Content
Similar to Machine learning basics using python programking (20)
Machine learning (ML) is a type of artificial intelligence that allows software to become more accurate at predicting outcomes without being explicitly programmed. ML uses historical data as input to predict new output values. Common uses of ML include recommendation engines, fraud detection, and predictive maintenance. There are four main types of ML: supervised learning where the input and output are defined, unsupervised learning which looks for patterns in unlabeled data, semi-supervised which uses some labeled and some unlabeled data, and reinforcement learning which programs an algorithm to seek rewards and avoid punishments to accomplish a goal.
This document provides an overview of machine learning. It defines machine learning as a branch of artificial intelligence that allows computers to learn without being explicitly programmed. It discusses applications such as sentiment analysis on Twitter, predicting global warming, and personalized cancer treatment. The document also covers supervised learning, unsupervised learning, common machine learning algorithms, and how to approach solving problems in machine learning. It emphasizes understanding the data and problem before selecting an appropriate algorithm. Finally, it notes that Python is a popular programming language for machine learning tasks due to its libraries for data processing, visualization, and more.
Machine learning is a scientific discipline that develops algorithms to allow systems to learn from data and improve automatically without being explicitly programmed. The document discusses several key machine learning concepts including supervised learning algorithms like decision trees and Naive Bayes classification. Decision trees use branching to represent classification or regression rules learned from data to make predictions. Naive Bayes classification is a simple probabilistic classifier that applies Bayes' theorem with strong independence assumptions between features.
Unlocking the Potential of Artificial Intelligence_ Machine Learning in Pract...eswaralaldevadoss
The document serves as a comprehensive beginner's guide to machine learning, detailing key concepts such as data, training, algorithms, and the differences between supervised and unsupervised learning. It also highlights the distinction between machine learning and deep learning, the relationship between AI and machine learning, and the challenges associated with big data analytics. Additionally, it outlines innovative applications of machine learning in product development and offers practical tips for individuals looking to get started in the field.
The document provides an introduction to machine learning including its history, components, classifications, and applications. It discusses key events in the history of machine learning from 1950 to 1985. It defines machine learning and describes how it works through algorithms and data to make autonomous decisions without human intervention. The main components of machine learning include gathering raw data, converting data into information, gathering knowledge from information, and using that knowledge to make decisions. The document also describes the main types of machine learning: supervised learning, unsupervised learning, and reinforcement learning. Finally, it outlines several applications of machine learning such as traffic prediction, speech and image recognition, medical diagnosis, spam detection, and more.
Introduction to Machine Learning for btech 7th semcse21216
Machine learning is a subset of artificial intelligence that enables computers to automatically learn from past data, improving their performance and making predictions without explicit programming. It encompasses various approaches, including supervised, unsupervised, and reinforcement learning, with applications in image recognition, fraud detection, and recommendation systems. The performance of machine learning algorithms is highly dependent on the quality and quantity of data provided, making it essential for solving complex tasks and uncovering patterns in large datasets.
Linear algebra provides the tools needed for machine learning algorithms by allowing complex operations to be described using matrices and vectors. It is widely used in machine learning because operations can be parallelized efficiently. Linear algebra also provides the foundation and notation used in other fields like calculus and probability that are important for machine learning. Machine learning involves feeding training data to algorithms that produce mathematical models to make predictions without being explicitly programmed. It works by learning from experience to improve performance at tasks over time. There are various applications of machine learning like image recognition, speech recognition, recommendations, and fraud detection.
This document discusses machine learning and artificial intelligence. It begins by defining AI and machine learning, noting that ML allows systems to learn tasks without being explicitly programmed. Machine learning is a subset of AI that uses data to learn, allowing systems to recognize patterns and make predictions. Three main types of machine learning are discussed: supervised learning, unsupervised learning, and reinforcement learning. Examples of applications are given for areas like banking, healthcare, and retail. Sources of errors in machine learning models are also explained, including bias, variance, and the bias-variance tradeoff. Overall, the document provides a high-level overview of key concepts in machine learning and AI.
The document discusses the key differences between image processing and computer vision. Image processing involves applying mathematical transformations to images, like smoothing or sharpening, without understanding the image content. Computer vision applies machine learning techniques to computer vision tasks like object recognition, classification, and interpretation of images, aiming to emulate human vision capabilities. While there is overlap, computer vision uses image processing techniques alongside pattern recognition and temporal information processing.
Machine learning applications nurturing growth of various business domainsShrutika Oswal
The document discusses various machine learning applications across different business domains and outlines the types of machine learning, including supervised, unsupervised, semi-supervised, and reinforcement learning. It highlights specific applications in healthcare, finance, retail, and virtual assistants, demonstrating how machine learning enhances decision-making and operational efficiency. The conclusion emphasizes the significant impact of machine learning on business growth and operational effectiveness due to increased computational power and available data.
This document provides an overview of machine learning, including definitions, types, steps, and applications. It defines machine learning as a field that gives computers the ability to learn without being explicitly programmed. The document outlines the main types of machine learning as supervised learning, unsupervised learning, semi-supervised learning, and reinforcement learning. It also describes the typical steps in a machine learning process as gathering data, preparing data, choosing a model, training, evaluation, and prediction. Examples of machine learning applications discussed include prediction, image recognition, natural language processing, and personal assistants. Popular machine learning languages and packages are also listed.
This course provides an introduction to machine learning techniques and methods. It covers machine learning paradigms such as supervised learning techniques including regression and classification algorithms, unsupervised learning techniques including clustering, and reinforcement learning. Students will learn how to apply machine learning algorithms to problems using programming tools like Matlab and Python. References listed provide additional resources for further learning on topics like neural networks, decision trees, naive Bayes classifiers, and more.
1. The document discusses machine learning types including supervised learning, unsupervised learning, and reinforcement learning. It provides examples of applications like spam filtering, recommendations, and fraud detection.
2. Key challenges in machine learning are discussed such as poor quality data, lack of training data, and imperfections when data grows.
3. The difference between data science and machine learning is explained - data science is a broader field that includes extracting insights from data using tools and models, while machine learning focuses specifically on making predictions using algorithms.
MACHINE LEARNING PPT.pptx for the machine learning studnetsAadityaRathi4
Machine learning, a subset of artificial intelligence, enables computers to learn from data and make decisions with minimal human intervention, evolving significantly since its early models in the 1940s. The field has advanced with applications like self-driving cars and facial recognition, and is increasingly data-driven, with organizations recognizing its potential across various industries. Understanding machine learning is crucial for exploiting its benefits in decision-making, data analysis, and addressing real-world challenges.
This document provides an overview of machine learning presented by Mr. Raviraj Solanki. It discusses topics like introduction to machine learning, model preparation, modelling and evaluation. It defines key concepts like algorithms, models, predictor variables, response variables, training data and testing data. It also explains the differences between human learning and machine learning, types of machine learning including supervised learning and unsupervised learning. Supervised learning is further divided into classification and regression problems. Popular algorithms for supervised learning like random forest, decision trees, logistic regression, support vector machines, linear regression, regression trees and more are also mentioned.
Lecture-1-Introduction to Deep learning.pptxJayChauhan100
The document provides an overview of deep learning techniques, including applications in various domains such as food science, healthcare, and natural language processing. It discusses the significance of feature engineering in machine learning, detailing methods for creating and transforming features, handling missing values and outliers, and various tools to automate the feature engineering process. Additionally, it contrasts traditional machine learning with deep learning, emphasizing deep learning's automatic feature extraction and ability to handle larger datasets.
Intro/Overview on Machine Learning PresentationAnkit Gupta
This document provides an overview of a presentation on machine learning given at Gurukul Kangri University in 2017. It defines machine learning as a field that allows computers to learn without being explicitly programmed. It discusses different machine learning algorithms including supervised learning, unsupervised learning, and semi-supervised learning. Examples of applications of machine learning discussed include data mining, natural language processing, image recognition, and expert systems. The document also contrasts artificial intelligence, machine learning, and deep learning.
Applied Artificial Intelligence Unit 3 Semester 3 MSc IT Part 2 Mumbai Univer...Madhav Mishra
The document discusses machine learning paradigms including supervised learning, unsupervised learning, clustering, artificial neural networks, and more. It then discusses how supervised machine learning works using labeled training data for tasks like classification and regression. Unsupervised learning is described as using unlabeled data to find patterns and group data. Semi-supervised learning uses some labeled and some unlabeled data. Reinforcement learning provides rewards or punishments to achieve goals. Inductive learning infers functions from examples to make predictions for new examples.
How to build machine learning apps.pdfJamieDornan2
The document discusses how to build machine learning applications, emphasizing its integration in various sectors such as self-driving cars and personalized recommendations. It outlines key components of machine learning, including data, models, and algorithms, and describes methods like supervised, unsupervised, semi-supervised, and reinforcement learning. The document also details various machine learning algorithms and techniques for classification and regression tasks, including decision trees, k-nearest neighbors, and support vector machines.
This document provides an introduction to machine learning fundamentals. It defines machine learning as giving computers the ability to learn from data rather than being explicitly programmed. The document discusses the differences between artificial intelligence, machine learning, deep learning, and data science. It also covers applications of machine learning, when to use and not use machine learning, and types of machine learning problems and workflows.
Connecting Data and Intelligence: The Role of FME in Machine LearningSafe Software
In this presentation, we want to explore powerful data integration and preparation for Machine Learning. FME is known for its ability to manipulate and transform geospatial data, connecting diverse data sources into efficient and automated workflows. By integrating FME with Machine Learning techniques, it is possible to transform raw data into valuable insights faster and more accurately, enabling intelligent analysis and data-driven decision making.
UserCon Belgium: Honey, VMware increased my billstijn40
VMware’s pricing changes have forced organizations to rethink their datacenter cost management strategies. While FinOps is commonly associated with cloud environments, the FinOps Foundation has recently expanded its framework to include Scopes—and Datacenter is now officially part of the equation. In this session, we’ll map the FinOps Framework to a VMware-based datacenter, focusing on cost visibility, optimization, and automation. You’ll learn how to track costs more effectively, rightsize workloads, optimize licensing, and drive efficiency—all without migrating to the cloud. We’ll also explore how to align IT teams, finance, and leadership around cost-aware decision-making for on-prem environments. If your VMware bill keeps increasing and you need a new approach to cost management, this session is for you!
Quantum AI: Where Impossible Becomes ProbableSaikat Basu
Imagine combining the "brains" of Artificial Intelligence (AI) with the "super muscles" of Quantum Computing. That's Quantum AI!
It's a new field that uses the mind-bending rules of quantum physics to make AI even more powerful.
WebdriverIO & JavaScript: The Perfect Duo for Web Automationdigitaljignect
In today’s dynamic digital landscape, ensuring the quality and dependability of web applications is essential. While Selenium has been a longstanding solution for automating browser tasks, the integration of WebdriverIO (WDIO) with Selenium and JavaScript marks a significant advancement in automation testing. WDIO enhances the testing process by offering a robust interface that improves test creation, execution, and management. This amalgamation capitalizes on the strengths of both tools, leveraging Selenium’s broad browser support and WDIO’s modern, efficient approach to test automation. As automation testing becomes increasingly vital for faster development cycles and superior software releases, WDIO emerges as a versatile framework, particularly potent when paired with JavaScript, making it a preferred choice for contemporary testing teams.
AI Agents and FME: A How-to Guide on Generating Synthetic MetadataSafe Software
In the world of AI agents, semantics is king. Good metadata is thus essential in an organization's AI readiness checklist. But how do we keep up with the massive influx of new data? In this talk we go over the tips and tricks in generating synthetic metadata for the consumption of human users and AI agents alike.
Using the SQLExecutor for Data Quality Management: aka One man's love for the...Safe Software
The SQLExecutor is one of FME’s most powerful and flexible transformers. Pivvot maintains a robust internal metadata hierarchy used to support ingestion and curation of thousands of external data sources that must be managed for quality before entering our platform. By using the SQLExecutor, Pivvot can efficiently detect problems and perform analysis before data is extracted from our staging environment, removing the need for rollbacks or cycles waisted on a failed job. This presentation will walk through three distinct examples of how Pivvot uses the SQLExecutor to engage its metadata hierarchy and integrate with its Data Quality Management workflows efficiently and within the source postgres database. Spatial Validation –Validating spatial prerequisites before entering a production environment. Reference Data Validation - Dynamically validate domain-ed columns across any table and multiple columns per table. Practical De-duplication - Removing identical or near-identical well point locations from two distinct source datasets in the same table.
For the full video of this presentation, please visit: https://www.edge-ai-vision.com/2025/06/mpu-a-transformative-solution-for-next-gen-ai-at-the-edge-a-presentation-from-fotonation/
Petronel Bigioi, CEO of FotoNation, presents the “MPU+: A Transformative Solution for Next-Gen AI at the Edge” tutorial at the May 2025 Embedded Vision Summit.
In this talk, Bigioi introduces MPU+, a novel programmable, customizable low-power platform for real-time, localized intelligence at the edge. The platform includes an AI-augmented image signal processor that enables leading image and video quality.
In addition, it integrates ultra-low-power object and motion detection capabilities to enable always-on computer vision. A programmable neural processor provides flexibility to efficiently implement new neural networks. And additional specialized engines facilitate image stabilization and audio enhancements.
Smarter Aviation Data Management: Lessons from Swedavia Airports and SwecoSafe Software
Managing airport and airspace data is no small task, especially when you’re expected to deliver it in AIXM format without spending a fortune on specialized tools. But what if there was a smarter, more affordable way?
Join us for a behind-the-scenes look at how Sweco partnered with Swedavia, the Swedish airport operator, to solve this challenge using FME and Esri.
Learn how they built automated workflows to manage periodic updates, merge airspace data, and support data extracts – all while meeting strict government reporting requirements to the Civil Aviation Administration of Sweden.
Even better? Swedavia built custom services and applications that use the FME Flow REST API to trigger jobs and retrieve results – streamlining tasks like securing the quality of new surveyor data, creating permdelta and baseline representations in the AIS schema, and generating AIXM extracts from their AIS data.
To conclude, FME expert Dean Hintz will walk through a GeoBorders reading workflow and highlight recent enhancements to FME’s AIXM (Aeronautical Information Exchange Model) processing and interpretation capabilities.
Discover how airports like Swedavia are harnessing the power of FME to simplify aviation data management, and how you can too.
Delivering solutions to Azure may involve a variety of architecture patterns involving your applications, APIs data and associated Azure resources that comprise the solution. This session will use reference architectures to illustrate the security considerations to protect your Azure resources and data, how to achieve Zero Trust, and why it matters. Topics covered will include specific security recommendations for types Azure resources and related network security practices. The goal is to give you a breadth of understanding as to typical security requirements to meet compliance and security controls in an enterprise solution.
Explore the ease of managing Firecracker microVM with the firecracker-python. In this session, I will introduce the basics of Firecracker microVM and demonstrate how this custom SDK facilitates microVM operations easily. We will delve into the design and development process behind the SDK, providing a behind-the-scenes look at its creation and features. While traditional Firecracker SDKs were primarily available in Go, this module brings a simplicity of Python to the table.
מרכז עיבודים תעשייתי בעל 3/4/5 צירים, עד 22 החלפות כלים עם כל אפשרויות העיבוד הדרושות. בעל שטח עבודה גדול ומחשב נוח וקל להפעלה בשפה העברית/רוסית/אנגלית/ספרדית/ערבית ועוד..
מסוגל לבצע פעולות עיבוד שונות המתאימות לענפים שונים: קידוח אנכי, אופקי, ניסור, וכרסום אנכי.
As AI reshapes expectations in retail and B2B commerce, organizations are recognizing a critical reality: meaningful AI outcomes depend on well-structured, adaptable infrastructure. In this session, Seth Earley is joined by Phil Ryan - AI strategist, search technologist, and founder of Glass Leopard Technologies - for a candid conversation on what it truly means to engineer systems for scale, agility, and intelligence.
Phil draws on more than two decades of experience leading search and AI initiatives for enterprise organizations. Together, he and Seth explore the challenges businesses face when legacy architectures limit personalization, agility, and real-time decisioning - and what needs to change to support agentic technologies and next-best-action capabilities.
Key themes from the webinar include:
Composability as a prerequisite for AI - Why modular, loosely coupled systems are essential for adapting to rapid innovation and evolving business needs
Search and relevance as foundational to AI - How techniques honed-in enterprise search have laid the groundwork for more responsive and intelligent customer experiences
From MDM and CDP to agentic systems - How data platforms are evolving to support richer customer context and dynamic orchestration
Engineering for business alignment - Why successful AI programs require architectural decisions grounded in measurable outcomes
The conversation is practical and forward-looking, connecting deep technical understanding with real-world business needs. Whether you’re modernizing your commerce stack or exploring how AI can enhance product discovery, personalization, or customer journeys, this session provides a clear-eyed view of the capabilities, constraints, and priorities that matter most.
The Future of Technology: 2025-2125 by Saikat Basu.pdfSaikat Basu
A peek into the next 100 years of technology. From Generative AI to Global AI networks to Martian Colonisation to Interstellar exploration to Industrial Nanotechnology to Artificial Consciousness, this is a journey you don't want to miss. Which ones excite you the most? Which ones are you apprehensive about? Feel free to comment! Let the conversation begin!
OpenACC and Open Hackathons Monthly Highlights June 2025OpenACC
The OpenACC organization focuses on enhancing parallel computing skills and advancing interoperability in scientific applications through hackathons and training. The upcoming 2025 Open Accelerated Computing Summit (OACS) aims to explore the convergence of AI and HPC in scientific computing and foster knowledge sharing. This year's OACS welcomes talk submissions from a variety of topics, from Using Standard Language Parallelism to Computer Vision Applications. The document also highlights several open hackathons, a call to apply for NVIDIA Academic Grant Program and resources for optimizing scientific applications using OpenACC directives.
4. INTRODUCTION
Machine learning (ML) is a branch of artificial intelligence (AI) that enables computers to “self-
learn” from training data and improve over time, without being explicitly programmed.
Machine learning is about extracting knowledge from data.
It is a research field at the intersection of statistics, artificial intelligence, and computer science
known as predictive analytics or statistical learning.
Application of Machine Learning
Automatic recommendations of which movies to watch
What food to order,
Which products to buy
Recognizing friends in photos, etc.
5. Why Machine Learning?
In the early days of “intelligent” applications, many systems used handcoded rules of “if ” and “else”
decisions to process data or adjust to user input.
Manually crafting decision rules is feasible for some applications, particularly those in which humans
have a good understanding of the process to model.
Handcoded rules to make decisions has two major disadvantages:
The logic required to make a decision is specific to a single domain and task. Changing the task even
slightly might require a rewrite of the whole system.
Designing rules requires a deep understanding of how a decision should be made by a human expert.
Ex: Handcoded approach will fail is in detecting faces in images.
Today, every smartphone can detect a face in an image. Face detection was an unsolved problem until as
recently as 2001.
Problem: The way in which pixels are “perceived” by the computer is very different from how humans
perceive a face.
6. Why Machine Learning?
The difference in representation makes impossible for a human to come up with a good set of rules to
describe what constitutes a face in a digital image.
Machine Learning presents a program with a large collection of images of faces which is enough for an
algorithm to determine what characteristics are needed to identify a face.
Machine Learning is a subset of Artificial Intelligence.
ML is the trending topic in the world and have lots of applications
Imagine write a program to scan an image and tell if it is a Cat or Dog?
Traditional program will become overly complex or impossible.
7. Why Machine Learning?
Build Machine Learning model and give lots and lots of data.
The model then find and will learn patterns in the input data and take decision.
More input data more accurate.
Applications of ML
10. Problems Machine Learning Can Solve
The most successful ML algorithms are those that automate decision-making processes by
generalizing from known examples - Supervised Learning.
Supervised Learning : The user provides the algorithm with pairs of inputs and desired outputs,
and the algorithm is able to create an output for an input it has never seen before without any
help from a human.
Ex: Spam e-mail classification, using ML, the user provides the algorithm with a large number
of emails, together with information about whether any of these emails are spam. Given a new
email, the algorithm will then produce a prediction as to whether the new email is spam.
Machine learning algorithms that learn from input/output pairs are called supervised learning
algorithms.
Creating a dataset of inputs and outputs is a manual process. If created dataset that includes the
desired outcome, ML will likely be able to solve the problem.
12. Problems Machine Learning Can Solve
Learning: Any method that incorporates information from training samples in the design of a classifier.
General forms of Learning:
1. Supervised Learning
2. Unsupervised Learning
3. Reinforcement Learning
Supervised Learning
It takes a known set of input data (the learning set) and known responses to the data (the output), and forms
a model to generate reasonable predictions for the response to the new input data.
Used when there exists data for the output to be predicted.
Supervised learning deals with “labeled” data.
Supervised learning problems are categorized into "regression" and "classification" problems.
14. Problems Machine Learning Can Solve
Examples of Supervised Machine Learning tasks:
1. Identifying the zip code from handwritten digits on an envelope.
Here the input is a scan of the handwriting, and the desired output is the actual digits in the zip code.
To create a dataset for building a ML model, collect many envelopes. Then read the zip codes and store
the digits as desired outcomes.
2. Determining whether a tumor is benign based on a medical image
Here the input is the image, and the output is whether the tumor is benign.
To create a dataset for building a model, a database of medical images is needed.
An expert opinion is needed, so a doctor needs to look at all of the images and decide which tumors are
benign and which are not.
It might even be necessary to do additional diagnosis beyond the content of the image to determine
whether the tumor in the image is cancerous or not.
15. Problems Machine Learning Can Solve
3. Detecting fraudulent activity in credit card transactions
Input is a record of the credit card transaction, and the output is whether it is likely to be fraudulent or not.
Collecting a dataset means storing all transactions and recording if a user reports any transaction as
fraudulent.
The data collection process for these three tasks is vastly different.
1. While reading envelopes is laborious, it is easy and cheap.
2. Obtaining medical imaging and diagnoses, requires not only expensive machinery but also rare and
expensive expert knowledge.
3. Detecting credit card fraud, data collection is much simpler. Customers will provide the desired output,
as they will report fraud.
16. Problems Machine Learning Can Solve
Unsupervised Learning
It is a type of machine learning in which models are trained using unlabeled dataset and are allowed to act on
that data without any supervision.
Models itself find the hidden patterns and insights from the given data.
It is a type of machine learning algorithm used to draw inferences from datasets consisting of input data
without labeled responses.
The most common unsupervised learning method is cluster analysis, which is used for exploratory data
analysis to find hidden patterns or grouping in data.
Input data is known, and no known output data is given to the algorithm.
17. Problems Machine Learning Can Solve
Representation of input data that a computer can understand
The data should be considered as a table.
Each data point infers a row, and each property that describes that data point is a column.
Each entity or row here is known as a Sample (or data point) in machine learning, while the columns the
properties that describe these entities are called Features.
Building a good representation of the data is called Feature Extraction or Feature Engineering.
No machine learning algorithm will be able to make a prediction on data for which it has no information.
Ex: If the only feature that have for a patient is their last name, no algorithm will be able to predict their
gender.
Adding another feature that contains the patient’s first name, will have much better luck, as it is often
possible to tell the gender by a person’s first name.
19. Problems Machine Learning Can Solve
Reinforcement Learning
It is a feedback-based Machine learning technique in which an agent learns to behave in an
environment by performing the actions and seeing the results of actions.
For each good action, the agent gets positive feedback, and for each bad action, the agent gets
negative feedback or penalty.
The agent learns automatically using feedbacks without any labeled data.
Since there is no labeled data, so the agent is bound to learn by its experience only
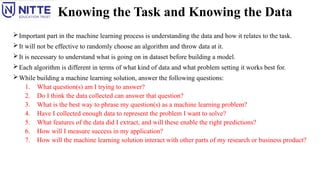
23. Knowing the Task and Knowing the Data
Important part in the machine learning process is understanding the data and how it relates to the task.
It will not be effective to randomly choose an algorithm and throw data at it.
It is necessary to understand what is going on in dataset before building a model.
Each algorithm is different in terms of what kind of data and what problem setting it works best for.
While building a machine learning solution, answer the following questions:
1. What question(s) am I trying to answer?
2. Do I think the data collected can answer that question?
3. What is the best way to phrase my question(s) as a machine learning problem?
4. Have I collected enough data to represent the problem I want to solve?
5. What features of the data did I extract, and will these enable the right predictions?
6. How will I measure success in my application?
7. How will the machine learning solution interact with other parts of my research or business product?
24. Why Python?
Python combines the power of general-purpose programming languages with the ease of use of domain-
specific scripting languages like MATLAB or R.
Python has libraries for data loading, visualization, statistics, natural language processing, image processing,
and more.
It provides data scientists with a large array of general-and special-purpose functionality.
Advantages of using Python is the ability to interact directly with the code, using a terminal or other tools like
the Jupyter Notebook.
Machine learning and data analysis are iterative processes, in which the data drives the analysis. It is essential
to have tools that allow quick iteration and easy interaction.
As a general-purpose programming language, Python also allows for the creation of complex graphical user
interfaces (GUIs) and web services, and for integration into existing systems.
25. Scikit - learn
scikit-learn is an open source project, it is free to use and distribute, and source code is easily available. The
scikit-learn project is constantly being developed and improved.
It has a very active user community.
It contains a number of state-of-the-art machine learning algorithms, as well as comprehensive
documentation about each algorithm.
It is a very popular tool, and the most prominent Python library for machine learning.
It is widely used in industry and academia, tutorials and code snippets are available online.
It works well with a number of other scientific Python tools.
26. Installing scikit-learn
scikit-learn depends on two other Python packages, NumPy and SciPy.
For plotting and interactive development, install matplotlib, IPython, and the Jupyter Notebook.
It is recommended to use one of the following prepackaged Python distributions, which will provide the
necessary packages:
1. Anaconda
2. Enthought Canopy
3. Python(x,y)
If you already have a Python installation set up, you can use pip to install all of these packages:
$ pip install numpy scipy matplotlib ipython scikit-learn pandas
27. Installing scikit-learn
1. Anaconda
A Python distribution made for large-scale data processing, predictive analytics, and scientific computing.
Anaconda comes with NumPy, SciPy, matplotlib, pandas, IPython, Jupyter Notebook, and scikit-learn.
Available on Mac OS, Windows, and Linux.
It is a very convenient solution and without an existing installation of the scientific Python packages.
Anaconda includes the commercial Intel MKL library for free.
MKL can give significant speed improvements for many algorithms in scikit-learn.
28. Installing scikit-learn
2. Enthought Canopy
Python distribution for scientific computing.
This comes with NumPy, SciPy, matplotlib, pandas, and IPython, but the free version does not come with scikit-
learn.
Academic, degree-granting institution, can request an academic license and get free access to the paid
subscription version of Enthought Canopy.
Enthought Canopy is available for Python 2.7.x, and works on Mac OS, Windows, and Linux.
3. Python(x,y)
A free Python distribution for scientific computing, specifically for Windows.
Python(x,y) comes with NumPy, SciPy, matplotlib, pandas, IPython, and scikit-learn.
29. Essential Libraries and Tools
scikit-learn is built on top of the NumPy and SciPy scientific Python libraries.
In addition to NumPy and SciPy, pandas and matplotlib can be used.
Jupyter Notebook, is a browser-based interactive programming environment.
Jupyter Notebook
It is an interactive environment for running code in the browser.
It is a great tool for exploratory data analysis and is widely used by data scientists.
It supports many programming languages, only need the Python support.
The Jupyter Notebook makes it easy to incorporate code, text, and images.
30. Essential Libraries and Tools
NumPy
It is one of the fundamental packages for scientific computing in Python.
It contains functionality for multidimensional arrays, high-level mathematical functions such as linear
algebra operations and the Fourier transform, and pseudorandom number generators.
In scikit-learn, the NumPy array is the fundamental data structure.
scikit-learn takes in data in the form of NumPy arrays.
Any data have to be converted to a NumPy array.
The core functionality of NumPy is the ndarray class, a multidimensional (n-dimensional) array.
All elements of the array must be of the same type.
31. Essential Libraries and Tools
NumPy
A NumPy array looks like this:
Objects of the NumPy ndarray class are referred as “NumPy arrays” or just
“Arrays”.
32. Essential Libraries and Tools
SciPy
SciPy is a collection of functions for scientific computing in Python.
It provides advanced linear algebra routines, mathematical function optimization, signal
processing, special mathematical functions, and statistical distributions.
The most important part of SciPy is scipy.sparse: This provides sparse matrices, another
representation that is used for data in scikitlearn.
Sparse matrices are used to store a 2D array that contains mostly zeros:
33. Essential Libraries and Tools
SciPy
It is not possible to create dense representations of sparse data (as they would not fit into
memory), so need to create sparse representations directly.
To create the same sparse matrix, using the COO format:
34. Essential Libraries and Tools
matplotlib
It is the primary scientific plotting library in Python.
It provides functions for making publication-quality visualizations such as line charts, histograms, scatter
plots, and so on.
Visualizing data and different aspects of analysis can give important insights.
When working inside the Jupyter Notebook, figures can be showed directly in the browser by using the
%matplotlib notebook and %matplotlib inline commands.
Using %matplotlib notebook, provides an interactive environment.
35. Essential Libraries and Tools
Matplotlib
Simple line plot of the sine function using matplotlib
36. Essential Libraries and Tools
pandas
pandas is a Python library for data wrangling and analysis.
It is built around a data structure called the DataFrame that is modeled after the R DataFrame.
pandas DataFrame is a table, similar to an Excel spreadsheet.
pandas provides a great range of methods to modify and operate on this table; it allows SQL-like queries
and joins of tables.
In contrast to NumPy, which requires that all entries in an array be of the same type, pandas allows each
column to have a separate type (for example, integers, dates, floating-point numbers, and strings).
Ability to ingest from a great variety of file formats and data bases, like SQL, Excel files, and comma-
‐
separated values (CSV) files.
40. Python 2 Versus Python 3
Two major versions of Python:
1. Python 2 (more precisely, 2.7)
2. Python 3 (Latest Version 3.5).
Python 2 is no longer actively developed, because Python 3 contains major changes, Python 2 code usually
does not run on Python 3.
Python 3 has an easier syntax compared to Python 2.
A lot of libraries of Python 2 are not forward compatible.
A lot of libraries are created in Python 3 to be strictly used with Python 3.
Python 2 is no longer in use since 2020.
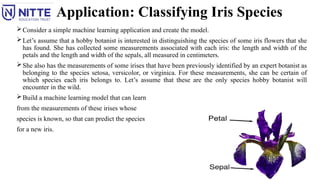
42. Application: Classifying Iris Species
Consider a simple machine learning application and create the model.
Let’s assume that a hobby botanist is interested in distinguishing the species of some iris flowers that she
has found. She has collected some measurements associated with each iris: the length and width of the
petals and the length and width of the sepals, all measured in centimeters.
She also has the measurements of some irises that have been previously identified by an expert botanist as
belonging to the species setosa, versicolor, or virginica. For these measurements, she can be certain of
which species each iris belongs to. Let’s assume that these are the only species hobby botanist will
encounter in the wild.
Build a machine learning model that can learn
from the measurements of these irises whose
species is known, so that can predict the species
for a new iris.
43. Application: Classifying Iris Species
Have measurements for the known correct species of iris, - Supervised learning problem.
Predict one of several options (the species of iris) - Classification problem.
The possible outputs (different species of irises) are called Classes.
Every iris in the dataset belongs to one of three classes - Three-class classification problem.
The desired output for a single data point (an iris) is the species of this flower.
For a particular data point, the species it belongs to is called its Label.
44. Application: Classifying Iris Species
Meet the Data:
The data is the Iris dataset, a classical dataset in machine learning and statistics.
It is included in scikit-learn in the datasets module.
Can load it by calling the load_iris function:
The iris object that is returned by load_iris is a Bunch object, which is very similar to a
dictionary.
It contains keys and values:
45. Application: Classifying Iris Species
The value of the key DESCR is a short description of the dataset.
The value of the key target_names is an array of strings, containing the species
of flower that is to be predicted:
46. Application: Classifying Iris Species
The value of feature_names is a list of strings, giving the description of each
feature:
The data itself is contained in the target and data fields. data contains the
numeric measurements of sepal length, sepal width, petal length, and petal width
in a NumPy array:
The rows in the data array correspond to flowers, while the columns represent
the four measurements that were taken for each flower:
47. Application: Classifying Iris Species
The array contains measurements for 150 different flowers.
The individual items are called Samples in machine learning, and their
properties are called Features.
The shape of the data array is the number of samples multiplied by the number
of features.
This is a convention in scikit-learn, and the data will always be assumed to be in
this shape.
Here are the feature values for the first four samples:
48. Application: Classifying Iris Species
From the data, all the first four flowers have a petal width of 0.2 cm and that the
first flower has the longest sepal, at 5.1 cm.
The target array contains the species of each of the flowers that were measured,
also as a NumPy array:
Target is a one-dimensional array, with one entry per flower:
49. Application: Classifying Iris Species
The species are encoded as integers from 0 to 2:
The meanings of the numbers are given by the iris['target_names'] array:
0 means setosa
1 means versicolor
2 means virginica.
50. Application: Classifying Iris Species
Measuring Success: Training and Testing Data:
To build a ML model from this data that can predict the species of iris for a new set of measurements.
But before apply the model to new measurements, need to know whether it actually works i.e, whether to
trust its predictions.
Cannot use the data that is used to build the model to evaluate it.
Because the model can always remember the whole training set and will always predict the correct label for
any point in the training set.
This “remembering” does not indicate whether model will generalize well.
To assess the model’s performance, use new data which have labels.
This is usually done by splitting the labeled data into two parts.
1. One part of the data is used to build the ML model, - Training data or Training set.
2. The rest of the data used to assess how well the model works - Test data, Test set, or Hold-out set.
51. Application: Classifying Iris Species
scikit-learn contains a function that shuffles the dataset and splits it: the train_test_split function.
This function extracts 75% of the rows in the data as the training set, together with the corresponding
labels for this data.
The remaining 25% of the data, together with the remaining labels, is declared as the test set.
In scikit-learn, data is usually denoted with a capital X because the data is a two-dimensional array (a
matrix), while labels are denoted by a lowercase y because the target is a one-dimensional array (a vector).
Call train_test_split on the data and assign the outputs using the nomenclature:
Before making the split, the train_test_split function shuffles the dataset using a pseudorandom number
generator.
52. Application: Classifying Iris Species
If the last 25% of the data is considered as a test set, the test set contains only one of the three
classes.
Then the model will not generalize well, so shuffle the data to make sure the test data contains data
from all classes.
To make sure that to get the same output after running the same function several times,
pseudorandom number generator with a fixed seed is provided using the random_state parameter.
The output of the train_test_split function is X_train, X_test, y_train, and y_test, which are all
NumPy arrays.
X_train contains 75% of the rows of the dataset, and X_test contains the remaining 25%:
53. Application: Classifying Iris Species
First Things First: Look at Your Data
Before building a ML model, inspect the data, to see if the task is easily solvable without ML, or if the desired
information might not be contained in the data.
Inspecting your data helps to find abnormalities and peculiarities.
Ex: Some of irises were measured using inches and not centimeters.
In the real world, inconsistencies in the data and unexpected measurements are very common.
Visualization is the best ways to inspect data.
Scatter Plot: Puts one feature along the x-axis and another along the y-axis and draws a dot for each data
point.
It is difficult to plot datasets with more than three features.
Pair Plot: Looks at all possible pairs of features.
Pair plot does not show the interaction of all of features at once.
54. Application: Classifying Iris Species
To create the plot, convert the NumPy array into a pandas DataFrame.
pandas has a function to create pair plots called scatter_matrix.
The diagonal of this matrix is filled with histograms of each feature:
55. Application: Classifying Iris Species
From the plots, the three classes seem to be relatively well separated using the sepal and petal
measurements.
A machine learning model will likely be able to learn to separate them.
56. K-Nearest Neighbor(KNN)
It is one of the simplest ML algorithms based on Supervised Learning technique.
KNN algorithm at the training phase just stores the dataset and when it gets new data, then it classifies that
data into a category that is much similar to the new data.
K-NN algorithm assumes the similarity between the new case/data and available cases and put the new case
into the category that is most similar to the available categories.
K-NN algorithm stores all the available.
K-NN algorithm can be used for Regression as well as for Classification but mostly it is used for the
Classification problems.
K-NN is a Non-parametric algorithm - it does not make any assumption on underlying data.
It is a Lazy learner algorithm - it does not learn from the training set immediately instead it stores the dataset
and at the time of classification, it performs an action on the dataset.
57. K-Nearest Neighbor(KNN)
How does K-NN work?
Step-1: Select the number K of the neighbors
Step-2: Calculate the Euclidean distance of K number of neighbors
Step-3: Take the K nearest neighbors as per the calculated Euclidean distance.
Step-4: Among these k neighbors, count the number of the data points in each category.
Step-5: Assign the new data points to that category for which the number of the neighbor is maximum.
Step-6: Model is ready.
How to select the value of K in the K-NN Algorithm?
There is no particular way to determine the best value for "K". The most preferred value for K is 5.
A very low value for K such as K=1 or K=2, can be noisy and lead to the effects of outliers in the model.
Large values for K are good, but it may find some difficulties.
58. K-Nearest Neighbor(KNN)
Ex 1: Suppose there are two categories, i.e., Category A and Category B, and a new data point x1belongs to
which of these categories.
Ex2: Consider an image of a creature that looks similar to cat and dog, classify it as a cat or dog. Use the KNN
algorithm, as it works on a similarity measure.
KNN model will find the similar features of the new data set to the cats and dogs images and based on the
most similar features it will put it in either cat or dog category.
59. K-Nearest Neighbor(KNN)
Consider the below image:
Choose the number of neighbors, choose k=5.
Calculate the Euclidean distance between the data points.
The nearest neighbors, are: three nearest neighbors in category A and two nearest neighbors in
category B.
The 3 nearest neighbors are from category A, hence this new data point must belong to category
A.
60. K-Nearest Neighbor(KNN)
Advantages of KNN Algorithm:
It is simple to implement.
It is robust to the noisy training data
It can be more effective if the training data is large.
Disadvantages of KNN Algorithm:
• Always needs to determine the value of K which may be complex some time.
• The computation cost is high because of calculating the distance between the data points for all the training
samples.
61. Application: Classifying Iris Species
Building First Model: k-Nearest Neighbors
There are many classification algorithms in scikit-learn.
Building k-nearest neighbors classifier only consists of storing the training set.
To make a prediction for a new data point, the algorithm finds the point in the training set that is closest to the
new point.
Then it assigns the label of this training point to the new data point.
The k in k-nearest neighbors signifies that instead of using only the closest neighbor to the new data point,
consider any fixed number k of neighbors in the.
Make a prediction using the majority class among these neighbors.
All machine learning models in scikit-learn are implemented in their own classes, which are called Estimator
classes.
The k-nearest neighbors classification algorithm is implemented in the KNeighborsClassifier class in the
neighbors module.
Consider only a single neighbor.
62. Application: Classifying Iris Species
Before using the model, instantiate the class into an object - set any parameters of the model.
The important parameter of KNeighbor sClassifier is the number of neighbors, set to 1:
The knn object encapsulates the algorithm that will be used to build the model from the training data, as well
the algorithm to make predictions on new data points.
It will also hold the information that the algorithm has extracted from the training data.
KNeighborsClassifier, will store the training set.
To build the model on the training set, call the fit method of the knn object, which takes as arguments the
NumPy array X_train containing the training data and the NumPy array y_train of the corresponding training
labels:
63. step 1: load the data sets from sklearn
*****--------------------*****
from sklearn.datasets import load_iris
iris=load_iris()
step 2 : As the dataset is a dictionary check the keys
---------------------------------------------------------------
***********to check the keys******************
print("keys of datasets:n".format(iris.keys()))
----------------------------------------------------------------
step 3 : divide the data for training and testing
from sklearn.model_selection import train_test_split
X_train,X_test, y_train , y_test = train_test_split(----------------)
X_train,X_test, y_train , y_test = train_test_split(iris['data'],iris['target'], random state = 0)
---------------------------------------------------------------------
step 4 : use a suitable model for classifying the data in the datasets
from sklearn.neighbors import KNeighboursClassifier
knn=KNeighboursClassifier(n_neighbour=1)
knn.fit(X_train,y_train)
-------------------------------------------------
step 5: predict for a new data point
X_new=np.array([[5,2.9,1,0.2]])
prediction = knn.predict(X_new)
-------------------------------------------------
Step 6 : Evaluation of the model
y_pred = knn.predict(X_test)
64. Application: Classifying Iris Species
The fit method returns the knn object itself (and modifies it in place), so get a string representation of the
classifier.
The representation shows which parameters were used in creating the model.
Nearly all of them are the default values, but you can also find n_neighbors=1, which is the parameter that we
passed.
Most models in scikit-learn have many parameters, but the majority of them are either speed optimizations or
for very special use cases.
You don’t have to worry about the other parameters shown in this representation.
Printing a scikit-learn model can yield very long strings, but don’t be intimidated by these. We will cover all the
important parameters in Chapter 2. In the remainder of this book, we will not show the output of fit because it
doesn’t contain any new information.
65. Application: Classifying Iris Species
Making Predictions:
Make predictions using this model on new data for which there is no correct labels.
Ex: Imagine for an iris in the wild with a sepal length of 5 cm, a sepal width of 2.9 cm, a petal length
of 1 cm, and a petal width of 0.2 cm. What species of iris would this be?
Put this data into a NumPy array, again by calculating the shape i.e, the number of samples (1)
multiplied by the number of features (4):
The measurements of this single flower into a row in a two dimensional NumPy array, as scikit-learn
always expects two-dimensional arrays for the data.
66. Application: Classifying Iris Species
To make a prediction, call the predict method of the knn object:
Model predicts that new iris belongs to the class 0, meaning its species is setosa.
67. Application: Classifying Iris Species
Evaluating the Model
Test data set was not used to build the model.
Test data contains correct species for each iris in the test set.
Therefore, can make a prediction for each iris in the test data and compare it against its label.
Thereby can measure how well the model works by computing the accuracy, which is the fraction of
flowers for which the right species was predicted:
68. Application: Classifying Iris Species
Can also use the score method of the knn object, which will compute the test set
accuracy.
For this model, the test set accuracy is about 0.97, i.e the model made the right
prediction for 97% of the irises in the test set.
Under some mathematical assumptions, the model to be correct 97% of the time for
new irises.
69. Application: Classifying Iris Species
Summary and Outlook:
The Iris dataset consists of two NumPy arrays: one containing the data- X in scikit-learn, and one
containing the correct or desired outputs- y.
The array X is a two-dimensional array of features, with one row per data point and one column per
feature.
The array y is a one-dimensional array, contains one class label, an integer ranging from 0 to 2, for
each of the samples.
#44: A key is an attribute or a set of attributes that help to uniquely identify a tuple (or row) in a relation (or table).
Keys are also used to establish relationships between the different tables and columns of a relational database.
Individual values in a key are called key values.


![dictoniary
data
{
‘Name’:[“a”,”b”,”c”,”d”]
‘age’: [4,5,6,7]
‘loc’:[“g”,”t”,”m”,”b”]
}](https://image.slidesharecdn.com/unit1-250421082020-2b2d5964/85/Machine-learning-basics-using-python-programking-39-320.jpg)


![Application: Classifying Iris Species
The species are encoded as integers from 0 to 2:
The meanings of the numbers are given by the iris['target_names'] array:
0 means setosa
1 means versicolor
2 means virginica.](https://image.slidesharecdn.com/unit1-250421082020-2b2d5964/85/Machine-learning-basics-using-python-programking-49-320.jpg)


![step 1: load the data sets from sklearn
*****--------------------*****
from sklearn.datasets import load_iris
iris=load_iris()
step 2 : As the dataset is a dictionary check the keys
---------------------------------------------------------------
***********to check the keys******************
print("keys of datasets:n".format(iris.keys()))
----------------------------------------------------------------
step 3 : divide the data for training and testing
from sklearn.model_selection import train_test_split
X_train,X_test, y_train , y_test = train_test_split(----------------)
X_train,X_test, y_train , y_test = train_test_split(iris['data'],iris['target'], random state = 0)
---------------------------------------------------------------------
step 4 : use a suitable model for classifying the data in the datasets
from sklearn.neighbors import KNeighboursClassifier
knn=KNeighboursClassifier(n_neighbour=1)
knn.fit(X_train,y_train)
-------------------------------------------------
step 5: predict for a new data point
X_new=np.array([[5,2.9,1,0.2]])
prediction = knn.predict(X_new)
-------------------------------------------------
Step 6 : Evaluation of the model
y_pred = knn.predict(X_test)](https://image.slidesharecdn.com/unit1-250421082020-2b2d5964/85/Machine-learning-basics-using-python-programking-63-320.jpg)


