

![Implementation in Python
Example
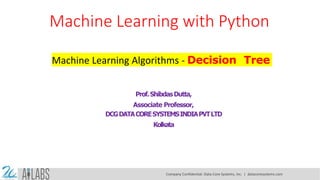
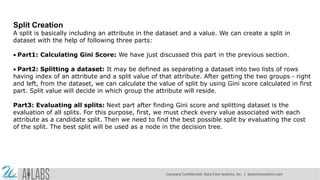
In the following example, we are going to implement Decision Tree classifier on Pima Indian
Diabetes:
First, start with importing necessary python packages:
import pandas as pd
from sklearn.tree import DecisionTreeClassifier
from sklearn.model_selection import train_test_split
Next, download the iris dataset from its weblink as follows:
col_names = ['pregnant', 'glucose', 'bp', 'skin', 'insulin', 'bmi', 'pedigree', 'age', 'label']
pima = pd.read_csv(r"C:pima-indians-diabetes.csv", header=None, names=col_names)
pima.head()
Company Confidential: Data-Core Systems, Inc. | datacoresystems.com](https://image.slidesharecdn.com/machinelearningwithpython-machinelearningalgorithms-decisiontree-250217162709-713dfac8/85/Machine-Learning-with-Python-Machine-Learning-Algorithms-Decision-Tree-pdf-10-320.jpg)
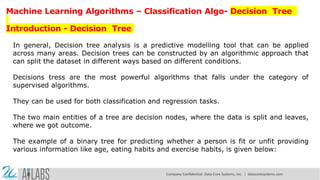
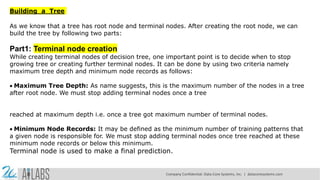
![pregnant glucose bp skin insulin bmi pedigree age label
0 6 148 72 35 0 33.6 0.627 50 1
1 1 85 66 29 0 26.6 0.351 31 0
2 8 183 64 0 0 23.3 0.672 32 1
3 1 89 66 23 94 28.1 0.167 21 0
4 0 137 40 35 168 43.1 2.288 33 1
Now, split the dataset into features and target variable as follows:
feature_cols = ['pregnant', 'insulin', 'bmi', 'age','glucose','bp','pedigree']
X = pima[feature_cols] # Features
y = pima.label # Target variable
Company Confidential: Data-Core Systems, Inc. | datacoresystems.com](https://image.slidesharecdn.com/machinelearningwithpython-machinelearningalgorithms-decisiontree-250217162709-713dfac8/85/Machine-Learning-with-Python-Machine-Learning-Algorithms-Decision-Tree-pdf-11-320.jpg)
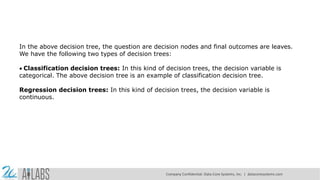
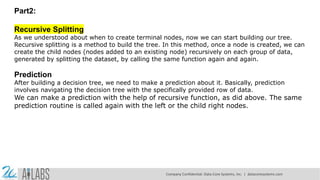
![Output
Confusion Matrix:
[[116 30]
[ 46 39]]
Classification Report:
Accuracy: 0.670995670995671
precision recall f1-score support
0 0.72 0.79 0.75 146
1 0.57 0.46 0.51 85
microavg 0.67 0.67 0.67 231
macroavg 0.64 0.63 0.63 231
weightedavg 0.66 0.67 0.66 231
Company Confidential: Data-Core Systems, Inc. | datacoresystems.com](https://image.slidesharecdn.com/machinelearningwithpython-machinelearningalgorithms-decisiontree-250217162709-713dfac8/85/Machine-Learning-with-Python-Machine-Learning-Algorithms-Decision-Tree-pdf-14-320.jpg)
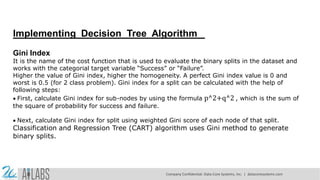
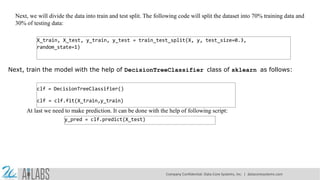
![Visualizing Decision Tree
The above decision tree can be visualized with the help of following code:
from sklearn.tree import export_graphviz
from sklearn.externals.six import StringIO
from IPython.display import Image
import pydotplus
dot_data = StringIO()
export_graphviz(clf, out_file=dot_data,
filled=True, rounded=True,
special_characters=True,feature_names = feature_cols,class_names=['0','1'])
graph = pydotplus.graph_from_dot_data(dot_data.getvalue())
graph.write_png('Pima_diabetes_Tree.png')
Image(graph.create_png())
Company Confidential: Data-Core Systems, Inc. | datacoresystems.com](https://image.slidesharecdn.com/machinelearningwithpython-machinelearningalgorithms-decisiontree-250217162709-713dfac8/85/Machine-Learning-with-Python-Machine-Learning-Algorithms-Decision-Tree-pdf-15-320.jpg)


Machine Learning with Python- Machine Learning Algorithms- Decision Tree.pdf
- 1. Machine Learning with Python Machine Learning Algorithms - Decision Tree Prof.ShibdasDutta, Associate Professor, DCGDATACORESYSTEMSINDIAPVTLTD Kolkata Company Confidential: Data-Core Systems, Inc. | datacoresystems.com
- 2. Machine Learning Algorithms – Classification Algo- Decision Tree Introduction - Decision Tree In general, Decision tree analysis is a predictive modelling tool that can be applied across many areas. Decision trees can be constructed by an algorithmic approach that can split the dataset in different ways based on different conditions. Decisions tress are the most powerful algorithms that falls under the category of supervised algorithms. They can be used for both classification and regression tasks. The two main entities of a tree are decision nodes, where the data is split and leaves, where we got outcome. The example of a binary tree for predicting whether a person is fit or unfit providing various information like age, eating habits and exercise habits, is given below: Company Confidential: Data-Core Systems, Inc. | datacoresystems.com
- 3. No? Person Yes? Eats lots of fast Exercise regularly? Yes? No? Yes? Unfit Fit Fit Unfit No? Company Confidential: Data-Core Systems, Inc. | datacoresystems.com
- 4. In the above decision tree, the question are decision nodes and final outcomes are leaves. We have the following two types of decision trees: Classification decision trees: In this kind of decision trees, the decision variable is categorical. The above decision tree is an example of classification decision tree. Regression decision trees: In this kind of decision trees, the decision variable is continuous. Company Confidential: Data-Core Systems, Inc. | datacoresystems.com
- 5. Implementing Decision Tree Algorithm Gini Index It is the name of the cost function that is used to evaluate the binary splits in the dataset and works with the categorial target variable “Success” or “Failure”. Higher the value of Gini index, higher the homogeneity. A perfect Gini index value is 0 and worst is 0.5 (for 2 class problem). Gini index for a split can be calculated with the help of following steps: First, calculate Gini index for sub-nodes by using the formula p^2+q^2 , which is the sum of the square of probability for success and failure. Next, calculate Gini index for split using weighted Gini score of each node of that split. Classification and Regression Tree (CART) algorithm uses Gini method to generate binary splits. Company Confidential: Data-Core Systems, Inc. | datacoresystems.com
- 6. Split Creation A split is basically including an attribute in the dataset and a value. We can create a split in dataset with the help of following three parts: Part1: Calculating Gini Score: We have just discussed this part in the previous section. Part2: Splitting a dataset: It may be defined as separating a dataset into two lists of rows having index of an attribute and a split value of that attribute. After getting the two groups - right and left, from the dataset, we can calculate the value of split by using Gini score calculated in first part. Split value will decide in which group the attribute will reside. Part3: Evaluating all splits: Next part after finding Gini score and splitting dataset is the evaluation of all splits. For this purpose, first, we must check every value associated with each attribute as a candidate split. Then we need to find the best possible split by evaluating the cost of the split. The best split will be used as a node in the decision tree. Company Confidential: Data-Core Systems, Inc. | datacoresystems.com
- 7. Building a Tree As we know that a tree has root node and terminal nodes. After creating the root node, we can build the tree by following two parts: Part1: Terminal node creation While creating terminal nodes of decision tree, one important point is to decide when to stop growing tree or creating further terminal nodes. It can be done by using two criteria namely maximum tree depth and minimum node records as follows: Maximum Tree Depth: As name suggests, this is the maximum number of the nodes in a tree after root node. We must stop adding terminal nodes once a tree reached at maximum depth i.e. once a tree got maximum number of terminal nodes. Minimum Node Records: It may be defined as the minimum number of training patterns that a given node is responsible for. We must stop adding terminal nodes once tree reached at these minimum node records or below this minimum. Terminal node is used to make a final prediction. Company Confidential: Data-Core Systems, Inc. | datacoresystems.com
- 8. Part2: Recursive Splitting As we understood about when to create terminal nodes, now we can start building our tree. Recursive splitting is a method to build the tree. In this method, once a node is created, we can create the child nodes (nodes added to an existing node) recursively on each group of data, generated by splitting the dataset, by calling the same function again and again. Prediction After building a decision tree, we need to make a prediction about it. Basically, prediction involves navigating the decision tree with the specifically provided row of data. We can make a prediction with the help of recursive function, as did above. The same prediction routine is called again with the left or the child right nodes. Company Confidential: Data-Core Systems, Inc. | datacoresystems.com
- 9. Assumptions The following are some of the assumptions we make while creating decision tree: While preparing decision trees, the training set is as root node. Decision tree classifier prefers the features values to be categorical. In case if you want to use continuous values then they must be done discretized prior to model building. Based on the attribute’s values, the records are recursively distributed. Statistical approach will be used to place attributes at any node position i.e.as root node or internal node. Company Confidential: Data-Core Systems, Inc. | datacoresystems.com
- 10. Implementation in Python Example In the following example, we are going to implement Decision Tree classifier on Pima Indian Diabetes: First, start with importing necessary python packages: import pandas as pd from sklearn.tree import DecisionTreeClassifier from sklearn.model_selection import train_test_split Next, download the iris dataset from its weblink as follows: col_names = ['pregnant', 'glucose', 'bp', 'skin', 'insulin', 'bmi', 'pedigree', 'age', 'label'] pima = pd.read_csv(r"C:pima-indians-diabetes.csv", header=None, names=col_names) pima.head() Company Confidential: Data-Core Systems, Inc. | datacoresystems.com
- 11. pregnant glucose bp skin insulin bmi pedigree age label 0 6 148 72 35 0 33.6 0.627 50 1 1 1 85 66 29 0 26.6 0.351 31 0 2 8 183 64 0 0 23.3 0.672 32 1 3 1 89 66 23 94 28.1 0.167 21 0 4 0 137 40 35 168 43.1 2.288 33 1 Now, split the dataset into features and target variable as follows: feature_cols = ['pregnant', 'insulin', 'bmi', 'age','glucose','bp','pedigree'] X = pima[feature_cols] # Features y = pima.label # Target variable Company Confidential: Data-Core Systems, Inc. | datacoresystems.com
- 12. Next, we will divide the data into train and test split. The following code will split the dataset into 70% training data and 30% of testing data: X_train, X_test, y_train, y_test = train_test_split(X, y, test_size=0.3, random_state=1) Next, train the model with the help of DecisionTreeClassifier class of sklearn as follows: clf = DecisionTreeClassifier() clf = clf.fit(X_train,y_train) At last we need to make prediction. It can be done with the help of following script: y_pred = clf.predict(X_test) Company Confidential: Data-Core Systems, Inc. | datacoresystems.com
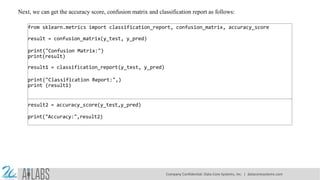
- 13. Next, we can get the accuracy score, confusion matrix and classification report as follows: from sklearn.metrics import classification_report, confusion_matrix, accuracy_score result = confusion_matrix(y_test, y_pred) print("Confusion Matrix:") print(result) result1 = classification_report(y_test, y_pred) print("Classification Report:",) print (result1) result2 = accuracy_score(y_test,y_pred) print("Accuracy:",result2) Company Confidential: Data-Core Systems, Inc. | datacoresystems.com
- 14. Output Confusion Matrix: [[116 30] [ 46 39]] Classification Report: Accuracy: 0.670995670995671 precision recall f1-score support 0 0.72 0.79 0.75 146 1 0.57 0.46 0.51 85 microavg 0.67 0.67 0.67 231 macroavg 0.64 0.63 0.63 231 weightedavg 0.66 0.67 0.66 231 Company Confidential: Data-Core Systems, Inc. | datacoresystems.com
- 15. Visualizing Decision Tree The above decision tree can be visualized with the help of following code: from sklearn.tree import export_graphviz from sklearn.externals.six import StringIO from IPython.display import Image import pydotplus dot_data = StringIO() export_graphviz(clf, out_file=dot_data, filled=True, rounded=True, special_characters=True,feature_names = feature_cols,class_names=['0','1']) graph = pydotplus.graph_from_dot_data(dot_data.getvalue()) graph.write_png('Pima_diabetes_Tree.png') Image(graph.create_png()) Company Confidential: Data-Core Systems, Inc. | datacoresystems.com
- 16. Company Confidential: Data-Core Systems, Inc. | datacoresystems.com
- 17. Thank You Company Confidential: Data-Core Systems, Inc. | datacoresystems.com