SlideShare a Scribd company logo
Machine Learning with Python
Machine Learning Algorithms - K-Means Clustering
Prof.ShibdasDutta,
Associate Professor,
DCGDATACORESYSTEMSINDIAPVTLTD
Kolkata
Company Confidential: Data-Core Systems, Inc. | datacoresystems.com
Machine Learning Algorithms – Classification Algo- K-Means Clustering
Introduction - K-Means Clustering
Before K-Means After K-Means
Clustering System
Company Confidential: Data-Core Systems, Inc. | datacoresystems.com
In general, Clustering is defined as the grouping of data points such that the data points in a group will be similar or
related to one another and different from the data points in another group. The goal of clustering is to determine the
intrinsic grouping in a set of unlabelled data.
K- means is an unsupervised partitional clustering algorithm that is based on grouping data into k – numbers of clusters by
determining centroid using the Euclidean or Manhattan method for distance calculation. It groups the object based on
minimum distance.
euclidean distance formula
Company Confidential: Data-Core Systems, Inc. | datacoresystems.com
ALGORITHM
1. First, initialize the number of clusters, K (Elbow method is generally used in selecting the number of clusters )
2. Randomly select the k data points for centroid. A centroid is the imaginary or real location representing the center of
the cluster.
3. Categorize each data items to its closest centroid and update the centroid coordinates calculating the average of items
coordinates categorized in that group so far
4. Repeat the process for a number of iterations till successive iterations clusters data items into the same group
Company Confidential: Data-Core Systems, Inc. | datacoresystems.com
HOW IT WORKS ?
In the beginning, the algorithm chooses k centroids in the dataset randomly after shuffling the data. Then it calculates
the distance of each point to each centroid using the euclidean distance calculation method. Each centroid assigned
represents a cluster and the points are assigned to the closest cluster. At the end of the first iteration, the centroid values
are recalculated, usually taking the arithmetic mean of all points in the cluster. In every iteration, new centroid values
are calculated until successive iterations provide the same centroid value.
Let’s kick off K-Means Clustering Scratch with a simple example: Suppose we have data points (1,1), (1.5,2), (3,4), (5,7),
(3.5,5), (4.5,5), (3.5,4.5). Let us suppose k = 2 i.e. dataset should be grouped in two clusters. Here we are using the
Euclidean distance method.
Company Confidential: Data-Core Systems, Inc. | datacoresystems.com
Step 1 : It is already defined that k = 2 for this problem
Step-2: Since k = 2, we are randomly selecting two centroid as c1(1,1) and c2(5,7)
Step 3: Now, we calculate the distance of each point to each centroid using the euclidean distance calculation method
using Pythogoras theoream :
ITERATION 01
X1 Y1 X2 Y2 D1 X1 Y1 X2 Y2 D2 Remarks
1 1 1 1 0 1 1 5 7 7.21 D1<D2 : (1,1) belongs to c1
1.5 2 1 1 1.12 1.5 2 5 7 6.1 D1<D2 : (1.5,2) belongs to c1
3 4 1 1 3.61 3 4 5 7 3.61 D1<D2 : (3,4) belongs to c1
5 7 1 1 7.21 5 7 5 7 0 D1>D2 : (5,7) belongs to c2
3.5 5 1 1 4.72 3.5 5 5 7 2.5 D1>D2 : (3.5,5) belongs to c2
4.5 5 1 1 5.32 4.5 5 5 7 2.06 D1>D2 : (5.5,5) belongs to c2
3.5 4.5 1 1 4.3 3.5 4.5 5 7 2.91 D1>D2 : (3.5,4.5) belongs to c2
Company Confidential: Data-Core Systems, Inc. | datacoresystems.com
Note: D1 & D2 are euclidean distance between centroid (x2,y2) and data points (x1,y1)
In cluster c1 we have (1,1), (1.5,2) and (3,4) whereas centroid c2 contains (5,7), (3.5,5), (4.5,5) & (3.5,4.5). Here, a new
centroid is the algebraic mean of all the data items in a cluster.
C1(new) = ( (1+1.5+3)/3 , (1+2+4)/3) = (1.83, 2.33)
C2(new) = ((5+3.5+4.5+3.5)/4, (7+5+5+4.5)/4) = (4.125, 5.375)
Company Confidential: Data-Core Systems, Inc. | datacoresystems.com
ITERATION 02
X1 Y1 X2 Y2 D1 X1 Y1 X2 Y2 D2 Remarks
1 1 1.83 2.33 1.56 1 1 4.12 5.37 5.37 (1,1) belongs to c1
1.5 2 1.83 2.33 0.46 1.5 2 4.12 5.37 4.27 (1.5,2) belongs to c1
3 4 1.83 2.33 2.03 3 4 4.12 5.37 1.77 (3,4) belongs to c2
5 7 1.83 2.33 5.64 5 7 4.12 5.37 1.84 (5,7) belongs to c2
3.5 5 1.83 2.33 3.14 3.5 5 4.12 5.37 0.72 (3.5,5) belongs to c2
4.5 5 1.83 2.33 3.77 4.5 5 4.12 5.37 0.53 (5.5,5) belongs to c2
3.5 4.5 1.83 2.33 2.73 3.5 4.5 4.12 5.37 1.07 (3.5,4.5) belongs to c2
In cluster c1 we have (1,1), (1.5,2) ) whereas centroid c2 contains (3,4),(5,7), (3.5,5), (4.5,5) & (3.5,4.5). Here, new
centroid is the algebraic mean of all the data items in a cluster.
C1(new) = ( (1+1.5)/2 , (1+2)/2) = (1.25,1.5)
C2(new) = ((3+5+3.5+4.5+3.5)/5, (4+7+5+5+4.5)/5) = (3.9, 5.1)
Company Confidential: Data-Core Systems, Inc. | datacoresystems.com
ITERATION 03
X1 Y1 X2 Y2 D1 X1 Y1 X2 Y2 D2 Remarks
1 1 1.25 1.5 0.56 1 1 3.9 5.1 5.02 (1,1) belongs to c1
1.5 2 1.25 1.5 0.56 1.5 2 3.9 5.1 3.92 (1.5,2) belongs to c1
3 4 1.25 1.5 3.05 3 4 3.9 5.1 1.42 (3,4) belongs to c2
5 7 1.25 1.5 6.66 5 7 3.9 5.1 2.19 (5,7) belongs to c2
3.5 5 1.25 1.5 4.16 3.5 5 3.9 5.1 0.41 (3.5,5) belongs to c2
4.5 5 1.25 1.5 4.77 4.5 5 3.9 5.1 0.60 (5.5,5) belongs to c2
3.5 4.5 1.25 1.5 3.75 3.5 4.5 3.9 5.1 0.72 (3.5,4.5) belongs to c2
In cluster c1 we have (1,1), (1.5,2) ) whereas centroid c2 contains (3,4),(5,7), (3.5,5), (4.5,5) & (3.5,4.5). Here, new
centroid is the algebraic mean of all the data items in a cluster.
C1(new) = ( (1+1.5)/2 , (1+2)/2) = (1.25,1.5)
C2(new) = ((3+5+3.5+4.5+3.5)/5, (4+7+5+5+4.5)/5) = (3.9, 5.1)
Step 04: In the 2nd and 3rd iteration, we obtained the same centroid points. Hence clusters of above data point is :
Company Confidential: Data-Core Systems, Inc. | datacoresystems.com
K-Means Clustering Code
So far, we have learnt about the introduction to the K-Means algorithm. We have learnt in detail about the mathematics
behind the K-means clustering algorithm and have learnt how Euclidean distance method is used in grouping the data
items in K number of clusters.
Here were are implementing K-means clustering using python.
But the problem is how to choose the number of clusters?
In this example, assigning the number of clusters ourselves and later we will be discussing various ways of finding the
best number of clusters.
import pandas as pd
import numpy as np
import random as rd
import matplotlib.pyplot as plt
import math
class K_Means:
def __init__(self, k=2, tolerance = 0.001, max_iter = 500):
self.k = k
self.max_iterations = max_iter
self.tolerance = tolerance
Company Confidential: Data-Core Systems, Inc. | datacoresystems.com
We have defined a K-means class with init consisting default value of k as 2, error tolerance as 0.001, and maximum
iteration as 500.
Before diving into the code, let’s remember some mathematical terms involved in K-means clustering:- centroids &
euclidean distance. On a quick note centroid of a data is the average or mean of the data and Euclidean distance is the
distance between two points in the coordinate plane calculated using Pythagoras theorem.
def euclidean_distance(self, point1, point2):
#return math.sqrt((point1[0]-point2[0])**2 + (point1[1]-point2[1])**2 + (point1[2]-point2[2])**2)
#sqrt((x1-x2)^2 + (y1-y2)^2)
return np.linalg.norm(point1-point2, axis=0)
We find the euclidean distance from each point to all the centroids. If you look for efficiency it is better to use the NumPy
function (np.linalg.norm(point1-point2, axis=0))
def fit(self, data):
self.centroids = {}
for i in range(self.k):
self.centroids[i] = data[i]
Company Confidential: Data-Core Systems, Inc. | datacoresystems.com
ASSIGNING CENTROIDS
There are various methods of assigning k centroid initially. Mostly used is a random selection but let’s go in the most basic
way. We assign the first k points from the dataset as the initial centroids.
for i in range(self.max_iterations):
self.classes = {}
for j in range(self.k):
self.classes[j] = []
for point in data:
distances = []
for index in self.centroids:
distances.append(self.euclidean_distance(point,self.centroids[index]))
cluster_index = distances.index(min(distances))
self.classes[cluster_index].append(point)
Company Confidential: Data-Core Systems, Inc. | datacoresystems.com
Till now, we have defined the K-means class and initialized some default parameters. We have defined the euclidean
distance calculation function and we have also assigned initial k clusters. Now, In order to know which cluster and data
item belong to, we are calculating Euclidean distance from the data items to each centroid. Data item closest to the
cluster belongs to that respective cluster.
previous = dict(self.centroids)
for cluster_index in self.classes:
self.centroids[cluster_index] = np.average(self.classes[cluster_index], axis = 0)
isOptimal = True
for centroid in self.centroids:
original_centroid = previous[centroid]
curr = self.centroids[centroid]
if np.sum((curr - original_centroid)/original_centroid * 100.0) > self.tolerance:
isOptimal = False
if isOptimal:
break
At the end of the first iteration, the centroid values are recalculated, usually taking the arithmetic mean of all points in
the cluster. In every iteration, new centroid values are calculated until successive iterations provide the same centroid
value.
Company Confidential: Data-Core Systems, Inc. | datacoresystems.com
CLUSTERING WITH DEMO DATA
We’ve now completed the K Means scratch code of this Machine Learning tutorial series. Now, let’s test our code by
clustering with randomly generated data:
#generate dummy cluster datasets
# Set three centers, the model should predict similar results
center_1 = np.array([1,1])
center_2 = np.array([5,5])
center_3 = np.array([8,1])
# Generate random data and center it to the three centers
cluster_1 = np.random.randn(100, 2) + center_1
cluster_2 = np.random.randn(100,2) + center_2
cluster_3 = np.random.randn(100,2) + center_3
data = np.concatenate((cluster_1, cluster_2, cluster_3), axis = 0)
Here we have created 3 groups of data of two-dimension with a different centre. We have defined the value of k as 3.
Now, let’s fit the model created
Company Confidential: Data-Core Systems, Inc. | datacoresystems.com
k_means = K_Means(K)
k_means.fit(data)
# Plotting starts here
colors = 10*["r", "g", "c", "b", "k"]
for centroid in k_means.centroids:
plt.scatter(k_means.centroids[centroid][0], k_means.centroids[centroid][1], s = 130, marker = "x")
for cluster_index in k_means.classes:
color = colors[cluster_index]
for features in k_means.classes[cluster_index]:
plt.scatter(features[0], features[1], color = color,s = 30)
K-Means Clustering
Company Confidential: Data-Core Systems, Inc. | datacoresystems.com
CHOOSING VALUE OF K
While working with the k-means clustering scratch, one thing we must keep in mind is the number of clusters ‘k’. We
should make sure that we are choosing the optimum number of clusters for the given data set. But, here arises a
question, how to choose the optimum value of k ?? We use the elbow method which is generally used in analyzing the
optimum value of k.
The Elbow method is based on the principle that “Sum of squares of distances of every data point from its
corresponding cluster centroid should be as minimum as possible”.
STEPS OF CHOOSING BEST K VALUE
1. Run k-means clustering model on various values of k
2. For each value of K, calculate the Sum of squares of distances of every data point from its corresponding cluster centroid
which is called WCSS ( Within-Cluster Sums of Squares)
3. Plot the value of WCSS with respect to various values of K
4. To select the value of k, we choose the value where there is bend (knee) on the plot i.e. WCSS isn’t increasing rapidly.
Company Confidential: Data-Core Systems, Inc. | datacoresystems.com
elbow method to find k
Company Confidential: Data-Core Systems, Inc. | datacoresystems.com
from sklearn.metrics import accuracy_score
from sklearn.cluster import KMeans
# Load the data
X = pd.read_csv('data.csv').drop('label', axis=1)
y = pd.read_csv('data.csv')['label']
# Create the KMeans model
kmeans = KMeans(n_clusters=3)
# Fit the model to the data
kmeans.fit(X)
# Predict the labels for the data
y_pred = kmeans.predict(X)
# Calculate the accuracy
accuracy = accuracy_score(y, y_pred)
# Print the accuracy
print(accuracy)
Find out Accuracy Score in K-Means Clustering Algo
Company Confidential: Data-Core Systems, Inc. | datacoresystems.com
import numpy as np
from sklearn.metrics import confusion_matrix
import matplotlib.pyplot as plt
# Create the data
X = np.random.randn(100, 2)
y = np.random.randint(0, 2, size=100)
# Fit the KMeans model
kmeans = KMeans(n_clusters=2)
kmeans.fit(X)
# Predict the labels
y_pred = kmeans.predict(X)
# Create the confusion matrix
cm = confusion_matrix(y, y_pred)
Plotting of Confusion Matrix in K-Means Clustering Algo
Company Confidential: Data-Core Systems, Inc. | datacoresystems.com
# Plot the confusion matrix
plt.imshow(cm, interpolation='nearest', cmap=plt.cm.Blues)
plt.title('Confusion matrix')
plt.colorbar()
tick_marks = np.arange(len(kmeans.classes_))
plt.xticks(tick_marks, kmeans.classes_, rotation=45)
plt.yticks(tick_marks, kmeans.classes_)
fmt = '.2f'
thresh = cm.max() / 2.
for i, j in itertools.product(range(cm.shape[0]), range(cm.shape[1])):
plt.text(j, i, format(cm[i, j], fmt),
horizontalalignment="center",
color="white" if cm[i, j] > thresh else "black")
plt.tight_layout()
plt.ylabel('True/Actual label')
plt.xlabel('Predicted label')
plt.show()
Company Confidential: Data-Core Systems, Inc. | datacoresystems.com
PROS OF K-MEANS
1. Relatively simple to learn and understand as the algorithm solely depends on the euclidean method of distance
calculation.
2. K means works on minimizing Sum of squares of distances, hence it guarantees convergence
3. Computational cost is O(K*n*d), hence K means is fast and efficient
CONS OF K-MEANS
1. Difficulty in choosing the optimum number of clusters K
2. K means has a problem when clusters are of different size, densities, and non-globular shapes
3. K means has problems when data contains outliers
4. As the number of dimensions increases, the difficulty in getting the algorithm to converge increases due to the curse of
dimensionality
5. If there is overlapping between clusters, k-means doesn’t have an intrinsic measure for uncertainty
Company Confidential: Data-Core Systems, Inc. | datacoresystems.com
Applications of K- Means Clustering Algorithm
The main goals of cluster analysis are:
To get a meaningful intuition from the data we are working with.
Cluster-then-predict where different models will be built for different subgroups.
To fulfill the above-mentioned goals, K-means clustering is performing well enough.
It can be used in following applications:
Market segmentation
Document Clustering
Image segmentation
Image compression
Customer segmentation
Analyzing the trend on dynamic data
Company Confidential: Data-Core Systems, Inc. | datacoresystems.com
Thank You
Company Confidential: Data-Core Systems, Inc. | datacoresystems.com
Ad

Recommended

COMPUTER VISION UNIT 4 BSC CS WITH AI MADRAS UNIVERSITY
jayalakshmimcastaff
 
New Approach for K-mean and K-medoids Algorithm
Editor IJCATR
 
Welcome to International Journal of Engineering Research and Development (IJERD)
IJERD Editor
 
Lec13 Clustering.pptx
Khalid Rabayah
 
Lect4
Lect4
sumit621
 
Kmeans
Kmeans
Nikita Goyal
 
Project PPT
Project PPT
Dhaarna Singh
 
Machine Learning, K-means Algorithm Implementation with R
IRJET Journal
 
Log Analytics in Datacenter with Apache Spark and Machine Learning
Piotr Tylenda
 
Log Analytics in Datacenter with Apache Spark and Machine Learning
Agnieszka Potulska
 
ML basic &amp; clustering
monalisa Das
 
MLT Unit4.pdfgmgkgmflbmrfmbrfmbfrmbofl;mb;lf
1052LaxmanrajS
 
MLT Unit4.pdffdhngnrfgrgrfflmbpmpphfhbomf
1052LaxmanrajS
 
Premeditated Initial Points for K-Means Clustering
IJCSIS Research Publications
 
Machine Learning: Classification Concepts (Part 1)
Daniel Chan
 
Data clustering
Data clustering
GARIMA SHAKYA
 
11-2-Clustering.pptx
paktari1
 
Novel algorithms for Knowledge discovery from neural networks in Classificat...
Dr.(Mrs).Gethsiyal Augasta
 
cluster(python)
cluster(python)
Noriyuki Kojima
 
Unit4_Clustering k means_Clustering in ML.pdf
rameshwarchintamani
 
Anomaly Detection in Temporal data Using Kmeans Clustering with C5.0
theijes
 
Chapter#04[Part#01]K-Means Clusterig.pdf
MaheenVohra
 
k-mean medoid and-knn-algorithm problems.pptx
DulalChandraDas1
 
An improvement in k mean clustering algorithm using better time and accuracy
ijpla
 
Optimising Data Using K-Means Clustering Algorithm
IJERA Editor
 
Machine Learning in R
SujaAldrin
 
The International Journal of Engineering and Science (The IJES)
theijes
 
K-means machine learning clustering .pptx
asmaashalma456
 
Machine Learning with Python- Machine Learning Algorithms.pdf
KalighatOkira
 
Machine Learning with Python- Machine Learning Algorithms- Naïve Bayes.pdf
KalighatOkira
 

More Related Content

Similar to Machine Learning with Python- Machine Learning Algorithms- K-Means Clustering Algo.pdf (20)

Log Analytics in Datacenter with Apache Spark and Machine Learning
Piotr Tylenda
 
Log Analytics in Datacenter with Apache Spark and Machine Learning
Agnieszka Potulska
 
ML basic &amp; clustering
monalisa Das
 
MLT Unit4.pdfgmgkgmflbmrfmbrfmbfrmbofl;mb;lf
1052LaxmanrajS
 
MLT Unit4.pdffdhngnrfgrgrfflmbpmpphfhbomf
1052LaxmanrajS
 
Premeditated Initial Points for K-Means Clustering
IJCSIS Research Publications
 
Machine Learning: Classification Concepts (Part 1)
Daniel Chan
 
Data clustering
Data clustering
GARIMA SHAKYA
 
11-2-Clustering.pptx
paktari1
 
Novel algorithms for Knowledge discovery from neural networks in Classificat...
Dr.(Mrs).Gethsiyal Augasta
 
cluster(python)
cluster(python)
Noriyuki Kojima
 
Unit4_Clustering k means_Clustering in ML.pdf
rameshwarchintamani
 
Anomaly Detection in Temporal data Using Kmeans Clustering with C5.0
theijes
 
Chapter#04[Part#01]K-Means Clusterig.pdf
MaheenVohra
 
k-mean medoid and-knn-algorithm problems.pptx
DulalChandraDas1
 
An improvement in k mean clustering algorithm using better time and accuracy
ijpla
 
Optimising Data Using K-Means Clustering Algorithm
IJERA Editor
 
Machine Learning in R
SujaAldrin
 
The International Journal of Engineering and Science (The IJES)
theijes
 
K-means machine learning clustering .pptx
asmaashalma456
 
Log Analytics in Datacenter with Apache Spark and Machine Learning
Piotr Tylenda
 
Log Analytics in Datacenter with Apache Spark and Machine Learning
Agnieszka Potulska
 
ML basic &amp; clustering
monalisa Das
 
MLT Unit4.pdfgmgkgmflbmrfmbrfmbfrmbofl;mb;lf
1052LaxmanrajS
 
MLT Unit4.pdffdhngnrfgrgrfflmbpmpphfhbomf
1052LaxmanrajS
 
Premeditated Initial Points for K-Means Clustering
IJCSIS Research Publications
 
Machine Learning: Classification Concepts (Part 1)
Daniel Chan
 
11-2-Clustering.pptx
paktari1
 
Novel algorithms for Knowledge discovery from neural networks in Classificat...
Dr.(Mrs).Gethsiyal Augasta
 
Unit4_Clustering k means_Clustering in ML.pdf
rameshwarchintamani
 
Anomaly Detection in Temporal data Using Kmeans Clustering with C5.0
theijes
 
Chapter#04[Part#01]K-Means Clusterig.pdf
MaheenVohra
 
k-mean medoid and-knn-algorithm problems.pptx
DulalChandraDas1
 
An improvement in k mean clustering algorithm using better time and accuracy
ijpla
 
Optimising Data Using K-Means Clustering Algorithm
IJERA Editor
 
Machine Learning in R
SujaAldrin
 
The International Journal of Engineering and Science (The IJES)
theijes
 
K-means machine learning clustering .pptx
asmaashalma456
 

More from KalighatOkira (6)

Machine Learning with Python- Machine Learning Algorithms.pdf
KalighatOkira
 
Machine Learning with Python- Machine Learning Algorithms- Naïve Bayes.pdf
KalighatOkira
 
Machine Learning with Python- Machine Learning Algorithms- Logistic Regressio...
KalighatOkira
 
Machine Learning with Python- Machine Learning Algorithms- Decision Tree.pdf
KalighatOkira
 
Machine Learning with Python- Machine Learning Algorithms- Random Forest.pdf
KalighatOkira
 
Basics of C Prog Lang.pdf
KalighatOkira
 
Ad

Recently uploaded (20)

輪読会資料_Miipher and Miipher2 .
NABLAS株式会社
 
Solar thermal – Flat plate and concentrating collectors .pptx
jdaniabraham1
 
NEW Strengthened Senior High School Gen Math.pptx
DaryllWhere
 
Bitumen Emulsion by Dr Sangita Ex CRRI Delhi
grilcodes
 
Rapid Prototyping for XR: Lecture 5 - Cross Platform Development
Mark Billinghurst
 
Modern multi-proposer consensus implementations
François Garillot
 
Rapid Prototyping for XR: Lecture 2 - Low Fidelity Prototyping.
Mark Billinghurst
 
Tally.ERP 9 at a Glance.book - Tally Solutions .pdf
Shabista Imam
 
Deep Learning for Image Processing on 16 June 2025 MITS.pptx
resming1
 
Rapid Prototyping for XR: Lecture 6 - AI for Prototyping and Research Directi...
Mark Billinghurst
 
FSE-Journal-First-Automated code editing with search-generate-modify.pdf
cl144
 
DESIGN OF REINFORCED CONCRETE ELEMENTS S
prabhusp8
 
Industry 4.o the fourth revolutionWeek-2.pptx
KNaveenKumarECE
 
retina_biometrics ruet rajshahi bangdesh.pptx
MdRakibulIslam697135
 
Industrial internet of things IOT Week-3.pptx
KNaveenKumarECE
 
20CE404-Soil Mechanics - Slide Share PPT
saravananr808639
 
How to Un-Obsolete Your Legacy Keypad Design
Epec Engineered Technologies
 
FUNDAMENTALS OF COMPUTER ORGANIZATION AND ARCHITECTURE
Shabista Imam
 
International Journal of Advanced Information Technology (IJAIT)
ijait
 
AI_Presentation (1). Artificial intelligence
RoselynKaur8thD34
 
輪読会資料_Miipher and Miipher2 .
NABLAS株式会社
 
Solar thermal – Flat plate and concentrating collectors .pptx
jdaniabraham1
 
NEW Strengthened Senior High School Gen Math.pptx
DaryllWhere
 
Bitumen Emulsion by Dr Sangita Ex CRRI Delhi
grilcodes
 
Rapid Prototyping for XR: Lecture 5 - Cross Platform Development
Mark Billinghurst
 
Modern multi-proposer consensus implementations
François Garillot
 
Rapid Prototyping for XR: Lecture 2 - Low Fidelity Prototyping.
Mark Billinghurst
 
Tally.ERP 9 at a Glance.book - Tally Solutions .pdf
Shabista Imam
 
Deep Learning for Image Processing on 16 June 2025 MITS.pptx
resming1
 
Rapid Prototyping for XR: Lecture 6 - AI for Prototyping and Research Directi...
Mark Billinghurst
 
FSE-Journal-First-Automated code editing with search-generate-modify.pdf
cl144
 
DESIGN OF REINFORCED CONCRETE ELEMENTS S
prabhusp8
 
Industry 4.o the fourth revolutionWeek-2.pptx
KNaveenKumarECE
 
retina_biometrics ruet rajshahi bangdesh.pptx
MdRakibulIslam697135
 
Industrial internet of things IOT Week-3.pptx
KNaveenKumarECE
 
20CE404-Soil Mechanics - Slide Share PPT
saravananr808639
 
FUNDAMENTALS OF COMPUTER ORGANIZATION AND ARCHITECTURE
Shabista Imam
 
International Journal of Advanced Information Technology (IJAIT)
ijait
 
AI_Presentation (1). Artificial intelligence
RoselynKaur8thD34
 
Ad

Machine Learning with Python- Machine Learning Algorithms- K-Means Clustering Algo.pdf

  • 1. Machine Learning with Python Machine Learning Algorithms - K-Means Clustering Prof.ShibdasDutta, Associate Professor, DCGDATACORESYSTEMSINDIAPVTLTD Kolkata Company Confidential: Data-Core Systems, Inc. | datacoresystems.com
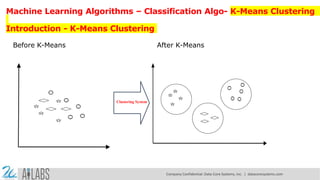
  • 2. Machine Learning Algorithms – Classification Algo- K-Means Clustering Introduction - K-Means Clustering Before K-Means After K-Means Clustering System Company Confidential: Data-Core Systems, Inc. | datacoresystems.com
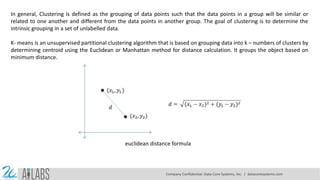
  • 3. In general, Clustering is defined as the grouping of data points such that the data points in a group will be similar or related to one another and different from the data points in another group. The goal of clustering is to determine the intrinsic grouping in a set of unlabelled data. K- means is an unsupervised partitional clustering algorithm that is based on grouping data into k – numbers of clusters by determining centroid using the Euclidean or Manhattan method for distance calculation. It groups the object based on minimum distance. euclidean distance formula Company Confidential: Data-Core Systems, Inc. | datacoresystems.com
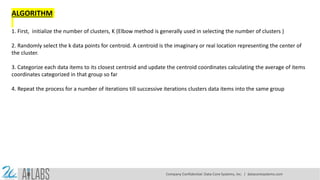
  • 4. ALGORITHM 1. First, initialize the number of clusters, K (Elbow method is generally used in selecting the number of clusters ) 2. Randomly select the k data points for centroid. A centroid is the imaginary or real location representing the center of the cluster. 3. Categorize each data items to its closest centroid and update the centroid coordinates calculating the average of items coordinates categorized in that group so far 4. Repeat the process for a number of iterations till successive iterations clusters data items into the same group Company Confidential: Data-Core Systems, Inc. | datacoresystems.com
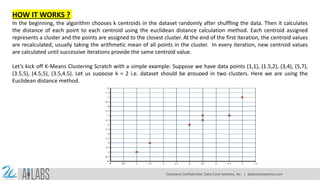
  • 5. HOW IT WORKS ? In the beginning, the algorithm chooses k centroids in the dataset randomly after shuffling the data. Then it calculates the distance of each point to each centroid using the euclidean distance calculation method. Each centroid assigned represents a cluster and the points are assigned to the closest cluster. At the end of the first iteration, the centroid values are recalculated, usually taking the arithmetic mean of all points in the cluster. In every iteration, new centroid values are calculated until successive iterations provide the same centroid value. Let’s kick off K-Means Clustering Scratch with a simple example: Suppose we have data points (1,1), (1.5,2), (3,4), (5,7), (3.5,5), (4.5,5), (3.5,4.5). Let us suppose k = 2 i.e. dataset should be grouped in two clusters. Here we are using the Euclidean distance method. Company Confidential: Data-Core Systems, Inc. | datacoresystems.com
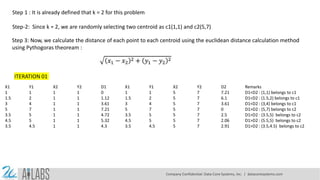
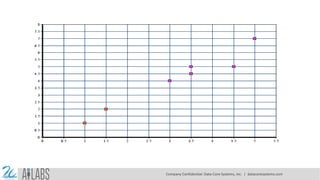
  • 6. Step 1 : It is already defined that k = 2 for this problem Step-2: Since k = 2, we are randomly selecting two centroid as c1(1,1) and c2(5,7) Step 3: Now, we calculate the distance of each point to each centroid using the euclidean distance calculation method using Pythogoras theoream : ITERATION 01 X1 Y1 X2 Y2 D1 X1 Y1 X2 Y2 D2 Remarks 1 1 1 1 0 1 1 5 7 7.21 D1<D2 : (1,1) belongs to c1 1.5 2 1 1 1.12 1.5 2 5 7 6.1 D1<D2 : (1.5,2) belongs to c1 3 4 1 1 3.61 3 4 5 7 3.61 D1<D2 : (3,4) belongs to c1 5 7 1 1 7.21 5 7 5 7 0 D1>D2 : (5,7) belongs to c2 3.5 5 1 1 4.72 3.5 5 5 7 2.5 D1>D2 : (3.5,5) belongs to c2 4.5 5 1 1 5.32 4.5 5 5 7 2.06 D1>D2 : (5.5,5) belongs to c2 3.5 4.5 1 1 4.3 3.5 4.5 5 7 2.91 D1>D2 : (3.5,4.5) belongs to c2 Company Confidential: Data-Core Systems, Inc. | datacoresystems.com
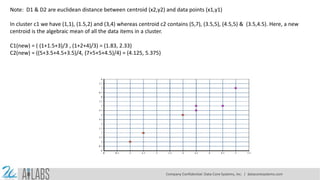
  • 7. Note: D1 & D2 are euclidean distance between centroid (x2,y2) and data points (x1,y1) In cluster c1 we have (1,1), (1.5,2) and (3,4) whereas centroid c2 contains (5,7), (3.5,5), (4.5,5) & (3.5,4.5). Here, a new centroid is the algebraic mean of all the data items in a cluster. C1(new) = ( (1+1.5+3)/3 , (1+2+4)/3) = (1.83, 2.33) C2(new) = ((5+3.5+4.5+3.5)/4, (7+5+5+4.5)/4) = (4.125, 5.375) Company Confidential: Data-Core Systems, Inc. | datacoresystems.com
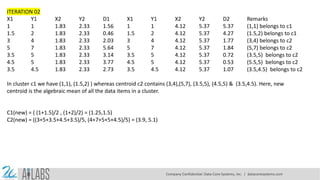
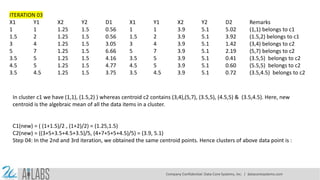
  • 8. ITERATION 02 X1 Y1 X2 Y2 D1 X1 Y1 X2 Y2 D2 Remarks 1 1 1.83 2.33 1.56 1 1 4.12 5.37 5.37 (1,1) belongs to c1 1.5 2 1.83 2.33 0.46 1.5 2 4.12 5.37 4.27 (1.5,2) belongs to c1 3 4 1.83 2.33 2.03 3 4 4.12 5.37 1.77 (3,4) belongs to c2 5 7 1.83 2.33 5.64 5 7 4.12 5.37 1.84 (5,7) belongs to c2 3.5 5 1.83 2.33 3.14 3.5 5 4.12 5.37 0.72 (3.5,5) belongs to c2 4.5 5 1.83 2.33 3.77 4.5 5 4.12 5.37 0.53 (5.5,5) belongs to c2 3.5 4.5 1.83 2.33 2.73 3.5 4.5 4.12 5.37 1.07 (3.5,4.5) belongs to c2 In cluster c1 we have (1,1), (1.5,2) ) whereas centroid c2 contains (3,4),(5,7), (3.5,5), (4.5,5) & (3.5,4.5). Here, new centroid is the algebraic mean of all the data items in a cluster. C1(new) = ( (1+1.5)/2 , (1+2)/2) = (1.25,1.5) C2(new) = ((3+5+3.5+4.5+3.5)/5, (4+7+5+5+4.5)/5) = (3.9, 5.1) Company Confidential: Data-Core Systems, Inc. | datacoresystems.com
  • 9. Company Confidential: Data-Core Systems, Inc. | datacoresystems.com
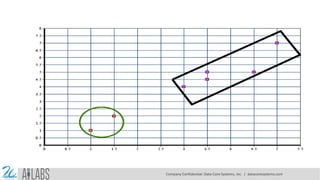
  • 10. ITERATION 03 X1 Y1 X2 Y2 D1 X1 Y1 X2 Y2 D2 Remarks 1 1 1.25 1.5 0.56 1 1 3.9 5.1 5.02 (1,1) belongs to c1 1.5 2 1.25 1.5 0.56 1.5 2 3.9 5.1 3.92 (1.5,2) belongs to c1 3 4 1.25 1.5 3.05 3 4 3.9 5.1 1.42 (3,4) belongs to c2 5 7 1.25 1.5 6.66 5 7 3.9 5.1 2.19 (5,7) belongs to c2 3.5 5 1.25 1.5 4.16 3.5 5 3.9 5.1 0.41 (3.5,5) belongs to c2 4.5 5 1.25 1.5 4.77 4.5 5 3.9 5.1 0.60 (5.5,5) belongs to c2 3.5 4.5 1.25 1.5 3.75 3.5 4.5 3.9 5.1 0.72 (3.5,4.5) belongs to c2 In cluster c1 we have (1,1), (1.5,2) ) whereas centroid c2 contains (3,4),(5,7), (3.5,5), (4.5,5) & (3.5,4.5). Here, new centroid is the algebraic mean of all the data items in a cluster. C1(new) = ( (1+1.5)/2 , (1+2)/2) = (1.25,1.5) C2(new) = ((3+5+3.5+4.5+3.5)/5, (4+7+5+5+4.5)/5) = (3.9, 5.1) Step 04: In the 2nd and 3rd iteration, we obtained the same centroid points. Hence clusters of above data point is : Company Confidential: Data-Core Systems, Inc. | datacoresystems.com
  • 11. Company Confidential: Data-Core Systems, Inc. | datacoresystems.com
  • 12. K-Means Clustering Code So far, we have learnt about the introduction to the K-Means algorithm. We have learnt in detail about the mathematics behind the K-means clustering algorithm and have learnt how Euclidean distance method is used in grouping the data items in K number of clusters. Here were are implementing K-means clustering using python. But the problem is how to choose the number of clusters? In this example, assigning the number of clusters ourselves and later we will be discussing various ways of finding the best number of clusters. import pandas as pd import numpy as np import random as rd import matplotlib.pyplot as plt import math class K_Means: def __init__(self, k=2, tolerance = 0.001, max_iter = 500): self.k = k self.max_iterations = max_iter self.tolerance = tolerance Company Confidential: Data-Core Systems, Inc. | datacoresystems.com
  • 13. We have defined a K-means class with init consisting default value of k as 2, error tolerance as 0.001, and maximum iteration as 500. Before diving into the code, let’s remember some mathematical terms involved in K-means clustering:- centroids & euclidean distance. On a quick note centroid of a data is the average or mean of the data and Euclidean distance is the distance between two points in the coordinate plane calculated using Pythagoras theorem. def euclidean_distance(self, point1, point2): #return math.sqrt((point1[0]-point2[0])**2 + (point1[1]-point2[1])**2 + (point1[2]-point2[2])**2) #sqrt((x1-x2)^2 + (y1-y2)^2) return np.linalg.norm(point1-point2, axis=0) We find the euclidean distance from each point to all the centroids. If you look for efficiency it is better to use the NumPy function (np.linalg.norm(point1-point2, axis=0)) def fit(self, data): self.centroids = {} for i in range(self.k): self.centroids[i] = data[i] Company Confidential: Data-Core Systems, Inc. | datacoresystems.com
  • 14. ASSIGNING CENTROIDS There are various methods of assigning k centroid initially. Mostly used is a random selection but let’s go in the most basic way. We assign the first k points from the dataset as the initial centroids. for i in range(self.max_iterations): self.classes = {} for j in range(self.k): self.classes[j] = [] for point in data: distances = [] for index in self.centroids: distances.append(self.euclidean_distance(point,self.centroids[index])) cluster_index = distances.index(min(distances)) self.classes[cluster_index].append(point) Company Confidential: Data-Core Systems, Inc. | datacoresystems.com
  • 15. Till now, we have defined the K-means class and initialized some default parameters. We have defined the euclidean distance calculation function and we have also assigned initial k clusters. Now, In order to know which cluster and data item belong to, we are calculating Euclidean distance from the data items to each centroid. Data item closest to the cluster belongs to that respective cluster. previous = dict(self.centroids) for cluster_index in self.classes: self.centroids[cluster_index] = np.average(self.classes[cluster_index], axis = 0) isOptimal = True for centroid in self.centroids: original_centroid = previous[centroid] curr = self.centroids[centroid] if np.sum((curr - original_centroid)/original_centroid * 100.0) > self.tolerance: isOptimal = False if isOptimal: break At the end of the first iteration, the centroid values are recalculated, usually taking the arithmetic mean of all points in the cluster. In every iteration, new centroid values are calculated until successive iterations provide the same centroid value. Company Confidential: Data-Core Systems, Inc. | datacoresystems.com
  • 16. CLUSTERING WITH DEMO DATA We’ve now completed the K Means scratch code of this Machine Learning tutorial series. Now, let’s test our code by clustering with randomly generated data: #generate dummy cluster datasets # Set three centers, the model should predict similar results center_1 = np.array([1,1]) center_2 = np.array([5,5]) center_3 = np.array([8,1]) # Generate random data and center it to the three centers cluster_1 = np.random.randn(100, 2) + center_1 cluster_2 = np.random.randn(100,2) + center_2 cluster_3 = np.random.randn(100,2) + center_3 data = np.concatenate((cluster_1, cluster_2, cluster_3), axis = 0) Here we have created 3 groups of data of two-dimension with a different centre. We have defined the value of k as 3. Now, let’s fit the model created Company Confidential: Data-Core Systems, Inc. | datacoresystems.com
  • 17. k_means = K_Means(K) k_means.fit(data) # Plotting starts here colors = 10*["r", "g", "c", "b", "k"] for centroid in k_means.centroids: plt.scatter(k_means.centroids[centroid][0], k_means.centroids[centroid][1], s = 130, marker = "x") for cluster_index in k_means.classes: color = colors[cluster_index] for features in k_means.classes[cluster_index]: plt.scatter(features[0], features[1], color = color,s = 30) K-Means Clustering Company Confidential: Data-Core Systems, Inc. | datacoresystems.com
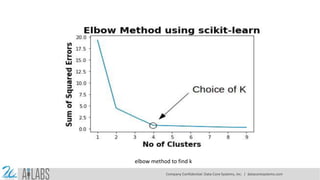
  • 18. CHOOSING VALUE OF K While working with the k-means clustering scratch, one thing we must keep in mind is the number of clusters ‘k’. We should make sure that we are choosing the optimum number of clusters for the given data set. But, here arises a question, how to choose the optimum value of k ?? We use the elbow method which is generally used in analyzing the optimum value of k. The Elbow method is based on the principle that “Sum of squares of distances of every data point from its corresponding cluster centroid should be as minimum as possible”. STEPS OF CHOOSING BEST K VALUE 1. Run k-means clustering model on various values of k 2. For each value of K, calculate the Sum of squares of distances of every data point from its corresponding cluster centroid which is called WCSS ( Within-Cluster Sums of Squares) 3. Plot the value of WCSS with respect to various values of K 4. To select the value of k, we choose the value where there is bend (knee) on the plot i.e. WCSS isn’t increasing rapidly. Company Confidential: Data-Core Systems, Inc. | datacoresystems.com
  • 19. elbow method to find k Company Confidential: Data-Core Systems, Inc. | datacoresystems.com
  • 20. from sklearn.metrics import accuracy_score from sklearn.cluster import KMeans # Load the data X = pd.read_csv('data.csv').drop('label', axis=1) y = pd.read_csv('data.csv')['label'] # Create the KMeans model kmeans = KMeans(n_clusters=3) # Fit the model to the data kmeans.fit(X) # Predict the labels for the data y_pred = kmeans.predict(X) # Calculate the accuracy accuracy = accuracy_score(y, y_pred) # Print the accuracy print(accuracy) Find out Accuracy Score in K-Means Clustering Algo Company Confidential: Data-Core Systems, Inc. | datacoresystems.com
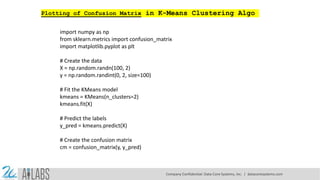
  • 21. import numpy as np from sklearn.metrics import confusion_matrix import matplotlib.pyplot as plt # Create the data X = np.random.randn(100, 2) y = np.random.randint(0, 2, size=100) # Fit the KMeans model kmeans = KMeans(n_clusters=2) kmeans.fit(X) # Predict the labels y_pred = kmeans.predict(X) # Create the confusion matrix cm = confusion_matrix(y, y_pred) Plotting of Confusion Matrix in K-Means Clustering Algo Company Confidential: Data-Core Systems, Inc. | datacoresystems.com
  • 22. # Plot the confusion matrix plt.imshow(cm, interpolation='nearest', cmap=plt.cm.Blues) plt.title('Confusion matrix') plt.colorbar() tick_marks = np.arange(len(kmeans.classes_)) plt.xticks(tick_marks, kmeans.classes_, rotation=45) plt.yticks(tick_marks, kmeans.classes_) fmt = '.2f' thresh = cm.max() / 2. for i, j in itertools.product(range(cm.shape[0]), range(cm.shape[1])): plt.text(j, i, format(cm[i, j], fmt), horizontalalignment="center", color="white" if cm[i, j] > thresh else "black") plt.tight_layout() plt.ylabel('True/Actual label') plt.xlabel('Predicted label') plt.show() Company Confidential: Data-Core Systems, Inc. | datacoresystems.com
  • 23. PROS OF K-MEANS 1. Relatively simple to learn and understand as the algorithm solely depends on the euclidean method of distance calculation. 2. K means works on minimizing Sum of squares of distances, hence it guarantees convergence 3. Computational cost is O(K*n*d), hence K means is fast and efficient CONS OF K-MEANS 1. Difficulty in choosing the optimum number of clusters K 2. K means has a problem when clusters are of different size, densities, and non-globular shapes 3. K means has problems when data contains outliers 4. As the number of dimensions increases, the difficulty in getting the algorithm to converge increases due to the curse of dimensionality 5. If there is overlapping between clusters, k-means doesn’t have an intrinsic measure for uncertainty Company Confidential: Data-Core Systems, Inc. | datacoresystems.com
  • 24. Applications of K- Means Clustering Algorithm The main goals of cluster analysis are: To get a meaningful intuition from the data we are working with. Cluster-then-predict where different models will be built for different subgroups. To fulfill the above-mentioned goals, K-means clustering is performing well enough. It can be used in following applications: Market segmentation Document Clustering Image segmentation Image compression Customer segmentation Analyzing the trend on dynamic data Company Confidential: Data-Core Systems, Inc. | datacoresystems.com
  • 25. Thank You Company Confidential: Data-Core Systems, Inc. | datacoresystems.com