SlideShare a Scribd company logo
Machine Learning with Python
Machine Learning Algorithms - Naïve Bayes
Prof.ShibdasDutta,
Associate Professor,
DCGDATACORESYSTEMSINDIAPVTLTD
Kolkata
Company Confidential: Data-Core Systems, Inc. | datacoresystems.com
Machine Learning Algorithms – Classification Algo- Naïve Bayes
Naïve Bayes - Introduction
Naïve Bayes algorithms is a classification technique based on applying Bayes’ theorem
with a strong assumption that all the predictors are independent to each other.
In simple words, the assumption is that the presence of a feature in a class is
independent to the presence of any other feature in the same class.
For example, a phone may be considered as smart if it is having touch screen, internet
facility, good camera etc.
Though all these features are dependent on each other, they contribute independently
to the probability of that the phone is a smart phone.
In Bayesian classification, the main interest is to find the posterior probabilities i.e. the
probability of a label given some observed features, 𝑃(𝐿 | 𝑓𝑒𝑎𝑡𝑢𝑟𝑒𝑠).
Company Confidential: Data-Core Systems, Inc. | datacoresystems.com
With the help of Bayes theorem, we can express this in quantitative form as follows:
𝑃(𝐿 | 𝑓𝑒𝑎𝑡𝑢𝑟𝑒𝑠) = 𝑃(𝐿)𝑃(𝑓𝑒𝑎𝑡𝑢𝑟𝑒𝑠 | 𝐿) / 𝑃(𝑓𝑒𝑎𝑡𝑢𝑟𝑒𝑠)
Here, 𝑃(𝐿 | 𝑓𝑒𝑎𝑡𝑢𝑟𝑒𝑠) is the posterior probability of class.
𝑃(𝐿) is the prior probability of class.
𝑃(𝑓𝑒𝑎𝑡𝑢𝑟𝑒𝑠 | 𝐿) is the likelihood which is the probability of predictor given class.
𝑃(𝑓𝑒𝑎𝑡𝑢𝑟𝑒𝑠) is the prior probability of predictor.
So let’s get introduced to the Bayes Theorem first.
Bayes Theorem is used to find the probability of an event occurring given the probability of another
event that has already occurred. Here B is the evidence and A is the hypothesis. Here P(A) is known
as prior, P(A/B) is posterior, and P(B/A) is the likelihood.
The name Naive is used because the presence of one independent feature doesn’t affect
(influence or change the value of) other features.
The most important assumption that Naive Bayes makes is that all the features are
independent of each other.
Being less prone to overfitting, Naive Bayes algorithm works on Bayes theorem to predict
unknown data sets.
Company Confidential: Data-Core Systems, Inc. | datacoresystems.com
Building model using Naïve Bayes in Python
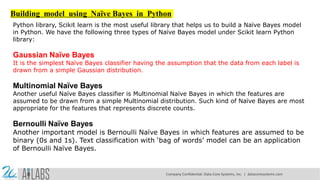
Python library, Scikit learn is the most useful library that helps us to build a Naïve Bayes model
in Python. We have the following three types of Naïve Bayes model under Scikit learn Python
library:
Gaussian Naïve Bayes
It is the simplest Naïve Bayes classifier having the assumption that the data from each label is
drawn from a simple Gaussian distribution.
Multinomial Naïve Bayes
Another useful Naïve Bayes classifier is Multinomial Naïve Bayes in which the features are
assumed to be drawn from a simple Multinomial distribution. Such kind of Naïve Bayes are most
appropriate for the features that represents discrete counts.
Bernoulli Naïve Bayes
Another important model is Bernoulli Naïve Bayes in which features are assumed to be
binary (0s and 1s). Text classification with ‘bag of words’ model can be an application
of Bernoulli Naïve Bayes.
Company Confidential: Data-Core Systems, Inc. | datacoresystems.com
NAIVE BAYES IMPLEMENTATION (EXAMPLE)
Classify whether a given person is a male or a female based on the measured features. The features include height,
weight, and foot size.
Now, defining a dataframe which consists if above provided data.
Company Confidential: Data-Core Systems, Inc. | datacoresystems.com
import pandas as pd
import numpy as np
# Create an empty dataframe
data = pd.DataFrame()
# Create our target variable
data['Gender'] = ['male','male','male','male','female','female','female','female']
# Create our feature variables
data['Height'] = [6,5.92,5.58,5.92,5,5.5,5.42,5.75]
data['Weight'] = [180,190,170,165,100,150,130,150]
data['Foot_Size'] = [12,11,12,10,6,8,7,9]
Creating another data frame containing the feature value of height as 6 feet, weight as 130 lbs and foot size as 8
inches. using Naive Bayes , trying to find whether the gender is male or female.
# Create an empty dataframe
person = pd.DataFrame()
# Create some feature values for this single row
person['Height'] = [6]
person['Weight'] = [130]
person['Foot_Size'] = [8]
Company Confidential: Data-Core Systems, Inc. | datacoresystems.com
Calculating the total number of males and females and their probabilities i.e priors:
# Number of males
n_male = data['Gender'][data['Gender'] == 'male'].count()
# Number of females
n_female = data['Gender'][data['Gender'] == 'female'].count()
# Total rows
total_ppl = data['Gender'].count()
# Number of males divided by the total rows
P_male = n_male/total_ppl
# Number of females divided by the total rows
P_female = n_female/total_ppl
Company Confidential: Data-Core Systems, Inc. | datacoresystems.com
Calculating mean and variance of male and female of the feature height, weight and foot size.
# Group the data by gender and calculate the means of each feature
data_means = data.groupby('Gender').mean()
# Group the data by gender and calculate the variance of each feature
data_variance = data.groupby('Gender').var()
FORMULA
posterior (male) = P(male)*P(height|male)*P(weight|male)*P(foot size|male) / evidence
posterior (female) = P(female)*P(height|female)*P(weight|female)*P(foot size|female) / evidence
Evidence = P(male)*P(height|male)*P(weight|male)*P(foot size|male) + P(female) * P(height|female) *
P(weight|female)*P(foot size|female)
The evidence may be ignored since it is a positive constant. (Normal distributions are always positive.)
Company Confidential: Data-Core Systems, Inc. | datacoresystems.com
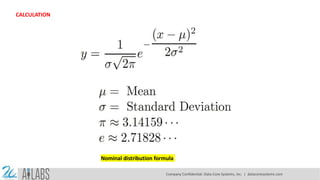
CALCULATION
Nominal distribution formula
Company Confidential: Data-Core Systems, Inc. | datacoresystems.com
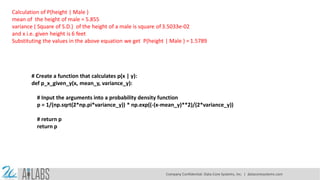
Calculation of P(height | Male )
mean of the height of male = 5.855
variance ( Square of S.D.) of the height of a male is square of 3.5033e-02
and x i.e. given height is 6 feet
Substituting the values in the above equation we get P(height | Male ) = 1.5789
# Create a function that calculates p(x | y):
def p_x_given_y(x, mean_y, variance_y):
# Input the arguments into a probability density function
p = 1/(np.sqrt(2*np.pi*variance_y)) * np.exp((-(x-mean_y)**2)/(2*variance_y))
# return p
return p
Company Confidential: Data-Core Systems, Inc. | datacoresystems.com
Similarly,
P(weight|male) = 5.9881e-06
P(foot size|male) = 1.3112e-3
P(height|female) = 2.2346e-1
P(weight|female) = 1.6789e-2
P(foot size|female) = 2.8669e-1
Posterior (male)*evidence = P(male)*P(height|male)*P(weight|male)*P(foot size|male) = 6.1984e-09
Posterior (female)*evidence = P(female)*P(height|female)*P(weight|female)*P(foot size|female)= 5.3778e-04
CONCLUSION
Since Posterior (female)*evidence > Posterior (male)*evidence, the sample is female.
Company Confidential: Data-Core Systems, Inc. | datacoresystems.com
NAIVE BAYES USING SCIKIT-LEARN
import pandas as pd
import numpy as np
# Create an empty dataframe
data = pd.DataFrame()
# Create our target variable
data['Gender'] = [1,1,1,1,0,0,0,0] #1 is male
# Create our feature variables
data['Height'] = [6,5.92,5.58,5.92,5,5.5,5.42,5.75]
data['Weight'] = [180,190,170,165,100,150,130,150]
data['Foot_Size'] = [12,11,12,10,6,8,7,9]
# View the data
data
Though we have very small dataset, we are dividing the dataset into train and test do that it can be used in other
model prediction. We are importing gnb() from sklearn and we are training the model with out dataset.
Company Confidential: Data-Core Systems, Inc. | datacoresystems.com
X = data.drop(['Gender'],axis=1)
y=data.Gender
# splitting X and y into training and testing sets
from sklearn.model_selection import train_test_split
X_train, X_test, y_train, y_test = train_test_split(X, y, test_size=0.4, random_state=1)
# training the model on training set
from sklearn.naive_bayes import GaussianNB
gnb = GaussianNB()
gnb.fit(X_train, y_train)
# making predictions on the testing set
y_pred = gnb.predict(X_test)
Company Confidential: Data-Core Systems, Inc. | datacoresystems.com
from sklearn.metrics import classification_report, confusion_matrix
print(classification_report(y, gnb.predict(X)))
cm = confusion_matrix(y, gnb.predict(X))
fig, ax = plt.subplots(figsize=(8, 8))
ax.imshow(cm)
ax.grid(False)
ax.xaxis.set(ticks=(0, 1), ticklabels=('Predicted 0s', 'Predicted 1s'))
ax.yaxis.set(ticks=(0, 1), ticklabels=('Actual 0s', 'Actual 1s'))
ax.set_ylim(1.5, -0.5)
for i in range(2):
for j in range(2):
ax.text(j, i, cm[i, j], ha='center', va='center', color='red')
plt.show()
Company Confidential: Data-Core Systems, Inc. | datacoresystems.com
Now, our model is ready. Let’s use this model to predict on new data.
# Create our target variable
data1 = pd.DataFrame()
# Create our feature variables
data1['Height'] = [6]
data1['Weight'] = [130]
data1['Foot_Size'] = [8]
y_pred = gnb.predict(data1)
if y_pred==0:
print ("female")
else:
print ("male")
Output: Female
Company Confidential: Data-Core Systems, Inc. | datacoresystems.com
EXAMPLE 2 HOME TASK - THIS IS ALSO INCLUDE IN PROJECT
AGE INCOME STUDENT CREDIT BUY COMPUTER
Youth High No Fair No
Youth High No Excellent No
Middle Age High No Fair Yes
Senior Medium No Fair Yes
Senior Low Yes Fair Yes
Senior Low Yes Excellent No
Middle Age Low Yes Excellent Yes
Youth Medium No Fair No
Youth Low Yes Fair Yes
Senior Medium Yes Fair Yes
Youth Medium Yes Excellent Yes
Middle Age Medium No Excellent Yes
Middle Age High Yes Fair Yes
Senior Medium No Excellent No
Given a table that contains a dataset about age, income, student, credit-rating, buying a computer, and their respective
features. From the above dataset, we need to find whether a youth student with medium income having a fair credit
rating buys a computer or not. I.e. B = (Youth, Medium, Yes, Fair)
Company Confidential: Data-Core Systems, Inc. | datacoresystems.com
Pros & Cons
Pros
The followings are some pros of using Naïve Bayes classifiers:
Naïve Bayes classification is easy to implement and fast.
It will converge faster than discriminative models like logistic regression.
It requires less training data.
It is highly scalable in nature, or they scale linearly with the number of predictors and data points.
It can make probabilistic predictions and can handle continuous as well as discrete data.
Naïve Bayes classification algorithm can be used for binary as well as multi-class classification problems
both.
Cons
The followings are some cons of using Naïve Bayes classifiers:
One of the most important cons of Naïve Bayes classification is its strong feature independence because in
real life it is almost impossible to have a set of features which are completely independent of each other.
Another issue with Naïve Bayes classification is its ‘zero frequency’ which means that if a categorial variable
has a category but not being observed in training data set, then Naïve Bayes model will assign a zero
probability to it and it will be unable to make a prediction.
Company Confidential: Data-Core Systems, Inc. | datacoresystems.com
Applications of Naïve Bayes classification
The following are some common applications of Naïve Bayes classification:
Real-time prediction: Due to its ease of implementation and fast computation, it can be used
to do prediction in real-time.
Multi-class prediction: Naïve Bayes classification algorithm can be used to predict posterior
probability of multiple classes of target variable.
Text classification: Due to the feature of multi-class prediction, Naïve Bayes classification
algorithms are well suited for text classification. That is why it is also used to solve problems like
spam-filtering and sentiment analysis.
Recommendation system: Along with the algorithms like collaborative filtering, Naïve
Bayes makes a Recommendation system which can be used to filter unseen information
and to predict weather a user would like the given resource or not.
Company Confidential: Data-Core Systems, Inc. | datacoresystems.com
Thank You
Company Confidential: Data-Core Systems, Inc. | datacoresystems.com
Ad

Recommended

Machine Learning with Python-Data Visualization.pdf
SHIBDASDUTTA
 
Machine Learning with Python- Machine Learning Algorithms.pdf
KalighatOkira
 
Machine Learning with Python- Machine Learning Algorithms- Random Forest.pdf
KalighatOkira
 
PYTHON-Chapter 4-Plotting and Data Science PyLab - MAULIK BORSANIYA
Maulik Borsaniya
 
Jupyter Notebooks for machine learning on Kubernetes & OpenShift | DevNation ...
Red Hat Developers
 
python-pandas-For-Data-Analysis-Manipulate.pptx
PLOKESH8
 
Comparing EDA with classical and Bayesian analysis.pptx
PremaGanesh1
 
Gradient boosting for regression problems with example basics of regression...
prateek kumar
 
IRJET- Unabridged Review of Supervised Machine Learning Regression and Classi...
IRJET Journal
 
Naive.pdf
Naive.pdf
MahimMajee
 
Statistics in Data Science with Python
Mahe Karim
 
ML-Ops how to bring your data science to production
Herman Wu
 
Machine Learning for Modern Developers
cacois
 
Data Manipulation with Numpy and Pandas in PythonStarting with N
OllieShoresna
 
Lecture 3 intro2data
Johnson Ubah
 
Introduction to Machine Learning with SciKit-Learn
Benjamin Bengfort
 
ML .pptx
ML .pptx
ssuser8324dd
 
LSTM Framework For Univariate Time series
bilyamine1
 
app4.pptx
app4.pptx
sg4795
 
Basics of R
Basics of R
Sachita Yadav
 
Data Science and Machine Learning Using Python and Scikit-learn
Asim Jalis
 
Data Observability Best Pracices
Andy Petrella
 
Dimension reduction techniques[Feature Selection]
AAKANKSHA JAIN
 
Introduction to ML_Data Preprocessing.pptx
mousmiin
 
Machine Learning with Python- Machine Learning Algorithms- Decision Tree.pdf
KalighatOkira
 
Viktor Tsykunov: Azure Machine Learning Service
Lviv Startup Club
 
The ABC of Implementing Supervised Machine Learning with Python.pptx
Ruby Shrestha
 
20MEMECH Part 3- Classification.pdf
MariaKhan905189
 
Modern multi-proposer consensus implementations
François Garillot
 
Tally.ERP 9 at a Glance.book - Tally Solutions .pdf
Shabista Imam
 

More Related Content

Similar to Machine Learning with Python- Machine Learning Algorithms- Naïve Bayes.pdf (20)

IRJET- Unabridged Review of Supervised Machine Learning Regression and Classi...
IRJET Journal
 
Naive.pdf
Naive.pdf
MahimMajee
 
Statistics in Data Science with Python
Mahe Karim
 
ML-Ops how to bring your data science to production
Herman Wu
 
Machine Learning for Modern Developers
cacois
 
Data Manipulation with Numpy and Pandas in PythonStarting with N
OllieShoresna
 
Lecture 3 intro2data
Johnson Ubah
 
Introduction to Machine Learning with SciKit-Learn
Benjamin Bengfort
 
ML .pptx
ML .pptx
ssuser8324dd
 
LSTM Framework For Univariate Time series
bilyamine1
 
app4.pptx
app4.pptx
sg4795
 
Basics of R
Basics of R
Sachita Yadav
 
Data Science and Machine Learning Using Python and Scikit-learn
Asim Jalis
 
Data Observability Best Pracices
Andy Petrella
 
Dimension reduction techniques[Feature Selection]
AAKANKSHA JAIN
 
Introduction to ML_Data Preprocessing.pptx
mousmiin
 
Machine Learning with Python- Machine Learning Algorithms- Decision Tree.pdf
KalighatOkira
 
Viktor Tsykunov: Azure Machine Learning Service
Lviv Startup Club
 
The ABC of Implementing Supervised Machine Learning with Python.pptx
Ruby Shrestha
 
20MEMECH Part 3- Classification.pdf
MariaKhan905189
 
IRJET- Unabridged Review of Supervised Machine Learning Regression and Classi...
IRJET Journal
 
Statistics in Data Science with Python
Mahe Karim
 
ML-Ops how to bring your data science to production
Herman Wu
 
Machine Learning for Modern Developers
cacois
 
Data Manipulation with Numpy and Pandas in PythonStarting with N
OllieShoresna
 
Lecture 3 intro2data
Johnson Ubah
 
Introduction to Machine Learning with SciKit-Learn
Benjamin Bengfort
 
LSTM Framework For Univariate Time series
bilyamine1
 
app4.pptx
app4.pptx
sg4795
 
Data Science and Machine Learning Using Python and Scikit-learn
Asim Jalis
 
Data Observability Best Pracices
Andy Petrella
 
Dimension reduction techniques[Feature Selection]
AAKANKSHA JAIN
 
Introduction to ML_Data Preprocessing.pptx
mousmiin
 
Machine Learning with Python- Machine Learning Algorithms- Decision Tree.pdf
KalighatOkira
 
Viktor Tsykunov: Azure Machine Learning Service
Lviv Startup Club
 
The ABC of Implementing Supervised Machine Learning with Python.pptx
Ruby Shrestha
 
20MEMECH Part 3- Classification.pdf
MariaKhan905189
 

Recently uploaded (20)

Modern multi-proposer consensus implementations
François Garillot
 
Tally.ERP 9 at a Glance.book - Tally Solutions .pdf
Shabista Imam
 
Validating a Citizen Observatories enabling Platform by completing a Citizen ...
Diego López-de-Ipiña González-de-Artaza
 
May 2025: Top 10 Read Articles in Data Mining & Knowledge Management Process
IJDKP
 
International Journal of Advanced Information Technology (IJAIT)
ijait
 
輪読会資料_Miipher and Miipher2 .
NABLAS株式会社
 
Rapid Prototyping for XR: Lecture 4 - High Level Prototyping.
Mark Billinghurst
 
Deep Learning for Image Processing on 16 June 2025 MITS.pptx
resming1
 
retina_biometrics ruet rajshahi bangdesh.pptx
MdRakibulIslam697135
 
Structured Programming with C++ :: Kjell Backman
Shabista Imam
 
تقرير عن التحليل الديناميكي لتدفق الهواء حول جناح.pdf
محمد قصص فتوتة
 
دراسة حاله لقرية تقع في جنوب غرب السودان
محمد قصص فتوتة
 
Rapid Prototyping for XR: Lecture 5 - Cross Platform Development
Mark Billinghurst
 
Proposal for folders structure division in projects.pdf
Mohamed Ahmed
 
Introduction to Python Programming Language
merlinjohnsy
 
Generative AI & Scientific Research : Catalyst for Innovation, Ethics & Impact
AlqualsaDIResearchGr
 
Abraham Silberschatz-Operating System Concepts (9th,2012.12).pdf
Shabista Imam
 
Call For Papers - 17th International Conference on Wireless & Mobile Networks...
hosseinihamid192023
 
Data Structures Module 3 Binary Trees Binary Search Trees Tree Traversals AVL...
resming1
 
CST413 KTU S7 CSE Machine Learning Clustering K Means Hierarchical Agglomerat...
resming1
 
Ad

Machine Learning with Python- Machine Learning Algorithms- Naïve Bayes.pdf

  • 1. Machine Learning with Python Machine Learning Algorithms - Naïve Bayes Prof.ShibdasDutta, Associate Professor, DCGDATACORESYSTEMSINDIAPVTLTD Kolkata Company Confidential: Data-Core Systems, Inc. | datacoresystems.com
  • 2. Machine Learning Algorithms – Classification Algo- Naïve Bayes Naïve Bayes - Introduction Naïve Bayes algorithms is a classification technique based on applying Bayes’ theorem with a strong assumption that all the predictors are independent to each other. In simple words, the assumption is that the presence of a feature in a class is independent to the presence of any other feature in the same class. For example, a phone may be considered as smart if it is having touch screen, internet facility, good camera etc. Though all these features are dependent on each other, they contribute independently to the probability of that the phone is a smart phone. In Bayesian classification, the main interest is to find the posterior probabilities i.e. the probability of a label given some observed features, 𝑃(𝐿 | 𝑓𝑒𝑎𝑡𝑢𝑟𝑒𝑠). Company Confidential: Data-Core Systems, Inc. | datacoresystems.com
  • 3. With the help of Bayes theorem, we can express this in quantitative form as follows: 𝑃(𝐿 | 𝑓𝑒𝑎𝑡𝑢𝑟𝑒𝑠) = 𝑃(𝐿)𝑃(𝑓𝑒𝑎𝑡𝑢𝑟𝑒𝑠 | 𝐿) / 𝑃(𝑓𝑒𝑎𝑡𝑢𝑟𝑒𝑠) Here, 𝑃(𝐿 | 𝑓𝑒𝑎𝑡𝑢𝑟𝑒𝑠) is the posterior probability of class. 𝑃(𝐿) is the prior probability of class. 𝑃(𝑓𝑒𝑎𝑡𝑢𝑟𝑒𝑠 | 𝐿) is the likelihood which is the probability of predictor given class. 𝑃(𝑓𝑒𝑎𝑡𝑢𝑟𝑒𝑠) is the prior probability of predictor. So let’s get introduced to the Bayes Theorem first. Bayes Theorem is used to find the probability of an event occurring given the probability of another event that has already occurred. Here B is the evidence and A is the hypothesis. Here P(A) is known as prior, P(A/B) is posterior, and P(B/A) is the likelihood.
  • 4. The name Naive is used because the presence of one independent feature doesn’t affect (influence or change the value of) other features. The most important assumption that Naive Bayes makes is that all the features are independent of each other. Being less prone to overfitting, Naive Bayes algorithm works on Bayes theorem to predict unknown data sets. Company Confidential: Data-Core Systems, Inc. | datacoresystems.com
  • 5. Building model using Naïve Bayes in Python Python library, Scikit learn is the most useful library that helps us to build a Naïve Bayes model in Python. We have the following three types of Naïve Bayes model under Scikit learn Python library: Gaussian Naïve Bayes It is the simplest Naïve Bayes classifier having the assumption that the data from each label is drawn from a simple Gaussian distribution. Multinomial Naïve Bayes Another useful Naïve Bayes classifier is Multinomial Naïve Bayes in which the features are assumed to be drawn from a simple Multinomial distribution. Such kind of Naïve Bayes are most appropriate for the features that represents discrete counts. Bernoulli Naïve Bayes Another important model is Bernoulli Naïve Bayes in which features are assumed to be binary (0s and 1s). Text classification with ‘bag of words’ model can be an application of Bernoulli Naïve Bayes. Company Confidential: Data-Core Systems, Inc. | datacoresystems.com
  • 6. NAIVE BAYES IMPLEMENTATION (EXAMPLE) Classify whether a given person is a male or a female based on the measured features. The features include height, weight, and foot size. Now, defining a dataframe which consists if above provided data. Company Confidential: Data-Core Systems, Inc. | datacoresystems.com
  • 7. import pandas as pd import numpy as np # Create an empty dataframe data = pd.DataFrame() # Create our target variable data['Gender'] = ['male','male','male','male','female','female','female','female'] # Create our feature variables data['Height'] = [6,5.92,5.58,5.92,5,5.5,5.42,5.75] data['Weight'] = [180,190,170,165,100,150,130,150] data['Foot_Size'] = [12,11,12,10,6,8,7,9] Creating another data frame containing the feature value of height as 6 feet, weight as 130 lbs and foot size as 8 inches. using Naive Bayes , trying to find whether the gender is male or female. # Create an empty dataframe person = pd.DataFrame() # Create some feature values for this single row person['Height'] = [6] person['Weight'] = [130] person['Foot_Size'] = [8] Company Confidential: Data-Core Systems, Inc. | datacoresystems.com
  • 8. Calculating the total number of males and females and their probabilities i.e priors: # Number of males n_male = data['Gender'][data['Gender'] == 'male'].count() # Number of females n_female = data['Gender'][data['Gender'] == 'female'].count() # Total rows total_ppl = data['Gender'].count() # Number of males divided by the total rows P_male = n_male/total_ppl # Number of females divided by the total rows P_female = n_female/total_ppl Company Confidential: Data-Core Systems, Inc. | datacoresystems.com
  • 9. Calculating mean and variance of male and female of the feature height, weight and foot size. # Group the data by gender and calculate the means of each feature data_means = data.groupby('Gender').mean() # Group the data by gender and calculate the variance of each feature data_variance = data.groupby('Gender').var() FORMULA posterior (male) = P(male)*P(height|male)*P(weight|male)*P(foot size|male) / evidence posterior (female) = P(female)*P(height|female)*P(weight|female)*P(foot size|female) / evidence Evidence = P(male)*P(height|male)*P(weight|male)*P(foot size|male) + P(female) * P(height|female) * P(weight|female)*P(foot size|female) The evidence may be ignored since it is a positive constant. (Normal distributions are always positive.) Company Confidential: Data-Core Systems, Inc. | datacoresystems.com
  • 10. CALCULATION Nominal distribution formula Company Confidential: Data-Core Systems, Inc. | datacoresystems.com
  • 11. Calculation of P(height | Male ) mean of the height of male = 5.855 variance ( Square of S.D.) of the height of a male is square of 3.5033e-02 and x i.e. given height is 6 feet Substituting the values in the above equation we get P(height | Male ) = 1.5789 # Create a function that calculates p(x | y): def p_x_given_y(x, mean_y, variance_y): # Input the arguments into a probability density function p = 1/(np.sqrt(2*np.pi*variance_y)) * np.exp((-(x-mean_y)**2)/(2*variance_y)) # return p return p Company Confidential: Data-Core Systems, Inc. | datacoresystems.com
  • 12. Similarly, P(weight|male) = 5.9881e-06 P(foot size|male) = 1.3112e-3 P(height|female) = 2.2346e-1 P(weight|female) = 1.6789e-2 P(foot size|female) = 2.8669e-1 Posterior (male)*evidence = P(male)*P(height|male)*P(weight|male)*P(foot size|male) = 6.1984e-09 Posterior (female)*evidence = P(female)*P(height|female)*P(weight|female)*P(foot size|female)= 5.3778e-04 CONCLUSION Since Posterior (female)*evidence > Posterior (male)*evidence, the sample is female. Company Confidential: Data-Core Systems, Inc. | datacoresystems.com
  • 13. NAIVE BAYES USING SCIKIT-LEARN import pandas as pd import numpy as np # Create an empty dataframe data = pd.DataFrame() # Create our target variable data['Gender'] = [1,1,1,1,0,0,0,0] #1 is male # Create our feature variables data['Height'] = [6,5.92,5.58,5.92,5,5.5,5.42,5.75] data['Weight'] = [180,190,170,165,100,150,130,150] data['Foot_Size'] = [12,11,12,10,6,8,7,9] # View the data data Though we have very small dataset, we are dividing the dataset into train and test do that it can be used in other model prediction. We are importing gnb() from sklearn and we are training the model with out dataset. Company Confidential: Data-Core Systems, Inc. | datacoresystems.com
  • 14. X = data.drop(['Gender'],axis=1) y=data.Gender # splitting X and y into training and testing sets from sklearn.model_selection import train_test_split X_train, X_test, y_train, y_test = train_test_split(X, y, test_size=0.4, random_state=1) # training the model on training set from sklearn.naive_bayes import GaussianNB gnb = GaussianNB() gnb.fit(X_train, y_train) # making predictions on the testing set y_pred = gnb.predict(X_test) Company Confidential: Data-Core Systems, Inc. | datacoresystems.com
  • 15. from sklearn.metrics import classification_report, confusion_matrix print(classification_report(y, gnb.predict(X))) cm = confusion_matrix(y, gnb.predict(X)) fig, ax = plt.subplots(figsize=(8, 8)) ax.imshow(cm) ax.grid(False) ax.xaxis.set(ticks=(0, 1), ticklabels=('Predicted 0s', 'Predicted 1s')) ax.yaxis.set(ticks=(0, 1), ticklabels=('Actual 0s', 'Actual 1s')) ax.set_ylim(1.5, -0.5) for i in range(2): for j in range(2): ax.text(j, i, cm[i, j], ha='center', va='center', color='red') plt.show() Company Confidential: Data-Core Systems, Inc. | datacoresystems.com
  • 16. Now, our model is ready. Let’s use this model to predict on new data. # Create our target variable data1 = pd.DataFrame() # Create our feature variables data1['Height'] = [6] data1['Weight'] = [130] data1['Foot_Size'] = [8] y_pred = gnb.predict(data1) if y_pred==0: print ("female") else: print ("male") Output: Female Company Confidential: Data-Core Systems, Inc. | datacoresystems.com
  • 17. EXAMPLE 2 HOME TASK - THIS IS ALSO INCLUDE IN PROJECT AGE INCOME STUDENT CREDIT BUY COMPUTER Youth High No Fair No Youth High No Excellent No Middle Age High No Fair Yes Senior Medium No Fair Yes Senior Low Yes Fair Yes Senior Low Yes Excellent No Middle Age Low Yes Excellent Yes Youth Medium No Fair No Youth Low Yes Fair Yes Senior Medium Yes Fair Yes Youth Medium Yes Excellent Yes Middle Age Medium No Excellent Yes Middle Age High Yes Fair Yes Senior Medium No Excellent No Given a table that contains a dataset about age, income, student, credit-rating, buying a computer, and their respective features. From the above dataset, we need to find whether a youth student with medium income having a fair credit rating buys a computer or not. I.e. B = (Youth, Medium, Yes, Fair) Company Confidential: Data-Core Systems, Inc. | datacoresystems.com
  • 18. Pros & Cons Pros The followings are some pros of using Naïve Bayes classifiers: Naïve Bayes classification is easy to implement and fast. It will converge faster than discriminative models like logistic regression. It requires less training data. It is highly scalable in nature, or they scale linearly with the number of predictors and data points. It can make probabilistic predictions and can handle continuous as well as discrete data. Naïve Bayes classification algorithm can be used for binary as well as multi-class classification problems both. Cons The followings are some cons of using Naïve Bayes classifiers: One of the most important cons of Naïve Bayes classification is its strong feature independence because in real life it is almost impossible to have a set of features which are completely independent of each other. Another issue with Naïve Bayes classification is its ‘zero frequency’ which means that if a categorial variable has a category but not being observed in training data set, then Naïve Bayes model will assign a zero probability to it and it will be unable to make a prediction. Company Confidential: Data-Core Systems, Inc. | datacoresystems.com
  • 19. Applications of Naïve Bayes classification The following are some common applications of Naïve Bayes classification: Real-time prediction: Due to its ease of implementation and fast computation, it can be used to do prediction in real-time. Multi-class prediction: Naïve Bayes classification algorithm can be used to predict posterior probability of multiple classes of target variable. Text classification: Due to the feature of multi-class prediction, Naïve Bayes classification algorithms are well suited for text classification. That is why it is also used to solve problems like spam-filtering and sentiment analysis. Recommendation system: Along with the algorithms like collaborative filtering, Naïve Bayes makes a Recommendation system which can be used to filter unseen information and to predict weather a user would like the given resource or not. Company Confidential: Data-Core Systems, Inc. | datacoresystems.com
  • 20. Thank You Company Confidential: Data-Core Systems, Inc. | datacoresystems.com