Machine Learning with Python- Machine Learning Algorithms- Random Forest.pdf
0 likes6 views
Random Forest
1 of 10
Download to read offline
![abc=[]
for i in range(len(data)):
abc.append(data['Date'][i].split('-'))
data['Date'][i] = ''.join(abc[i])
Using above dataset, we are now trying to predict the ‘Close’ Value based on all attributes. Let’s split the data into
train and test dataset.
#These are the labels: They describe what the stock price was over a period.
X_1 = data.drop('Close',axis=1)
Y_1 = data['Close']
# Using Skicit-learn to split data into training and testing sets
from sklearn.model_selection import train_test_split
X_train_1, X_test_1, y_train_1, y_test_1 = train_test_split(X_1, Y_1, test_size=0.33, random_state=42)
Company Confidential: Data-Core Systems, Inc. | datacoresystems.com](https://image.slidesharecdn.com/machinelearningwithpython-machinelearningalgorithms-randomforest-250217162709-c1044ec3/85/Machine-Learning-with-Python-Machine-Learning-Algorithms-Random-Forest-pdf-6-320.jpg)
![Now, let’s instantiate the model and train the model on training dataset:
rfg = RandomForestRegressor(n_estimators= 10, random_state=42)
rfg.fit(X_train_1,y_train_1)
pd.concat([pd.Series(rfg.predict(X_test_1)), y_test_1.reset_index(
drop=True)], axis=1)
Let’s find out the features on the basis of their importance by calculating numerical feature importances
# Saving feature names for later use
feature_list = list(X_1.columns)
print(feature_list)
# Get numerical feature importances
importances = list(rfg.feature_importances_)
# List of tuples with variable and importance
feature_importances = [(feature, round(importance, 2)) for feature, importance in zip(feature_list, importances)]
# Sort the feature importances by most important first
feature_importances = sorted(feature_importances, key = lambda x: x[1], reverse = True)
# Print out the feature and importances
[print('Variable: {:20} Importance: {}'.format(*pair)) for pair in feature_importances];
Company Confidential: Data-Core Systems, Inc. | datacoresystems.com](https://image.slidesharecdn.com/machinelearningwithpython-machinelearningalgorithms-randomforest-250217162709-c1044ec3/85/Machine-Learning-with-Python-Machine-Learning-Algorithms-Random-Forest-pdf-7-320.jpg)
![rfg.score(X_test_1, y_test_1)
We are getting an accuracy of ~99% while predicting. We then display the original value and the predicted Values.
pd.concat([pd.Series(rfg.predict(X_test_1)), y_test_1.reset_index(drop=True)], axis=1)
Prediction
Company Confidential: Data-Core Systems, Inc. | datacoresystems.com](https://image.slidesharecdn.com/machinelearningwithpython-machinelearningalgorithms-randomforest-250217162709-c1044ec3/85/Machine-Learning-with-Python-Machine-Learning-Algorithms-Random-Forest-pdf-8-320.jpg)


Ad
Recommended
Basics of R
Basics of RSachita Yadav R is a powerful but complex statistical programming language. It allows users great flexibility as "wizards" to customize their environment and create their own functions ("spells") without paying for licenses. Learning R involves overcoming an initial steep learning curve. There are over 2000 add-on packages available that provide many statistical techniques without delays, but the large number of packages can make choosing the best one difficult. The document provides tips for getting started with R, including installing RStudio, loading packages, and basic syntax like creating vectors and data frames. It also gives an example of analyzing rainfall data from India with R functions like aggregate, plot, and linear regression.
Decision Tree.pptx
Decision Tree.pptxRamakrishna Reddy Bijjam The document discusses decision trees and their use in R. It contains 3 key points:
1. Decision trees can be used to predict outcomes like spam detection based on input variables. The nodes represent choices and edges represent decision rules.
2. An example creates a decision tree using the 'party' package in R to predict reading skills based on variables like age, shoe size, and native language.
3. The 'rpart' package can also be used to create and visualize decision trees, as shown through an example predicting insurance fraud based on rear-end collisions.
Lesson 2 data preprocessing
Lesson 2 data preprocessingAbdurRazzaqe1 The document discusses data wrangling and manipulation techniques in machine learning. It covers topics like data exploration, data wrangling, data acquisition, and data manipulation in Python. It demonstrates techniques like loading CSV and Excel files, exploring data through dimensionality checks, slicing, and correlation analysis. The objectives are to perform data wrangling and understand its significance, manipulate data in Python using coercion and merging, and explore data using Python.
Get started with R lang
Get started with R langsenthil0809 R is an open source programming language used for data analysis and visualization. It allows users to process raw data into meaningful assets through packages that provide functions for tasks like data cleaning, modeling, and graphic creation. The document provides an introduction to R for beginners, including how to install R, basic commands and their uses, how to work with common data structures in R like vectors, matrices, data frames and lists, how to create user-defined functions, and how to import data into R.
Mca ii dfs u-1 introduction to data structure
Mca ii dfs u-1 introduction to data structureRai University This document provides an introduction to data structures. It defines data structures as a way of organizing and storing data in a computer so that it can be used efficiently. The document discusses different types of data structures including primitive, non-primitive, linear and non-linear structures. It provides examples of various data structures like arrays, linked lists, stacks, queues and trees. It also covers important concepts like time complexity, space complexity and Big O notation for analyzing algorithms. Common operations on data structures like search, insert and delete are also explained.
Lecture 3 intro2data
Lecture 3 intro2dataJohnson Ubah The document discusses essential Python toolboxes for data scientists, emphasizing the importance of selecting the right tools for effective data analysis. It highlights popular libraries such as NumPy, SciPy, Pandas, and Scikit-learn, and describes their functionalities for data manipulation, analysis, and machine learning. Additionally, it covers installation options, integrated development environments like Spyder and Jupyter, and various data handling techniques using Pandas.
Introduction to Data structure and algorithm.pptx
Introduction to Data structure and algorithm.pptxline24arts This document discusses data structures and algorithms. It begins by outlining the key topics that will be covered, including explaining data structures, their operations and classifications, algorithm time complexity, and calculating time complexity. It then defines fundamental concepts like data, entities, records and files. The rest of the document provides examples of different data structures and algorithms, and analyzes their time complexities using Big O notation. It explains concepts like linear, logarithmic and quadratic time complexity through worked examples.
Machine Learning with Python- Machine Learning Algorithms- Decision Tree.pdf
Machine Learning with Python- Machine Learning Algorithms- Decision Tree.pdfKalighatOkira Decision Tree
Bsc cs ii dfs u-1 introduction to data structure
Bsc cs ii dfs u-1 introduction to data structureRai University This document provides an introduction to data structures. It defines data structures as a way of organizing and storing data in a computer so it can be used efficiently. The document discusses different types of data structures including primitive, non-primitive, linear and non-linear structures. It provides examples of common data structures like arrays, linked lists, stacks, queues and trees. It also covers important concepts like time and space complexity analysis and Big O notation for analyzing algorithm efficiency.
Bca ii dfs u-1 introduction to data structure
Bca ii dfs u-1 introduction to data structureRai University This document provides an introduction to data structures. It defines data structures as a way of organizing and storing data in a computer so it can be used efficiently. There are two main types: primitive data structures like integers and characters that are directly operated on by the CPU, and non-primitive structures like arrays and linked lists that are more complex. Key aspects of data structures covered include operations, properties, performance analysis using time and space complexity, and examples of linear structures like arrays and non-linear structures like trees. Common algorithms are analyzed based on their asymptotic worst-case running times.
python-pandas-For-Data-Analysis-Manipulate.pptx
python-pandas-For-Data-Analysis-Manipulate.pptxPLOKESH8 Pandas is a powerful Python library designed for data manipulation and analysis, providing expressive data structures such as Series and DataFrames. It facilitates the processing of data through functionalities like loading, preparing, manipulating, modeling, and analyzing data across various fields. Pandas also offers efficient tools for handling missing data, reshaping datasets, and performing data preprocessing tasks essential for machine learning applications.
Chapter 02-logistic regression
Chapter 02-logistic regressionRaman Kannan The document discusses logistic regression and its application in classification problems, distinguishing between binary and multi-class classifications. It covers the phases of classification (training and testing), algorithm selection criteria, data preprocessing, and model evaluation metrics. The discussion also highlights the use of R for data science, emphasizing the importance of handling categorical variables, managing multicollinearity, and the significance of reproducibility and model generalization.
R-Language-Lab-Manual-lab-1.pdf
R-Language-Lab-Manual-lab-1.pdfDrGSakthiGovindaraju R is a programming language and free software used for statistical analysis and graphics. It allows users to analyze data, build statistical models and visualize results. Key features of R include its extensive library of statistical and graphical methods, machine learning algorithms, and ability to handle large and complex data. R is widely used in academia and industry for data science tasks like data analysis, modeling, and communicating results.
R-Language-Lab-Manual-lab-1.pdf
R-Language-Lab-Manual-lab-1.pdfKabilaArun R is a programming language and free software used for statistical analysis and graphics. It allows users to analyze data, build statistical models and visualize results. Key features of R include its extensive library of statistical and graphical methods, machine learning algorithms, and ability to handle large and complex data. R is widely used in academia and industry for data science tasks like data analysis, modeling, and communicating results.
R-Language-Lab-Manual-lab-1.pdf
R-Language-Lab-Manual-lab-1.pdfattalurilalitha R is a programming language and free software used for statistical analysis and graphics. It allows users to analyze data, create visualizations and build predictive models. Key features of R include its extensive library of statistical and machine learning methods, ability to handle large datasets, and functionality for data wrangling, modeling, visualization and communication of results. The document provides instructions on downloading and installing R and RStudio, loading and installing packages, and introduces basic R programming concepts like vectors, matrices, data frames and factors.
Random Forest / Bootstrap Aggregation
Random Forest / Bootstrap AggregationRupak Roy Random Forest is a powerful machine learning algorithm that utilizes ensemble methods like bagging to improve predictive accuracy by averaging multiple decision trees built from random samples of features. It reduces variance without increasing bias, allows for the use of out-of-bag samples for model validation, and handles missing values and outliers effectively. Compared to boosting and other algorithms, Random Forest is faster in processing large datasets and requires less data pre-processing.
R decision tree
R decision treeLearnbay Datascience The document explains decision trees as a graph representing choices and their results, commonly used in machine learning and data mining with R. It outlines how to create and visualize decision trees using the 'party' package in R, including a practical example with the 'readingskills' dataset. The process includes installing necessary packages, constructing the decision tree with the ctree() function, and plotting the results.
Observations
Observationsbutest 1) Interval classifiers are machine learning algorithms that originated in artificial intelligence research but are now being applied to database mining. They generate decision trees to classify data into intervals based on attribute values.
2) The author implemented the IC interval classifier algorithm and tested it on small datasets, finding higher classification errors than reported in literature due to small training set sizes. Parameter testing showed accuracy improved with larger training sets and more restrictive interval definitions.
3) While efficiency couldn't be fully tested, results suggest interval classifiers may perform well for database applications if further tuned based on dataset characteristics. More research is still needed on algorithm modifications and dynamic training approaches.
ACADILD:: HADOOP LESSON
ACADILD:: HADOOP LESSON Padma shree. T This document discusses using MapReduce to find the top K records in a distributed dataset based on a specific criteria. It begins by explaining MapReduce and its limitations. It then describes finding the top K records on a single machine by sorting the data and selecting the top K. For MapReduce, each mapper finds the top K records within its split and sends to the reducer. The reducer finds the global top K by sorting all records and selecting the top K overall. An example algorithm and sample data are provided to demonstrate how to implement a MapReduce job to solve this problem.
Feature-selection-techniques to be used in machine learning algorithms
Feature-selection-techniques to be used in machine learning algorithmsssuser363702 The document discusses methods for feature selection using the chi-squared test for categorical data and Pearson's correlation coefficient and PCA for numeric data, utilizing the bank marketing UCI dataset. It explains the process of isolating categorical features, selecting the best features, and how to handle both categorical and numeric data in model training. The analysis reveals the most important features impacting the model, ultimately reducing the number of features used.
Machine Learning with Python- Machine Learning Algorithms- Naïve Bayes.pdf
Machine Learning with Python- Machine Learning Algorithms- Naïve Bayes.pdfKalighatOkira Machine Learning Algorithms- Naïve Bayes
Tutorial machine learning with python - a tutorial
Tutorial machine learning with python - a tutorialMarcusBBraga This document provides an introduction and tutorial to machine learning with Python. It begins by explaining the basics of machine learning and how it can be used to make predictions from data. The tutorial then loads and explores a dataset of board games, analyzing variables like average rating. It shows how to visualize the rating distribution and filter out unrated games. The document demonstrates clustering the games using k-means to group similar games and find patterns in the data. The overall summary explores a board game dataset, filters and analyzes it, then clusters the games to discover groups.
Data Structure
Data Structuresheraz1 The document discusses data structures and algorithms. It defines data structures as organized ways of storing data to allow efficient processing. Algorithms manipulate data in data structures to perform operations like searching and sorting. Big-O notation provides an asymptotic analysis of algorithms, estimating how their running time grows with input size. Common time complexities include constant O(1), linear O(n), quadratic O(n^2), and exponential O(2^n).
Lec 1 Ds
Lec 1 DsQundeel The document discusses data structures and algorithms. It defines data structures as organized ways of storing data to allow efficient processing. Algorithms manipulate data in data structures to perform operations like searching and sorting. Big-O notation is introduced to analyze algorithms' time complexity as the problem size increases. Common time complexities like O(1), O(log n), O(n), O(n log n), O(n^2), O(n^3) and O(2^n) are defined. An example algorithm to find the minimum element in an array is analyzed, showing it has O(n) time complexity. Selection sort is analyzed and shown to have O(n^2) time complexity.
Lec 1 Ds
Lec 1 DsQundeel The document discusses data structures and algorithms. It defines data structures as organized ways of storing data to allow efficient processing. Algorithms manipulate data in data structures to perform operations like searching and sorting. Big-O notation provides an asymptotic analysis of algorithms, estimating how their running time grows with input size. Common time complexities include constant O(1), linear O(n), quadratic O(n^2), and exponential O(2^n).
Feature Engineering in NLP.pdf
Feature Engineering in NLP.pdfbilaje4244prolugcom 1. The document discusses feature engineering techniques for natural language processing (NLP) tasks. It describes 15 common features that can be extracted from text data like word counts, punctuation counts, part-of-speech counts.
2. The features are demonstrated on a Twitter dataset to classify tweets as real or fake news. Models trained with the engineered features achieved up to 4% higher accuracy than models without the features.
3. Feature engineering helps machine learning models better understand language contexts and meanings, leading to improved performance on NLP tasks compared to using models alone.
r,rstats,r language,r packages
r,rstats,r language,r packagesAjay Ohri The document discusses creating an optimized algorithm in R. It covers writing functions and algorithms in R, creating R packages, and optimizing code performance using parallel computing and high performance computing. Key steps include reviewing existing algorithms, identifying gaps, testing and iterating a new algorithm, publishing the work, and making the algorithm available to others through an R package.
Complete guidance book of Asp.Net Web API
Complete guidance book of Asp.Net Web APIShabista Imam Unlock the full potential of modern web development with the Complete Guidance Book of ASP.NET Web API—your all-in-one resource for mastering RESTful services using Microsoft’s powerful ASP.NET Core framework. This book takes you on a step-by-step journey from beginner to expert, covering everything from routing and controllers to security, performance optimization, and real-world architecture.
Rapid Prototyping for XR: Lecture 6 - AI for Prototyping and Research Directi...
Rapid Prototyping for XR: Lecture 6 - AI for Prototyping and Research Directi...Mark Billinghurst This is lecture 6 in the course on Rapid Prototyping for XR, taught on June 13th, 2025 by Mark Billinghurst. This lecture was about using AI for Prototyping and Research Directions.
More Related Content
Similar to Machine Learning with Python- Machine Learning Algorithms- Random Forest.pdf (20)
Bsc cs ii dfs u-1 introduction to data structure
Bsc cs ii dfs u-1 introduction to data structureRai University This document provides an introduction to data structures. It defines data structures as a way of organizing and storing data in a computer so it can be used efficiently. The document discusses different types of data structures including primitive, non-primitive, linear and non-linear structures. It provides examples of common data structures like arrays, linked lists, stacks, queues and trees. It also covers important concepts like time and space complexity analysis and Big O notation for analyzing algorithm efficiency.
Bca ii dfs u-1 introduction to data structure
Bca ii dfs u-1 introduction to data structureRai University This document provides an introduction to data structures. It defines data structures as a way of organizing and storing data in a computer so it can be used efficiently. There are two main types: primitive data structures like integers and characters that are directly operated on by the CPU, and non-primitive structures like arrays and linked lists that are more complex. Key aspects of data structures covered include operations, properties, performance analysis using time and space complexity, and examples of linear structures like arrays and non-linear structures like trees. Common algorithms are analyzed based on their asymptotic worst-case running times.
python-pandas-For-Data-Analysis-Manipulate.pptx
python-pandas-For-Data-Analysis-Manipulate.pptxPLOKESH8 Pandas is a powerful Python library designed for data manipulation and analysis, providing expressive data structures such as Series and DataFrames. It facilitates the processing of data through functionalities like loading, preparing, manipulating, modeling, and analyzing data across various fields. Pandas also offers efficient tools for handling missing data, reshaping datasets, and performing data preprocessing tasks essential for machine learning applications.
Chapter 02-logistic regression
Chapter 02-logistic regressionRaman Kannan The document discusses logistic regression and its application in classification problems, distinguishing between binary and multi-class classifications. It covers the phases of classification (training and testing), algorithm selection criteria, data preprocessing, and model evaluation metrics. The discussion also highlights the use of R for data science, emphasizing the importance of handling categorical variables, managing multicollinearity, and the significance of reproducibility and model generalization.
R-Language-Lab-Manual-lab-1.pdf
R-Language-Lab-Manual-lab-1.pdfDrGSakthiGovindaraju R is a programming language and free software used for statistical analysis and graphics. It allows users to analyze data, build statistical models and visualize results. Key features of R include its extensive library of statistical and graphical methods, machine learning algorithms, and ability to handle large and complex data. R is widely used in academia and industry for data science tasks like data analysis, modeling, and communicating results.
R-Language-Lab-Manual-lab-1.pdf
R-Language-Lab-Manual-lab-1.pdfKabilaArun R is a programming language and free software used for statistical analysis and graphics. It allows users to analyze data, build statistical models and visualize results. Key features of R include its extensive library of statistical and graphical methods, machine learning algorithms, and ability to handle large and complex data. R is widely used in academia and industry for data science tasks like data analysis, modeling, and communicating results.
R-Language-Lab-Manual-lab-1.pdf
R-Language-Lab-Manual-lab-1.pdfattalurilalitha R is a programming language and free software used for statistical analysis and graphics. It allows users to analyze data, create visualizations and build predictive models. Key features of R include its extensive library of statistical and machine learning methods, ability to handle large datasets, and functionality for data wrangling, modeling, visualization and communication of results. The document provides instructions on downloading and installing R and RStudio, loading and installing packages, and introduces basic R programming concepts like vectors, matrices, data frames and factors.
Random Forest / Bootstrap Aggregation
Random Forest / Bootstrap AggregationRupak Roy Random Forest is a powerful machine learning algorithm that utilizes ensemble methods like bagging to improve predictive accuracy by averaging multiple decision trees built from random samples of features. It reduces variance without increasing bias, allows for the use of out-of-bag samples for model validation, and handles missing values and outliers effectively. Compared to boosting and other algorithms, Random Forest is faster in processing large datasets and requires less data pre-processing.
R decision tree
R decision treeLearnbay Datascience The document explains decision trees as a graph representing choices and their results, commonly used in machine learning and data mining with R. It outlines how to create and visualize decision trees using the 'party' package in R, including a practical example with the 'readingskills' dataset. The process includes installing necessary packages, constructing the decision tree with the ctree() function, and plotting the results.
Observations
Observationsbutest 1) Interval classifiers are machine learning algorithms that originated in artificial intelligence research but are now being applied to database mining. They generate decision trees to classify data into intervals based on attribute values.
2) The author implemented the IC interval classifier algorithm and tested it on small datasets, finding higher classification errors than reported in literature due to small training set sizes. Parameter testing showed accuracy improved with larger training sets and more restrictive interval definitions.
3) While efficiency couldn't be fully tested, results suggest interval classifiers may perform well for database applications if further tuned based on dataset characteristics. More research is still needed on algorithm modifications and dynamic training approaches.
ACADILD:: HADOOP LESSON
ACADILD:: HADOOP LESSON Padma shree. T This document discusses using MapReduce to find the top K records in a distributed dataset based on a specific criteria. It begins by explaining MapReduce and its limitations. It then describes finding the top K records on a single machine by sorting the data and selecting the top K. For MapReduce, each mapper finds the top K records within its split and sends to the reducer. The reducer finds the global top K by sorting all records and selecting the top K overall. An example algorithm and sample data are provided to demonstrate how to implement a MapReduce job to solve this problem.
Feature-selection-techniques to be used in machine learning algorithms
Feature-selection-techniques to be used in machine learning algorithmsssuser363702 The document discusses methods for feature selection using the chi-squared test for categorical data and Pearson's correlation coefficient and PCA for numeric data, utilizing the bank marketing UCI dataset. It explains the process of isolating categorical features, selecting the best features, and how to handle both categorical and numeric data in model training. The analysis reveals the most important features impacting the model, ultimately reducing the number of features used.
Machine Learning with Python- Machine Learning Algorithms- Naïve Bayes.pdf
Machine Learning with Python- Machine Learning Algorithms- Naïve Bayes.pdfKalighatOkira Machine Learning Algorithms- Naïve Bayes
Tutorial machine learning with python - a tutorial
Tutorial machine learning with python - a tutorialMarcusBBraga This document provides an introduction and tutorial to machine learning with Python. It begins by explaining the basics of machine learning and how it can be used to make predictions from data. The tutorial then loads and explores a dataset of board games, analyzing variables like average rating. It shows how to visualize the rating distribution and filter out unrated games. The document demonstrates clustering the games using k-means to group similar games and find patterns in the data. The overall summary explores a board game dataset, filters and analyzes it, then clusters the games to discover groups.
Data Structure
Data Structuresheraz1 The document discusses data structures and algorithms. It defines data structures as organized ways of storing data to allow efficient processing. Algorithms manipulate data in data structures to perform operations like searching and sorting. Big-O notation provides an asymptotic analysis of algorithms, estimating how their running time grows with input size. Common time complexities include constant O(1), linear O(n), quadratic O(n^2), and exponential O(2^n).
Lec 1 Ds
Lec 1 DsQundeel The document discusses data structures and algorithms. It defines data structures as organized ways of storing data to allow efficient processing. Algorithms manipulate data in data structures to perform operations like searching and sorting. Big-O notation is introduced to analyze algorithms' time complexity as the problem size increases. Common time complexities like O(1), O(log n), O(n), O(n log n), O(n^2), O(n^3) and O(2^n) are defined. An example algorithm to find the minimum element in an array is analyzed, showing it has O(n) time complexity. Selection sort is analyzed and shown to have O(n^2) time complexity.
Lec 1 Ds
Lec 1 DsQundeel The document discusses data structures and algorithms. It defines data structures as organized ways of storing data to allow efficient processing. Algorithms manipulate data in data structures to perform operations like searching and sorting. Big-O notation provides an asymptotic analysis of algorithms, estimating how their running time grows with input size. Common time complexities include constant O(1), linear O(n), quadratic O(n^2), and exponential O(2^n).
Feature Engineering in NLP.pdf
Feature Engineering in NLP.pdfbilaje4244prolugcom 1. The document discusses feature engineering techniques for natural language processing (NLP) tasks. It describes 15 common features that can be extracted from text data like word counts, punctuation counts, part-of-speech counts.
2. The features are demonstrated on a Twitter dataset to classify tweets as real or fake news. Models trained with the engineered features achieved up to 4% higher accuracy than models without the features.
3. Feature engineering helps machine learning models better understand language contexts and meanings, leading to improved performance on NLP tasks compared to using models alone.
r,rstats,r language,r packages
r,rstats,r language,r packagesAjay Ohri The document discusses creating an optimized algorithm in R. It covers writing functions and algorithms in R, creating R packages, and optimizing code performance using parallel computing and high performance computing. Key steps include reviewing existing algorithms, identifying gaps, testing and iterating a new algorithm, publishing the work, and making the algorithm available to others through an R package.
Recently uploaded (20)
Complete guidance book of Asp.Net Web API
Complete guidance book of Asp.Net Web APIShabista Imam Unlock the full potential of modern web development with the Complete Guidance Book of ASP.NET Web API—your all-in-one resource for mastering RESTful services using Microsoft’s powerful ASP.NET Core framework. This book takes you on a step-by-step journey from beginner to expert, covering everything from routing and controllers to security, performance optimization, and real-world architecture.
Rapid Prototyping for XR: Lecture 6 - AI for Prototyping and Research Directi...
Rapid Prototyping for XR: Lecture 6 - AI for Prototyping and Research Directi...Mark Billinghurst This is lecture 6 in the course on Rapid Prototyping for XR, taught on June 13th, 2025 by Mark Billinghurst. This lecture was about using AI for Prototyping and Research Directions.
Stability of IBR Dominated Grids - IEEE PEDG 2025 - short.pptx
Stability of IBR Dominated Grids - IEEE PEDG 2025 - short.pptxssuser307730 Slides from IEEE PEDG 2025 Conference in Nanajing. Addresses need for re-examining grid stability when using large numbers of inverter-based resources.
May 2025: Top 10 Read Articles in Data Mining & Knowledge Management Process
May 2025: Top 10 Read Articles in Data Mining & Knowledge Management ProcessIJDKP Data mining and knowledge discovery in databases have been attracting a significant amount of research, industry, and media attention of late. There is an urgent need for a new generation of computational theories and tools to assist researchers in extracting useful information from the rapidly growing volumes of digital data.
This Journal provides a forum for researchers who address this issue and to present their work in a peer-reviewed open access forum. Authors are solicited to contribute to the Journal by submitting articles that illustrate research results, projects, surveying works and industrial experiences that describe significant advances in the following areas, but are not limited to these topics only.
International Journal of Advanced Information Technology (IJAIT)
International Journal of Advanced Information Technology (IJAIT)ijait International journal of advanced Information technology (IJAIT) is a bi monthly open access peer-
reviewed journal, will act as a major forum for the presentation of innovative ideas, approaches,
developments, and research projects in the area advanced information technology applications and
services. It will also serve to facilitate the exchange of information between researchers and industry
professionals to discuss the latest issues and advancement in the area of advanced IT. Core areas of
advanced IT and multi-disciplinary and its applications will be covered during the conferences.
Structured Programming with C++ :: Kjell Backman
Structured Programming with C++ :: Kjell BackmanShabista Imam Step into the world of high-performance programming with the Complete Guidance Book of C++ Programming—a definitive resource for mastering one of the most powerful and versatile languages in computer science.
Whether you're a beginner looking to learn the fundamentals or an intermediate developer aiming to sharpen your skills, this book walks you through C++ from the ground up. You'll start with basics like variables, control structures, and functions, then progress to object-oriented programming (OOP), memory management, file handling, templates, and the Standard Template Library (STL).
Generative AI & Scientific Research : Catalyst for Innovation, Ethics & Impact
Generative AI & Scientific Research : Catalyst for Innovation, Ethics & ImpactAlqualsaDIResearchGr Invited keynote at the Artificial Intelligence Symposium on AI-powered Research Innovation, taking place at ENSEM (L'École Nationale Supérieure d'Électricité et de Mécanique), Casablanca on June 21, 2025. I’ll be giving a keynote titled: "Generative AI & Scientific Research: Catalyst for Innovation, Ethics & Impact". Looking forward to engaging with researchers and doctoral students on how Generative AI is reshaping the future of science, from discovery to governance — with both opportunities and responsibilities in focus.
#AI hashtag#GenerativeAI #ScientificResearch #Innovation #Ethics #Keynote #AIinScience #GAI #ResearchInnovation #Casablanca
1. Thinking, Creative Thinking, Innovation
2. Societies Evolution from 1.0 to 5.0
3. AI - 3P Approach, Use Cases & Innovation
4. GAI & Creativity
5. TrustWorthy AI
6. Guidelines on The Responsible use of GAI In Research
Abraham Silberschatz-Operating System Concepts (9th,2012.12).pdf
Abraham Silberschatz-Operating System Concepts (9th,2012.12).pdfShabista Imam Complete book of operating system edition 9
Rapid Prototyping for XR: Lecture 2 - Low Fidelity Prototyping.
Rapid Prototyping for XR: Lecture 2 - Low Fidelity Prototyping.Mark Billinghurst This is lecture 2 on the Rapid Prototyping for XR course taught by Mark Billingurst on June 10th 2025. This lecture is about Low Fidelity Prototyping.
Rapid Prototyping for XR: Lecture 4 - High Level Prototyping.
Rapid Prototyping for XR: Lecture 4 - High Level Prototyping.Mark Billinghurst This is lecture 4 in the course on Rapid Prototyping for XR, taught by Mark Billinghurst on June 11th, 2025. This lecture is about High Level Prototyping.
Validating a Citizen Observatories enabling Platform by completing a Citizen ...
Validating a Citizen Observatories enabling Platform by completing a Citizen ...Diego López-de-Ipiña González-de-Artaza Citizen Observatories (COs) are initiatives that empower citizens to engage in data collection, analysis and interpretation in order to address various issues affecting their communities and contribute to policy-making and community development.
Thematic co-exploration is a co-production process where citizens actively participate alongside scientists and other actors in the exploration of specific themes.
Making them a reality involves addressing the following challenges:
Data quality and reliability
Engagement and retention of participants
Integration with policy and decision-making
Deep Learning for Natural Language Processing_FDP on 16 June 2025 MITS.pptx
Deep Learning for Natural Language Processing_FDP on 16 June 2025 MITS.pptxresming1 This gives an introduction to how NLP has evolved from the time of World War II till this date through the advances in approaches, architectures and word representations. From rule based approaches, it advanced to statistical approaches. from traditional machine learning algorithms it advanced to deep neural network architectures. Deep neural architectures include recurrent neural networks, long short term memory, gated recurrent units, seq2seq models, encoder decoder models, transformer architecture, upto large language models and vision language models which are multimodal in nature.
Call For Papers - 17th International Conference on Wireless & Mobile Networks...
Call For Papers - 17th International Conference on Wireless & Mobile Networks...hosseinihamid192023 17th International Conference on Wireless & Mobile Networks (WiMoNe 2025) will provide
an excellent international forum for sharing knowledge and results in theory, methodology and
applications of Wireless & Mobile computing Environment. Current information age is witnessing
a dramatic use of digital and electronic devices in the workplace and beyond. Wireless, Mobile
Networks & its applications had received a significant and sustained research interest in terms of
designing and deploying large scale and high performance computational applications in real life.
The aim of the conference is to provide a platform to the researchers and practitioners from both
academia as well as industry to meet and share cutting-edge development in the field.
How to Un-Obsolete Your Legacy Keypad Design
How to Un-Obsolete Your Legacy Keypad DesignEpec Engineered Technologies For any number of circumstances, obsolescence risk is ever present in the electronics industry. This is especially true for human-to-machine interface hardware, such as keypads, touchscreens, front panels, bezels, etc. This industry is known for its high mix and low-volume builds, critical design requirements, and high costs to requalify hardware. Because of these reasons, many programs will face end-of-life challenges both at the component level as well as at the supplier level.
Redesigns and qualifications can take months or even years, so proactively managing this risk is the best way to deter this. If an LED is obsolete or a switch vendor has gone out of business, there are options to proceed.
In this webinar, we cover options to redesign and reverse engineer legacy keypad and touchscreen designs.
For more information on our HMI solutions, visit https://www.epectec.com/user-interfaces.
Validating a Citizen Observatories enabling Platform by completing a Citizen ...
Validating a Citizen Observatories enabling Platform by completing a Citizen ...Diego López-de-Ipiña González-de-Artaza
Ad
Machine Learning with Python- Machine Learning Algorithms- Random Forest.pdf
- 1. Machine Learning with Python Machine Learning Algorithms - RANDOM FOREST Prof.ShibdasDutta, Associate Professor, DCGDATACORESYSTEMSINDIAPVTLTD Kolkata Company Confidential: Data-Core Systems, Inc. | datacoresystems.com
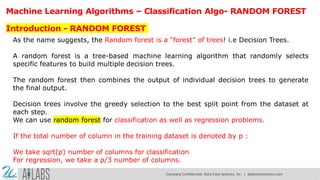
- 2. Machine Learning Algorithms – Classification Algo- RANDOM FOREST Introduction - RANDOM FOREST As the name suggests, the Random forest is a “forest” of trees! i.e Decision Trees. A random forest is a tree-based machine learning algorithm that randomly selects specific features to build multiple decision trees. The random forest then combines the output of individual decision trees to generate the final output. Decision trees involve the greedy selection to the best split point from the dataset at each step. We can use random forest for classification as well as regression problems. If the total number of column in the training dataset is denoted by p : We take sqrt(p) number of columns for classification For regression, we take a p/3 number of columns. Company Confidential: Data-Core Systems, Inc. | datacoresystems.com
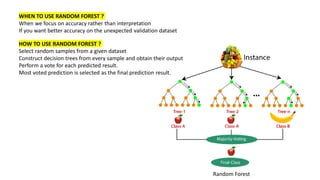
- 3. WHEN TO USE RANDOM FOREST ? When we focus on accuracy rather than interpretation If you want better accuracy on the unexpected validation dataset HOW TO USE RANDOM FOREST ? Select random samples from a given dataset Construct decision trees from every sample and obtain their output Perform a vote for each predicted result. Most voted prediction is selected as the final prediction result. Random Forest
- 4. Training Sample 1 Training Sample 2 Voting Prediction Training Sample 1 Training Sample n Training Sample 1 Training Sample 1 Training Set Test Set The following diagram will illustrate its working: Company Confidential: Data-Core Systems, Inc. | datacoresystems.com
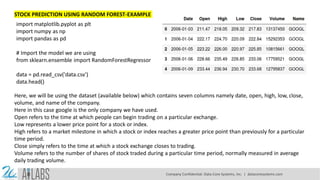
- 5. STOCK PREDICTION USING RANDOM FOREST-EXAMPLE import matplotlib.pyplot as plt import numpy as np import pandas as pd # Import the model we are using from sklearn.ensemble import RandomForestRegressor data = pd.read_csv('data.csv') data.head() Here, we will be using the dataset (available below) which contains seven columns namely date, open, high, low, close, volume, and name of the company. Here in this case google is the only company we have used. Open refers to the time at which people can begin trading on a particular exchange. Low represents a lower price point for a stock or index. High refers to a market milestone in which a stock or index reaches a greater price point than previously for a particular time period. Close simply refers to the time at which a stock exchange closes to trading. Volume refers to the number of shares of stock traded during a particular time period, normally measured in average daily trading volume. Company Confidential: Data-Core Systems, Inc. | datacoresystems.com
- 6. abc=[] for i in range(len(data)): abc.append(data['Date'][i].split('-')) data['Date'][i] = ''.join(abc[i]) Using above dataset, we are now trying to predict the ‘Close’ Value based on all attributes. Let’s split the data into train and test dataset. #These are the labels: They describe what the stock price was over a period. X_1 = data.drop('Close',axis=1) Y_1 = data['Close'] # Using Skicit-learn to split data into training and testing sets from sklearn.model_selection import train_test_split X_train_1, X_test_1, y_train_1, y_test_1 = train_test_split(X_1, Y_1, test_size=0.33, random_state=42) Company Confidential: Data-Core Systems, Inc. | datacoresystems.com
- 7. Now, let’s instantiate the model and train the model on training dataset: rfg = RandomForestRegressor(n_estimators= 10, random_state=42) rfg.fit(X_train_1,y_train_1) pd.concat([pd.Series(rfg.predict(X_test_1)), y_test_1.reset_index( drop=True)], axis=1) Let’s find out the features on the basis of their importance by calculating numerical feature importances # Saving feature names for later use feature_list = list(X_1.columns) print(feature_list) # Get numerical feature importances importances = list(rfg.feature_importances_) # List of tuples with variable and importance feature_importances = [(feature, round(importance, 2)) for feature, importance in zip(feature_list, importances)] # Sort the feature importances by most important first feature_importances = sorted(feature_importances, key = lambda x: x[1], reverse = True) # Print out the feature and importances [print('Variable: {:20} Importance: {}'.format(*pair)) for pair in feature_importances]; Company Confidential: Data-Core Systems, Inc. | datacoresystems.com
- 8. rfg.score(X_test_1, y_test_1) We are getting an accuracy of ~99% while predicting. We then display the original value and the predicted Values. pd.concat([pd.Series(rfg.predict(X_test_1)), y_test_1.reset_index(drop=True)], axis=1) Prediction Company Confidential: Data-Core Systems, Inc. | datacoresystems.com
- 9. ADVANTAGES OF RANDOM FOREST It reduces overfitting as it yields prediction based on majority voting. Random forest can be used for classification as well as regression. It works well on a large range of datasets. Random forest provides better accuracy on unseen data and even if some data is missing Data normalization isn’t required as it is a rule-based approach DISADVANTAGES Random forest requires much more computational power and memory space to build numerous decision trees. Due to the ensemble of decision trees, it also suffers interpretability and fails to determine the significance of each variable. Random forests can be less intuitive for a large collection of decision trees. Using bagging techniques, Random forest makes trees only which are dependent on each other. Bagging might provide similar predictions in each tree as the same greedy algorithm is used to create each decision tree. Hence, it is likely to be using the same or very similar split points in each tree which mitigates the variance originally sought. Company Confidential: Data-Core Systems, Inc. | datacoresystems.com
- 10. Thank You Company Confidential: Data-Core Systems, Inc. | datacoresystems.com