SlideShare a Scribd company logo
WIFI SSID:Spark+AISummit | Password: UnifiedDataAnalytics
Luca Canali, CERN
Performance
Troubleshooting Using
Apache Spark Metrics
#UnifiedDataAnalytics #SparkAISummit
About Luca
3#UnifiedDataAnalytics #SparkAISummit
• Data Engineer at CERN
– Hadoop and Spark service, database services
– 19+ years of experience with data engineering
• Sharing and community
– Blog, notes, tools, contributions to Apache Spark
@LucaCanaliDB – http://cern.ch/canali
4
CERN: founded in 1954: 12 European States
Science for Peace and Development
Today: 23 Member States
Member States: Austria, Belgium, Bulgaria, Czech Republic, Denmark, Finland, France,
Germany, Greece, Hungary, Israel, Italy, Netherlands, Norway, Poland, Portugal, Romania,
Serbia, Slovak Republic, Spain, Sweden, Switzerland and United Kingdom
Associate Members in the Pre-Stage to Membership: Cyprus, Slovenia
Associate Member States: India, Lithuania, Pakistan, Turkey, Ukraine
Applications for Membership or Associate Membership: Brazil, Croatia, Estonia
Observers to Council: Japan, Russia, United States of America; European Union, JINR
and UNESCO
~ 2600 staff
~ 1800 other paid personnel
~ 14000 scientific users
Budget (2019) ~ 1200 MCHF
Data at the Large Hadron Collider
LHC experiments data: >300 PB
Computing jobs on the WLCG Grid: using ~1M cores
5
Analytics Platform @CERN
HEP software
Experiments storage
HDFS
Personal storage
- “Big Data” open source components
- Integrated with domain-specific
software and existing infrastructure
- Users in: Physics, Accelerators, IT
6
Hadoop and Spark Clusters at CERN
• Spark running on clusters:
– YARN/Hadoop
– Spark on Kubernetes
Accelerator logging
(part of LHC
infrastructure)
Hadoop - YARN - 30 nodes
(Cores - 1200, Mem - 13 TB, Storage – 7.5 PB)
General Purpose Hadoop - YARN, 65 nodes
(Cores – 2.2k, Mem – 20 TB, Storage – 12.5 PB)
Cloud containers Kubernetes on Openstack VMs, Cores - 250, Mem – 2 TB
Storage: remote HDFS or EOS (for physics data)
7#UnifiedDataAnalytics #SparkAISummit
Text
Code
Monitoring
Visualizations
Sparkmonitor -> Jupyter extension
for Spark monitoring, developed as
a GSoC project with CERN.
https://medium.com/@krishnanr/sp
arkmonitor-big-data-tools-for-
physics-analysis-bbcdef68b35a
Performance Troubleshooting
Goals:
• Improving productivity
• Reducing resource usage and cost
• Metrics: latency, throughput, cost
How:
• Practice and methodologies
• Gather performance and workload data
9#UnifiedDataAnalytics #SparkAISummit
Performance Methodologies and
Anti-Patterns
Typical benchmark graph
– Just a simple measurement
– No root-cause analysis
– Guesses and generalization
Sound methodologies:
http://www.brendangregg.com/methodology.html
10#UnifiedDataAnalytics #SparkAISummit
0
2
4
6
8
10
12
System A System B
TIME(MINUTES)
Vendor A benchmark
System A is
5x faster!
Workload and Performance Data
• You want data to find answers to questions like
– What is my workload doing?
– Where is it spending time?
– What are the bottlenecks (CPU, I/O)?
– How are systems resources used?
– Why do I measure the {latency/throughput} that I
measure?
• Why is not 10x better?
11#EUdev2
Data + Context => Insights
Workload monitoring data +
Spark architecture knowledge
12#UnifiedDataAnalytics #SparkAISummit
Application
Info on application
architecture
Info on computing
environment
Agent takes produces:
insights + actions
Measuring Spark
• Distributed system, parallel architecture
– Many components, complexity increases when running at scale
– Execution hierarchy: SQL -> Jobs -> Stages -> Tasks
– Interaction with clusters and storage
13#UnifiedDataAnalytics #SparkAISummit
Spark Instrumentation - WebUI
WebUI and History server: standard instrumentation
• Details on jobs, stages, tasks
• Default: http://driver_host:4040
• Details on SQL execution and execution plans
• https://github.com/apache/spark/blob/master/docs/web-ui.md
14#UnifiedDataAnalytics #SparkAISummit
Spark Instrumentation – Metrics
Task metrics:
• Instrument resource usage by executor tasks:
– Time spent executing tasks,
– CPU used, I/O metrics,
– Shuffle read/write details, ..
– SPARK-25170:
https://spark.apache.org/docs/latest/monitoring.html
SQL metrics:
• DataFrame/SQL operations. Mostly used by Web UI SQL tab.
See SPARK-28935 + Web-UI documentation
15#UnifiedDataAnalytics #SparkAISummit
Task
How to Gather Spark Task Metrics
• Web UI exposes REST API
Example: http://localhost:4040/api/v1/applications
History server reads from Event Log (JSON file)
– spark.eventLog.enabled=true
– spark.eventLog.dir = <path>
• Programmatic interface via “Spark Listeners”
sparkMeasure -> a tool and working example code of
how to collect metrics with Spark Listeners
16#UnifiedDataAnalytics #SparkAISummit
Spark Metrics in REST API
…
17#UnifiedDataAnalytics #SparkAISummit
Task Metrics in the Event Log
val df = spark.read.json("/var/log/spark-history/application_1567507314781_..")
df.filter("Event='SparkListenerTaskEnd'").select("Task Metrics.*").printSchema
18#UnifiedDataAnalytics #SparkAISummit
|-- Disk Bytes Spilled: long (nullable = true)
|-- Executor CPU Time: long (nullable = true)
|-- Executor Deserialize CPU Time: long (nullable = true)
|-- Executor Deserialize Time: long (nullable = true)
|-- Executor Run Time: long (nullable = true)
|-- Input Metrics: struct (nullable = true)
| |-- Bytes Read: long (nullable = true)
| |-- Records Read: long (nullable = true)
|-- JVM GC Time: long (nullable = true)
|-- Memory Bytes Spilled: long (nullable = true)
|-- Output Metrics: struct (nullable = true)
| |-- Bytes Written: long (nullable = true)
| |-- Records Written: long (nullable = true)
|-- Result Serialization Time: long (nullable = true)
|-- Result Size: long (nullable = true)
|-- Shuffle Read Metrics: struct (nullable = true)
| |-- Fetch Wait Time: long (nullable = true)
| |-- Local Blocks Fetched: long (nullable = true)
| |-- Local Bytes Read: long (nullable = true)
| |-- Remote Blocks Fetched: long (nullable = true)
| |-- Remote Bytes Read: long (nullable = true)
| |-- Remote Bytes Read To Disk: long (nullable = true)
| |-- Total Records Read: long (nullable = true)
|-- Shuffle Write Metrics: struct (nullable = true)
| |-- Shuffle Bytes Written: long (nullable = true)
| |-- Shuffle Records Written: long (nullable = true)
| |-- Shuffle Write Time: long (nullable = true)
|-- Updated Blocks: array (nullable = true)
| |-- element: string (containsNull = true)
Spark Internal Task metrics:
Provide info on executors’ activity:
Run time, CPU time used, I/O metrics, JVM
Garbage Collection, Shuffle activity, etc.
Spark Listeners, @DeveloperApi
• Custom class, extends SparkListener
• Methods react on events to collect data, example:
• Attach custom Lister class to Spark Session
--conf spark.extraListeners=..
19
SparkMeasure Architecture
20#UnifiedDataAnalytics #SparkAISummit
SparkMeasure – Getting Started
21#UnifiedDataAnalytics #SparkAISummit
• bin/spark-shell --packages ch.cern.sparkmeasure:spark-
measure_2.11:0.15
• bin/spark-shell --packages ch.cern.sparkmeasure:spark-
measure_2.11:0.15
• val stageMetrics = ch.cern.sparkmeasure.StageMetrics(spark)
•
• bin/spark-shell --packages ch.cern.sparkmeasure:spark-
measure_2.11:0.15
• val stageMetrics = ch.cern.sparkmeasure.StageMetrics(spark)
•
• val myQuery = "select count(*) from range(1000) cross join
range(1000) cross join range(1000)"
• stageMetrics.runAndMeasure(spark.sql(myQuery).show())
SparkMeasure Output Example
22#UnifiedDataAnalytics #SparkAISummit
• Scheduling mode = FIFO
• Spark Context default degree of parallelism = 8
• Aggregated Spark stage metrics:
• numStages => 3
• sum(numTasks) => 17
• elapsedTime => 9103 (9 s)
• sum(stageDuration) => 9027 (9 s)
• sum(executorRunTime) => 69238 (1.2 min)
• sum(executorCpuTime) => 68004 (1.1 min)
• sum(executorDeserializeTime) => 1031 (1 s)
• sum(executorDeserializeCpuTime) => 151 (0.2 s)
• sum(resultSerializationTime) => 5 (5 ms)
• sum(jvmGCTime) => 64 (64 ms)
• sum(shuffleFetchWaitTime) => 0 (0 ms)
• sum(shuffleWriteTime) => 26 (26 ms)
• max(resultSize) => 17934 (17.0 KB)
• sum(numUpdatedBlockStatuses) => 0
• sum(diskBytesSpilled) => 0 (0 Bytes)
• sum(memoryBytesSpilled) => 0 (0 Bytes)
• max(peakExecutionMemory) => 0
• sum(recordsRead) => 2000
• sum(bytesRead) => 0 (0 Bytes)
• sum(recordsWritten) => 0
• sum(bytesWritten) => 0 (0 Bytes)
• sum(shuffleTotalBytesRead) => 472 (472 Bytes)
• sum(shuffleTotalBlocksFetched) => 8
• sum(shuffleLocalBlocksFetched) => 8
• sum(shuffleRemoteBlocksFetched) => 0
• sum(shuffleBytesWritten) => 472 (472 Bytes)
• sum(shuffleRecordsWritten) => 8
SparkMeasure, Usage Modes
• Interactive: use from shell or notebooks
– Works with Jupyter notebooks, Azure, Colab, Databricks, etc.
• Use to instrument your code
• Flight recorder mode
– No changes needed to the code
– For Troubleshooting, for CI/CD pipelines, …
• Use with Scala, Python, Java
23#UnifiedDataAnalytics #SparkAISummit
https://github.com/LucaCanali/sparkMeasure
Instrument Code with
SparkMeasure
24#UnifiedDataAnalytics #SparkAISummit
https://github.com/LucaCanali/sparkMeasure/blob/master/docs/Instrument_Python_code.md
SparkMeasure on Notebooks:
Local Jupyter and Cloud Services
25#UnifiedDataAnalytics #SparkAISummit
https://github.com/LucaCanali/sparkMeasure/tree/master/examples
SparkMeasure on Notebooks:
Jupyter Magic: %%sparkmeasure
26#UnifiedDataAnalytics #SparkAISummit
… (note, output truncated to fit in slide
SparkMeasure as Flight Recorder
Capture metrics and write to files when finished:
27#UnifiedDataAnalytics #SparkAISummit
Monitoring option: write to InfluxDB on the fly:
Spark Metrics System
• Spark is also instrumented using the
Dropwizard/Codahale metrics library
• Multiple sources (data providers)
– Various instrumentation points in Spark code
– Including task metrics, scheduler, etc
– Instrumentation from the JVM
• Multiple sinks
– Graphite (InfluxDB), JMX, HTTP, CSV, etc…
28#UnifiedDataAnalytics #SparkAISummit
Ingredients for a Spark
Performance Dashboard
• Architecture
– Know how the “Dropwizard metrics system” works
– Which Spark components are instrumented
• Configure backend components
– InfluxDB and Grafana
• Relevant Spark configuration parameters
• Dashboard graphs
– familiarize with available metrics
– InfluxDB query building for dashboard graphs
29#UnifiedDataAnalytics #SparkAISummit
Spark Performance Dashboard
30#UnifiedDataAnalytics #SparkAISummit
Send Spark Metrics to InfluxDB
31#UnifiedDataAnalytics #SparkAISummit
• $ SPARK_HOME/bin/spark-shell 
• --conf "spark.metrics.conf.driver.sink.graphite.class"="org.apache.spark.metrics.sink.GraphiteSink"
• --conf
"spark.metrics.conf.executor.sink.graphite.class"="org.apache.spark.metrics.sink.GraphiteSink"
• --conf "spark.metrics.conf.*.sink.graphite.host"="graphiteEndPoint_influxDB_hostName>" 
• --conf "spark.metrics.conf.*.sink.graphite.port"=<graphite_listening_port> 
• --conf "spark.metrics.conf.*.sink.graphite.period"=10 
• --conf "spark.metrics.conf.*.sink.graphite.unit"=seconds 
• --conf "spark.metrics.conf.*.sink.graphite.prefix"="lucatest" 
• --conf "spark.metrics.conf.*.source.jvm.class"="org.apache.spark.metrics.source.JvmSource"
• Edit $SPARK_HOME/conf/metrics.properties
• Alternative: use the config parameters spark.metrics.conf.*
Assemble Dashboard Components
• Metrics written from Spark to InfluxDB
– Configuration of a Graphite endpoint in influxdb.conf
– Templates: how to ingest Spark metrics into InfluxDB series
https://github.com/LucaCanali/Miscellaneous/tree/master/Spark_Dashboard
• Grafana graphs built using data queried from InfluxDB
– Get started: Import an example dashboard definition
• Kubernetes users: a helm chart to automate config at:
– https://github.com/cerndb/spark-dashboard
32#UnifiedDataAnalytics #SparkAISummit
Grafana Dashboard
• Summaries
• Key metrics
• Graphs for drill-down analysis
33#UnifiedDataAnalytics #SparkAISummit
Spark Dashboard - Examples
Graph: “number of active tasks” vs. time
• Is Spark using all the available resources/cores?
• Are there time ranges with significant gaps?
Identify possible issues:
• Long tails
• Stragglers
• Data skew
34#UnifiedDataAnalytics #SparkAISummit
Dashboard – I/O metrics
Graph: “HDFS Read Throughput” vs. time
35#UnifiedDataAnalytics #SparkAISummit
Dashboard – Memory
Graphs of JVM
memory usage
• Heap
• Off-heap
• Executors and
driver
36#UnifiedDataAnalytics #SparkAISummit
Dashboard – Executor CPU
Utilization
Graph: “CPU utilization by executors’ JVM” vs. time
• Total JVM CPU:
• CPU used by tasks
• CPU used by GC
37#UnifiedDataAnalytics #SparkAISummit
Task Time Drill Down, by Activity
Graph: Task total run time + drill down by component:
• CPU, Wait time, Garbage collection, etc
Investigation:
• CPU bound?
• Impact of GC
• I/O time?
• Other time?
38#UnifiedDataAnalytics #SparkAISummit
Graph Annotations
Improvement:
• Mark SQL/job/stage begin and
end timestamps
Implementation:
• SparkMeasure collects and writes
query/jobs begin and end
timestamps data to InfluxDB
• Grafana implements annotations
39#UnifiedDataAnalytics #SparkAISummit
Spark Dashboard, Lessons Learned
• Very useful to search for bottlenecks
– Many instrumented components
– Drilldown where time is spent
– Time evolution details
• Time series of N# active tasks, CPU, I/O, memory, etc
• Effort: you have to understand the root causes
– Use data to make and prove or disprove models
– The instrumentation is still evolving
• example: I/O time is not measured directly, Python UDF, etc
40#UnifiedDataAnalytics #SparkAISummit
WIP: How to Measure I/O Time?
Goal:
• How much of the workload time is spent
doing I/O (reading)?
Apache Spark does not instrument I/O time
• Apache Hadoop Filesystem API does
not measure I/O time
Experimenting
• Added I/O read time instrumentation for
HDFS and S3A to sandbox Hadoop fork
• Exported the metrics using Spark
Executor Plugins SPARK-28091
41#UnifiedDataAnalytics #SparkAISummit
Missing time instrumentation
Green bars: measured HDFS read time
Executor run time and wait time components
Executor Plugins Extend Metrics
• User-defined executor metrics, SPARK-28091, target Spark 3.0.0
– Example: add I/O metrics for s3a filesystem:
42
/bin/spark-shell --jars <path>/sparkexecutorplugins_2.12-0.1.jar 
--conf spark.executor.plugins=ch.cern.ExecutorPluginScala.S3AMetrics27
https://github.com/cerndb/SparkExecutorPlugins
Metrics from OS Monitoring
• Very useful also to collect OS-based metrics
– Hadoop: dashboard with HDFS and YARN metrics
– OS host metrics: Collectd, Ganglia
– Kubernetes: Prometheus-based monitoring and
dashboard
43#UnifiedDataAnalytics #SparkAISummit
Notable JIRAs about Metrics
• Documentation improvements “Spark monitoring”
– Master, SPARK-26890, Add Dropwizard metrics list and configuration details
– Spark 2.4.0, SPARK-25170: Add Task Metrics description to the documentation
• Master, SPARK-23206 Additional Memory Tuning Metrics
– Master, SPARK-29064 Add Prometheus endpoint for executor metrics
– WIP, SPARK-27189 Add memory usage metrics to the metrics system
• Master, SPARK-28091 Extend Spark metrics system with user-
defined metrics using executor plugins
• Master, SPARK-28475 Add regex MetricFilter to GraphiteSink
• CPU time used by JVM:
– Spark 2.4.0: SPARK-25228 Add executor CPU Time metric
– Master: SPARK-26928, Add driver CPU Time to the metrics system,
• Spark 2.3.0: SPARK-22190 Add Spark executor task metrics to
Dropwizard metrics
44#UnifiedDataAnalytics #SparkAISummit
Conclusions
• Performance troubleshooting by understanding
– Spark architecture + Spark instrumentation, Web UI
– Spark Task metrics + Listeners, tool: sparkMeasure
– Spark Metrics System, tool: Grafana dashboard
• Contribute, adopt, share
– Instrumentation in Spark ecosystem keeps improving
– Solid methodologies and tools are key
– Share your results, tools, issues, dashboards..
45#UnifiedDataAnalytics #SparkAISummit
Instrumentation +
Context
Insights +
Actions
Acknowledgements
• Colleagues at CERN
– Hadoop and Spark service, in particular Prasanth Kothuri and
Riccardo Castellotti
• Thanks to Apache Spark committers and community
– Help with JIRAs and PRs
• References:
– https://github.com/LucaCanali/sparkmeasure
– https://db-blog.web.cern.ch/blog/luca-canali/2019-02-
performance-dashboard-apache-spark
46#UnifiedDataAnalytics #SparkAISummit
DON’T FORGET TO RATE
AND REVIEW THE SESSIONS
SEARCH SPARK + AI SUMMIT
Ad

Recommended

Spark + Parquet In Depth: Spark Summit East Talk by Emily Curtin and Robbie S...
Spark Summit
 
Apache Spark Core – Practical Optimization
Databricks
 
Understanding Query Plans and Spark UIs
Databricks
 
The Apache Spark File Format Ecosystem
Databricks
 
The Parquet Format and Performance Optimization Opportunities
Databricks
 
Improving SparkSQL Performance by 30%: How We Optimize Parquet Pushdown and P...
Databricks
 
Deep Dive: Memory Management in Apache Spark
Databricks
 
Top 5 Mistakes to Avoid When Writing Apache Spark Applications
Cloudera, Inc.
 
Apache Spark Core—Deep Dive—Proper Optimization
Databricks
 
Best Practices for Enabling Speculative Execution on Large Scale Platforms
Databricks
 
Apache Flink internals
Kostas Tzoumas
 
Dynamic Partition Pruning in Apache Spark
Databricks
 
Dive into PySpark
Dive into PySpark
Mateusz Buśkiewicz
 
Efficient Data Storage for Analytics with Apache Parquet 2.0
Cloudera, Inc.
 
Real-time Analytics with Trino and Apache Pinot
Xiang Fu
 
Deep Dive into Spark SQL with Advanced Performance Tuning with Xiao Li & Wenc...
Databricks
 
Running Apache NiFi with Apache Spark : Integration Options
Timothy Spann
 
Scaling your Data Pipelines with Apache Spark on Kubernetes
Databricks
 
Spark Performance Tuning .pdf
Amit Raj
 
Parquet performance tuning: the missing guide
Ryan Blue
 
Designing ETL Pipelines with Structured Streaming and Delta Lake—How to Archi...
Databricks
 
A Deep Dive into Stateful Stream Processing in Structured Streaming with Tath...
Databricks
 
Parquet Hadoop Summit 2013
Julien Le Dem
 
Making Apache Spark Better with Delta Lake
Databricks
 
The Rise of ZStandard: Apache Spark/Parquet/ORC/Avro
Databricks
 
Programming in Spark using PySpark
Mostafa
 
Tuning Apache Spark for Large-Scale Workloads Gaoxiang Liu and Sital Kedia
Databricks
 
Apache Spark Introduction and Resilient Distributed Dataset basics and deep dive
Sachin Aggarwal
 
Apache Spark Performance Troubleshooting at Scale, Challenges, Tools, and Met...
Databricks
 
What is New with Apache Spark Performance Monitoring in Spark 3.0
Databricks
 

More Related Content

What's hot (20)

Apache Spark Core—Deep Dive—Proper Optimization
Databricks
 
Best Practices for Enabling Speculative Execution on Large Scale Platforms
Databricks
 
Apache Flink internals
Kostas Tzoumas
 
Dynamic Partition Pruning in Apache Spark
Databricks
 
Dive into PySpark
Dive into PySpark
Mateusz Buśkiewicz
 
Efficient Data Storage for Analytics with Apache Parquet 2.0
Cloudera, Inc.
 
Real-time Analytics with Trino and Apache Pinot
Xiang Fu
 
Deep Dive into Spark SQL with Advanced Performance Tuning with Xiao Li & Wenc...
Databricks
 
Running Apache NiFi with Apache Spark : Integration Options
Timothy Spann
 
Scaling your Data Pipelines with Apache Spark on Kubernetes
Databricks
 
Spark Performance Tuning .pdf
Amit Raj
 
Parquet performance tuning: the missing guide
Ryan Blue
 
Designing ETL Pipelines with Structured Streaming and Delta Lake—How to Archi...
Databricks
 
A Deep Dive into Stateful Stream Processing in Structured Streaming with Tath...
Databricks
 
Parquet Hadoop Summit 2013
Julien Le Dem
 
Making Apache Spark Better with Delta Lake
Databricks
 
The Rise of ZStandard: Apache Spark/Parquet/ORC/Avro
Databricks
 
Programming in Spark using PySpark
Mostafa
 
Tuning Apache Spark for Large-Scale Workloads Gaoxiang Liu and Sital Kedia
Databricks
 
Apache Spark Introduction and Resilient Distributed Dataset basics and deep dive
Sachin Aggarwal
 
Apache Spark Core—Deep Dive—Proper Optimization
Databricks
 
Best Practices for Enabling Speculative Execution on Large Scale Platforms
Databricks
 
Apache Flink internals
Kostas Tzoumas
 
Dynamic Partition Pruning in Apache Spark
Databricks
 
Efficient Data Storage for Analytics with Apache Parquet 2.0
Cloudera, Inc.
 
Real-time Analytics with Trino and Apache Pinot
Xiang Fu
 
Deep Dive into Spark SQL with Advanced Performance Tuning with Xiao Li & Wenc...
Databricks
 
Running Apache NiFi with Apache Spark : Integration Options
Timothy Spann
 
Scaling your Data Pipelines with Apache Spark on Kubernetes
Databricks
 
Spark Performance Tuning .pdf
Amit Raj
 
Parquet performance tuning: the missing guide
Ryan Blue
 
Designing ETL Pipelines with Structured Streaming and Delta Lake—How to Archi...
Databricks
 
A Deep Dive into Stateful Stream Processing in Structured Streaming with Tath...
Databricks
 
Parquet Hadoop Summit 2013
Julien Le Dem
 
Making Apache Spark Better with Delta Lake
Databricks
 
The Rise of ZStandard: Apache Spark/Parquet/ORC/Avro
Databricks
 
Programming in Spark using PySpark
Mostafa
 
Tuning Apache Spark for Large-Scale Workloads Gaoxiang Liu and Sital Kedia
Databricks
 
Apache Spark Introduction and Resilient Distributed Dataset basics and deep dive
Sachin Aggarwal
 

Similar to Performance Troubleshooting Using Apache Spark Metrics (20)

Apache Spark Performance Troubleshooting at Scale, Challenges, Tools, and Met...
Databricks
 
What is New with Apache Spark Performance Monitoring in Spark 3.0
Databricks
 
Monitor Apache Spark 3 on Kubernetes using Metrics and Plugins
Databricks
 
Apache Spark for RDBMS Practitioners: How I Learned to Stop Worrying and Lov...
Databricks
 
Spark Summit EU talk by Luca Canali
Spark Summit
 
Linux Systems Performance 2016
Brendan Gregg
 
Native Support of Prometheus Monitoring in Apache Spark 3.0
Databricks
 
Productizing Structured Streaming Jobs
Databricks
 
ETL with SPARK - First Spark London meetup
Rafal Kwasny
 
SparkR - Scalable machine learning - Utah R Users Group - U of U - June 17th
Alton Alexander
 
Native support of Prometheus monitoring in Apache Spark 3
Dongjoon Hyun
 
2021 04-20 apache arrow and its impact on the database industry.pptx
Andrew Lamb
 
Deep Dive into GPU Support in Apache Spark 3.x
Databricks
 
Vectorized Deep Learning Acceleration from Preprocessing to Inference and Tra...
Databricks
 
Geek Sync I Learn to Troubleshoot Query Performance in Analysis Services
IDERA Software
 
Typesafe spark- Zalando meetup
Stavros Kontopoulos
 
Apache Cassandra at Macys
DataStax Academy
 
Keeping Spark on Track: Productionizing Spark for ETL
Databricks
 
Analyze database system using a 3 d method
Ajith Narayanan
 
Spark Meetup TensorFrames
Jen Aman
 
Apache Spark Performance Troubleshooting at Scale, Challenges, Tools, and Met...
Databricks
 
What is New with Apache Spark Performance Monitoring in Spark 3.0
Databricks
 
Monitor Apache Spark 3 on Kubernetes using Metrics and Plugins
Databricks
 
Apache Spark for RDBMS Practitioners: How I Learned to Stop Worrying and Lov...
Databricks
 
Spark Summit EU talk by Luca Canali
Spark Summit
 
Linux Systems Performance 2016
Brendan Gregg
 
Native Support of Prometheus Monitoring in Apache Spark 3.0
Databricks
 
Productizing Structured Streaming Jobs
Databricks
 
ETL with SPARK - First Spark London meetup
Rafal Kwasny
 
SparkR - Scalable machine learning - Utah R Users Group - U of U - June 17th
Alton Alexander
 
Native support of Prometheus monitoring in Apache Spark 3
Dongjoon Hyun
 
2021 04-20 apache arrow and its impact on the database industry.pptx
Andrew Lamb
 
Deep Dive into GPU Support in Apache Spark 3.x
Databricks
 
Vectorized Deep Learning Acceleration from Preprocessing to Inference and Tra...
Databricks
 
Geek Sync I Learn to Troubleshoot Query Performance in Analysis Services
IDERA Software
 
Keeping Spark on Track: Productionizing Spark for ETL
Databricks
 
Analyze database system using a 3 d method
Ajith Narayanan
 
Spark Meetup TensorFrames
Jen Aman
 
Ad

More from Databricks (20)

DW Migration Webinar-March 2022.pptx
Databricks
 
Data Lakehouse Symposium | Day 1 | Part 1
Databricks
 
Data Lakehouse Symposium | Day 1 | Part 2
Databricks
 
Data Lakehouse Symposium | Day 2
Databricks
 
Data Lakehouse Symposium | Day 4
Databricks
 
5 Critical Steps to Clean Your Data Swamp When Migrating Off of Hadoop
Databricks
 
Democratizing Data Quality Through a Centralized Platform
Databricks
 
Learn to Use Databricks for Data Science
Databricks
 
Why APM Is Not the Same As ML Monitoring
Databricks
 
The Function, the Context, and the Data—Enabling ML Ops at Stitch Fix
Databricks
 
Stage Level Scheduling Improving Big Data and AI Integration
Databricks
 
Simplify Data Conversion from Spark to TensorFlow and PyTorch
Databricks
 
Scaling and Unifying SciKit Learn and Apache Spark Pipelines
Databricks
 
Sawtooth Windows for Feature Aggregations
Databricks
 
Redis + Apache Spark = Swiss Army Knife Meets Kitchen Sink
Databricks
 
Re-imagine Data Monitoring with whylogs and Spark
Databricks
 
Raven: End-to-end Optimization of ML Prediction Queries
Databricks
 
Processing Large Datasets for ADAS Applications using Apache Spark
Databricks
 
Massive Data Processing in Adobe Using Delta Lake
Databricks
 
Machine Learning CI/CD for Email Attack Detection
Databricks
 
Ad

Recently uploaded (20)

Presentation by Tariq & Mohammed (1).pptx
AbooddSandoqaa
 
一比一原版(TUC毕业证书)开姆尼茨工业大学毕业证如何办理
taqyed
 
Attendance Presentation Project Excel.pptx
s2025266191
 
Lesson-3_Program-Outcomes-and-Student-Learning-Outcomes_For-Students.pdf
SarahMaeDuallo
 
Crafting-Research-Recommendations Grade 12.pptx
DaryllWhere
 
英国毕业证范本利物浦约翰摩尔斯大学成绩单底纹防伪LJMU学生证办理学历认证
taqyed
 
Artigo - Playing to Win.planejamento docx
KellyXavier15
 
Flextronics Employee Safety Data-Project-2.pptx
kilarihemadri
 
MRI Pulse Sequence in radiology physics.pptx
BelaynehBishaw
 
最新版美国威斯康星大学河城分校毕业证(UWRF毕业证书)原版定制
taqyea
 
最新版美国约翰霍普金斯大学毕业证(JHU毕业证书)原版定制
Taqyea
 
定制OCAD学生卡加拿大安大略艺术与设计大学成绩单范本,OCAD成绩单复刻
taqyed
 
Data Visualisation in data science for students
confidenceascend
 
Prescriptive Process Monitoring Under Uncertainty and Resource Constraints: A...
Mahmoud Shoush
 
Model Evaluation & Visualisation part of a series of intro modules for data ...
brandonlee626749
 
All the DataOps, all the paradigms .
Lars Albertsson
 
Indigo_Airlines_Strategy_Presentation.pptx
mukeshpurohit991
 
25 items quiz for practical research 1 in grade 11
leamaydayaganon81
 
The Influence off Flexible Work Policies
sales480687
 
Microsoft Power BI - Advanced Certificate for Business Intelligence using Pow...
Prasenjit Debnath
 

Performance Troubleshooting Using Apache Spark Metrics

  • 1. WIFI SSID:Spark+AISummit | Password: UnifiedDataAnalytics
  • 2. Luca Canali, CERN Performance Troubleshooting Using Apache Spark Metrics #UnifiedDataAnalytics #SparkAISummit
  • 3. About Luca 3#UnifiedDataAnalytics #SparkAISummit • Data Engineer at CERN – Hadoop and Spark service, database services – 19+ years of experience with data engineering • Sharing and community – Blog, notes, tools, contributions to Apache Spark @LucaCanaliDB – http://cern.ch/canali
  • 4. 4 CERN: founded in 1954: 12 European States Science for Peace and Development Today: 23 Member States Member States: Austria, Belgium, Bulgaria, Czech Republic, Denmark, Finland, France, Germany, Greece, Hungary, Israel, Italy, Netherlands, Norway, Poland, Portugal, Romania, Serbia, Slovak Republic, Spain, Sweden, Switzerland and United Kingdom Associate Members in the Pre-Stage to Membership: Cyprus, Slovenia Associate Member States: India, Lithuania, Pakistan, Turkey, Ukraine Applications for Membership or Associate Membership: Brazil, Croatia, Estonia Observers to Council: Japan, Russia, United States of America; European Union, JINR and UNESCO ~ 2600 staff ~ 1800 other paid personnel ~ 14000 scientific users Budget (2019) ~ 1200 MCHF
  • 5. Data at the Large Hadron Collider LHC experiments data: >300 PB Computing jobs on the WLCG Grid: using ~1M cores 5
  • 6. Analytics Platform @CERN HEP software Experiments storage HDFS Personal storage - “Big Data” open source components - Integrated with domain-specific software and existing infrastructure - Users in: Physics, Accelerators, IT 6
  • 7. Hadoop and Spark Clusters at CERN • Spark running on clusters: – YARN/Hadoop – Spark on Kubernetes Accelerator logging (part of LHC infrastructure) Hadoop - YARN - 30 nodes (Cores - 1200, Mem - 13 TB, Storage – 7.5 PB) General Purpose Hadoop - YARN, 65 nodes (Cores – 2.2k, Mem – 20 TB, Storage – 12.5 PB) Cloud containers Kubernetes on Openstack VMs, Cores - 250, Mem – 2 TB Storage: remote HDFS or EOS (for physics data) 7#UnifiedDataAnalytics #SparkAISummit
  • 8. Text Code Monitoring Visualizations Sparkmonitor -> Jupyter extension for Spark monitoring, developed as a GSoC project with CERN. https://medium.com/@krishnanr/sp arkmonitor-big-data-tools-for- physics-analysis-bbcdef68b35a
  • 9. Performance Troubleshooting Goals: • Improving productivity • Reducing resource usage and cost • Metrics: latency, throughput, cost How: • Practice and methodologies • Gather performance and workload data 9#UnifiedDataAnalytics #SparkAISummit
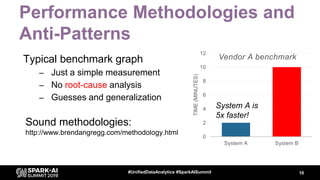
  • 10. Performance Methodologies and Anti-Patterns Typical benchmark graph – Just a simple measurement – No root-cause analysis – Guesses and generalization Sound methodologies: http://www.brendangregg.com/methodology.html 10#UnifiedDataAnalytics #SparkAISummit 0 2 4 6 8 10 12 System A System B TIME(MINUTES) Vendor A benchmark System A is 5x faster!
  • 11. Workload and Performance Data • You want data to find answers to questions like – What is my workload doing? – Where is it spending time? – What are the bottlenecks (CPU, I/O)? – How are systems resources used? – Why do I measure the {latency/throughput} that I measure? • Why is not 10x better? 11#EUdev2
  • 12. Data + Context => Insights Workload monitoring data + Spark architecture knowledge 12#UnifiedDataAnalytics #SparkAISummit Application Info on application architecture Info on computing environment Agent takes produces: insights + actions
  • 13. Measuring Spark • Distributed system, parallel architecture – Many components, complexity increases when running at scale – Execution hierarchy: SQL -> Jobs -> Stages -> Tasks – Interaction with clusters and storage 13#UnifiedDataAnalytics #SparkAISummit
  • 14. Spark Instrumentation - WebUI WebUI and History server: standard instrumentation • Details on jobs, stages, tasks • Default: http://driver_host:4040 • Details on SQL execution and execution plans • https://github.com/apache/spark/blob/master/docs/web-ui.md 14#UnifiedDataAnalytics #SparkAISummit
  • 15. Spark Instrumentation – Metrics Task metrics: • Instrument resource usage by executor tasks: – Time spent executing tasks, – CPU used, I/O metrics, – Shuffle read/write details, .. – SPARK-25170: https://spark.apache.org/docs/latest/monitoring.html SQL metrics: • DataFrame/SQL operations. Mostly used by Web UI SQL tab. See SPARK-28935 + Web-UI documentation 15#UnifiedDataAnalytics #SparkAISummit Task
  • 16. How to Gather Spark Task Metrics • Web UI exposes REST API Example: http://localhost:4040/api/v1/applications History server reads from Event Log (JSON file) – spark.eventLog.enabled=true – spark.eventLog.dir = <path> • Programmatic interface via “Spark Listeners” sparkMeasure -> a tool and working example code of how to collect metrics with Spark Listeners 16#UnifiedDataAnalytics #SparkAISummit
  • 17. Spark Metrics in REST API … 17#UnifiedDataAnalytics #SparkAISummit
  • 18. Task Metrics in the Event Log val df = spark.read.json("/var/log/spark-history/application_1567507314781_..") df.filter("Event='SparkListenerTaskEnd'").select("Task Metrics.*").printSchema 18#UnifiedDataAnalytics #SparkAISummit |-- Disk Bytes Spilled: long (nullable = true) |-- Executor CPU Time: long (nullable = true) |-- Executor Deserialize CPU Time: long (nullable = true) |-- Executor Deserialize Time: long (nullable = true) |-- Executor Run Time: long (nullable = true) |-- Input Metrics: struct (nullable = true) | |-- Bytes Read: long (nullable = true) | |-- Records Read: long (nullable = true) |-- JVM GC Time: long (nullable = true) |-- Memory Bytes Spilled: long (nullable = true) |-- Output Metrics: struct (nullable = true) | |-- Bytes Written: long (nullable = true) | |-- Records Written: long (nullable = true) |-- Result Serialization Time: long (nullable = true) |-- Result Size: long (nullable = true) |-- Shuffle Read Metrics: struct (nullable = true) | |-- Fetch Wait Time: long (nullable = true) | |-- Local Blocks Fetched: long (nullable = true) | |-- Local Bytes Read: long (nullable = true) | |-- Remote Blocks Fetched: long (nullable = true) | |-- Remote Bytes Read: long (nullable = true) | |-- Remote Bytes Read To Disk: long (nullable = true) | |-- Total Records Read: long (nullable = true) |-- Shuffle Write Metrics: struct (nullable = true) | |-- Shuffle Bytes Written: long (nullable = true) | |-- Shuffle Records Written: long (nullable = true) | |-- Shuffle Write Time: long (nullable = true) |-- Updated Blocks: array (nullable = true) | |-- element: string (containsNull = true) Spark Internal Task metrics: Provide info on executors’ activity: Run time, CPU time used, I/O metrics, JVM Garbage Collection, Shuffle activity, etc.
  • 19. Spark Listeners, @DeveloperApi • Custom class, extends SparkListener • Methods react on events to collect data, example: • Attach custom Lister class to Spark Session --conf spark.extraListeners=.. 19
  • 21. SparkMeasure – Getting Started 21#UnifiedDataAnalytics #SparkAISummit • bin/spark-shell --packages ch.cern.sparkmeasure:spark- measure_2.11:0.15 • bin/spark-shell --packages ch.cern.sparkmeasure:spark- measure_2.11:0.15 • val stageMetrics = ch.cern.sparkmeasure.StageMetrics(spark) • • bin/spark-shell --packages ch.cern.sparkmeasure:spark- measure_2.11:0.15 • val stageMetrics = ch.cern.sparkmeasure.StageMetrics(spark) • • val myQuery = "select count(*) from range(1000) cross join range(1000) cross join range(1000)" • stageMetrics.runAndMeasure(spark.sql(myQuery).show())
  • 22. SparkMeasure Output Example 22#UnifiedDataAnalytics #SparkAISummit • Scheduling mode = FIFO • Spark Context default degree of parallelism = 8 • Aggregated Spark stage metrics: • numStages => 3 • sum(numTasks) => 17 • elapsedTime => 9103 (9 s) • sum(stageDuration) => 9027 (9 s) • sum(executorRunTime) => 69238 (1.2 min) • sum(executorCpuTime) => 68004 (1.1 min) • sum(executorDeserializeTime) => 1031 (1 s) • sum(executorDeserializeCpuTime) => 151 (0.2 s) • sum(resultSerializationTime) => 5 (5 ms) • sum(jvmGCTime) => 64 (64 ms) • sum(shuffleFetchWaitTime) => 0 (0 ms) • sum(shuffleWriteTime) => 26 (26 ms) • max(resultSize) => 17934 (17.0 KB) • sum(numUpdatedBlockStatuses) => 0 • sum(diskBytesSpilled) => 0 (0 Bytes) • sum(memoryBytesSpilled) => 0 (0 Bytes) • max(peakExecutionMemory) => 0 • sum(recordsRead) => 2000 • sum(bytesRead) => 0 (0 Bytes) • sum(recordsWritten) => 0 • sum(bytesWritten) => 0 (0 Bytes) • sum(shuffleTotalBytesRead) => 472 (472 Bytes) • sum(shuffleTotalBlocksFetched) => 8 • sum(shuffleLocalBlocksFetched) => 8 • sum(shuffleRemoteBlocksFetched) => 0 • sum(shuffleBytesWritten) => 472 (472 Bytes) • sum(shuffleRecordsWritten) => 8
  • 23. SparkMeasure, Usage Modes • Interactive: use from shell or notebooks – Works with Jupyter notebooks, Azure, Colab, Databricks, etc. • Use to instrument your code • Flight recorder mode – No changes needed to the code – For Troubleshooting, for CI/CD pipelines, … • Use with Scala, Python, Java 23#UnifiedDataAnalytics #SparkAISummit https://github.com/LucaCanali/sparkMeasure
  • 24. Instrument Code with SparkMeasure 24#UnifiedDataAnalytics #SparkAISummit https://github.com/LucaCanali/sparkMeasure/blob/master/docs/Instrument_Python_code.md
  • 25. SparkMeasure on Notebooks: Local Jupyter and Cloud Services 25#UnifiedDataAnalytics #SparkAISummit https://github.com/LucaCanali/sparkMeasure/tree/master/examples
  • 26. SparkMeasure on Notebooks: Jupyter Magic: %%sparkmeasure 26#UnifiedDataAnalytics #SparkAISummit … (note, output truncated to fit in slide
  • 27. SparkMeasure as Flight Recorder Capture metrics and write to files when finished: 27#UnifiedDataAnalytics #SparkAISummit Monitoring option: write to InfluxDB on the fly:
  • 28. Spark Metrics System • Spark is also instrumented using the Dropwizard/Codahale metrics library • Multiple sources (data providers) – Various instrumentation points in Spark code – Including task metrics, scheduler, etc – Instrumentation from the JVM • Multiple sinks – Graphite (InfluxDB), JMX, HTTP, CSV, etc… 28#UnifiedDataAnalytics #SparkAISummit
  • 29. Ingredients for a Spark Performance Dashboard • Architecture – Know how the “Dropwizard metrics system” works – Which Spark components are instrumented • Configure backend components – InfluxDB and Grafana • Relevant Spark configuration parameters • Dashboard graphs – familiarize with available metrics – InfluxDB query building for dashboard graphs 29#UnifiedDataAnalytics #SparkAISummit
  • 31. Send Spark Metrics to InfluxDB 31#UnifiedDataAnalytics #SparkAISummit • $ SPARK_HOME/bin/spark-shell • --conf "spark.metrics.conf.driver.sink.graphite.class"="org.apache.spark.metrics.sink.GraphiteSink" • --conf "spark.metrics.conf.executor.sink.graphite.class"="org.apache.spark.metrics.sink.GraphiteSink" • --conf "spark.metrics.conf.*.sink.graphite.host"="graphiteEndPoint_influxDB_hostName>" • --conf "spark.metrics.conf.*.sink.graphite.port"=<graphite_listening_port> • --conf "spark.metrics.conf.*.sink.graphite.period"=10 • --conf "spark.metrics.conf.*.sink.graphite.unit"=seconds • --conf "spark.metrics.conf.*.sink.graphite.prefix"="lucatest" • --conf "spark.metrics.conf.*.source.jvm.class"="org.apache.spark.metrics.source.JvmSource" • Edit $SPARK_HOME/conf/metrics.properties • Alternative: use the config parameters spark.metrics.conf.*
  • 32. Assemble Dashboard Components • Metrics written from Spark to InfluxDB – Configuration of a Graphite endpoint in influxdb.conf – Templates: how to ingest Spark metrics into InfluxDB series https://github.com/LucaCanali/Miscellaneous/tree/master/Spark_Dashboard • Grafana graphs built using data queried from InfluxDB – Get started: Import an example dashboard definition • Kubernetes users: a helm chart to automate config at: – https://github.com/cerndb/spark-dashboard 32#UnifiedDataAnalytics #SparkAISummit
  • 33. Grafana Dashboard • Summaries • Key metrics • Graphs for drill-down analysis 33#UnifiedDataAnalytics #SparkAISummit
  • 34. Spark Dashboard - Examples Graph: “number of active tasks” vs. time • Is Spark using all the available resources/cores? • Are there time ranges with significant gaps? Identify possible issues: • Long tails • Stragglers • Data skew 34#UnifiedDataAnalytics #SparkAISummit
  • 35. Dashboard – I/O metrics Graph: “HDFS Read Throughput” vs. time 35#UnifiedDataAnalytics #SparkAISummit
  • 36. Dashboard – Memory Graphs of JVM memory usage • Heap • Off-heap • Executors and driver 36#UnifiedDataAnalytics #SparkAISummit
  • 37. Dashboard – Executor CPU Utilization Graph: “CPU utilization by executors’ JVM” vs. time • Total JVM CPU: • CPU used by tasks • CPU used by GC 37#UnifiedDataAnalytics #SparkAISummit
  • 38. Task Time Drill Down, by Activity Graph: Task total run time + drill down by component: • CPU, Wait time, Garbage collection, etc Investigation: • CPU bound? • Impact of GC • I/O time? • Other time? 38#UnifiedDataAnalytics #SparkAISummit
  • 39. Graph Annotations Improvement: • Mark SQL/job/stage begin and end timestamps Implementation: • SparkMeasure collects and writes query/jobs begin and end timestamps data to InfluxDB • Grafana implements annotations 39#UnifiedDataAnalytics #SparkAISummit
  • 40. Spark Dashboard, Lessons Learned • Very useful to search for bottlenecks – Many instrumented components – Drilldown where time is spent – Time evolution details • Time series of N# active tasks, CPU, I/O, memory, etc • Effort: you have to understand the root causes – Use data to make and prove or disprove models – The instrumentation is still evolving • example: I/O time is not measured directly, Python UDF, etc 40#UnifiedDataAnalytics #SparkAISummit
  • 41. WIP: How to Measure I/O Time? Goal: • How much of the workload time is spent doing I/O (reading)? Apache Spark does not instrument I/O time • Apache Hadoop Filesystem API does not measure I/O time Experimenting • Added I/O read time instrumentation for HDFS and S3A to sandbox Hadoop fork • Exported the metrics using Spark Executor Plugins SPARK-28091 41#UnifiedDataAnalytics #SparkAISummit Missing time instrumentation Green bars: measured HDFS read time Executor run time and wait time components
  • 42. Executor Plugins Extend Metrics • User-defined executor metrics, SPARK-28091, target Spark 3.0.0 – Example: add I/O metrics for s3a filesystem: 42 /bin/spark-shell --jars <path>/sparkexecutorplugins_2.12-0.1.jar --conf spark.executor.plugins=ch.cern.ExecutorPluginScala.S3AMetrics27 https://github.com/cerndb/SparkExecutorPlugins
  • 43. Metrics from OS Monitoring • Very useful also to collect OS-based metrics – Hadoop: dashboard with HDFS and YARN metrics – OS host metrics: Collectd, Ganglia – Kubernetes: Prometheus-based monitoring and dashboard 43#UnifiedDataAnalytics #SparkAISummit
  • 44. Notable JIRAs about Metrics • Documentation improvements “Spark monitoring” – Master, SPARK-26890, Add Dropwizard metrics list and configuration details – Spark 2.4.0, SPARK-25170: Add Task Metrics description to the documentation • Master, SPARK-23206 Additional Memory Tuning Metrics – Master, SPARK-29064 Add Prometheus endpoint for executor metrics – WIP, SPARK-27189 Add memory usage metrics to the metrics system • Master, SPARK-28091 Extend Spark metrics system with user- defined metrics using executor plugins • Master, SPARK-28475 Add regex MetricFilter to GraphiteSink • CPU time used by JVM: – Spark 2.4.0: SPARK-25228 Add executor CPU Time metric – Master: SPARK-26928, Add driver CPU Time to the metrics system, • Spark 2.3.0: SPARK-22190 Add Spark executor task metrics to Dropwizard metrics 44#UnifiedDataAnalytics #SparkAISummit
  • 45. Conclusions • Performance troubleshooting by understanding – Spark architecture + Spark instrumentation, Web UI – Spark Task metrics + Listeners, tool: sparkMeasure – Spark Metrics System, tool: Grafana dashboard • Contribute, adopt, share – Instrumentation in Spark ecosystem keeps improving – Solid methodologies and tools are key – Share your results, tools, issues, dashboards.. 45#UnifiedDataAnalytics #SparkAISummit Instrumentation + Context Insights + Actions
  • 46. Acknowledgements • Colleagues at CERN – Hadoop and Spark service, in particular Prasanth Kothuri and Riccardo Castellotti • Thanks to Apache Spark committers and community – Help with JIRAs and PRs • References: – https://github.com/LucaCanali/sparkmeasure – https://db-blog.web.cern.ch/blog/luca-canali/2019-02- performance-dashboard-apache-spark 46#UnifiedDataAnalytics #SparkAISummit
  • 47. DON’T FORGET TO RATE AND REVIEW THE SESSIONS SEARCH SPARK + AI SUMMIT