Automatic_Iperf_Log_Result_Excel_visual_v2.pptx
Download as PPTX, PDF0 likes10 views

This is an automation on how to parse a log data and save result into excel and even draw a line graph. What will you learn: - python reading log - analysis log data and capture tput value - save result into excel - draw graph

![Content
• Case1: parse max throughput, filter [Sum] string
• Case3: parse bidirectional, filter [SUM][RX-C] and [SUM][TX-C]
• Case4: parse both case1 and case2 (more convenient)
• Case7: split large bidirectional logfile into small part by
• Debug: some debug setting
Link:https://github.com/chenchih/5G_automationLinux/tree/main/
Iperflog_parser](https://image.slidesharecdn.com/iperf3logparser-250627092700-449fae04/85/Automatic_Iperf_Log_Result_Excel_visual_v2-pptx-2-320.jpg)

![Understand the log file
• Case1 (Max Throughput) filter [SUM]
• Case4: Bidirectional filter
• [SUM][TX –C]
• [SUM][RX –C]
Filter Tput value
Filter date and time
Will look like this after filter
Filter Tput value
RX
TX](https://image.slidesharecdn.com/iperf3logparser-250627092700-449fae04/85/Automatic_Iperf_Log_Result_Excel_visual_v2-pptx-4-320.jpg)


![Iperf Log Structure
• Iperf command
• iperf3 -c 192.168.1.150 -i 1 -P 48 -t 600 --timestamp --logfile UL_dailyTpt.log
• Filter str: [SUM]
• Log output: will display Gbit](https://image.slidesharecdn.com/iperf3logparser-250627092700-449fae04/85/Automatic_Iperf_Log_Result_Excel_visual_v2-pptx-9-320.jpg)
![Analysis Log file
• Filter these string:
• Date time: datetime
• Filter String:
• [SUM]: UL or DL information
• Throughput Value: Get the throughput value](https://image.slidesharecdn.com/iperf3logparser-250627092700-449fae04/85/Automatic_Iperf_Log_Result_Excel_visual_v2-pptx-10-320.jpg)
![Filter and matching string
• Match [SUM]
• re.match(r"(w{3} w{3}s+d{1,2} d{2}:d{2}:d{2} d{4}) [SUM].*?([d.]+)
(bits|Mbits|Gbits)/sec",line)
• Get the result:
if match:
date_str = match.group(1)
transfer_str = match.group(2)
unit = match.group(3)
Gbit/mbit/bit
Single date](https://image.slidesharecdn.com/iperf3logparser-250627092700-449fae04/85/Automatic_Iperf_Log_Result_Excel_visual_v2-pptx-11-320.jpg)


![Iperf Command with iperf log file
• Iperf client command:
• iperf3 -c 192.168.1.150 -P 32 -t 2400 --bidir -b 36M --timestamp --logfile
iperf3_bidirectional.log
• Filter str: [SUM]
• Log
--timestamp --logfile: will generate log file
--bidir: bidirectional](https://image.slidesharecdn.com/iperf3logparser-250627092700-449fae04/85/Automatic_Iperf_Log_Result_Excel_visual_v2-pptx-16-320.jpg)
![Analysis Log file
• Filter these string:
• Date time: datetime
• Filter String:
• [SUM][TX-C]: UL information
• [SUM][RX-C]: DL information
• Throughput Value: Get the throughput value](https://image.slidesharecdn.com/iperf3logparser-250627092700-449fae04/85/Automatic_Iperf_Log_Result_Excel_visual_v2-pptx-17-320.jpg)
![Filter and matching string
• Match [SUM][RX-C] or [SUM][TX-C]
• re.match(r"(w{3} w{3}s+d{1,2} d{2}:d{2}:d{2} d{4}) [SUM][(RX-C|TX-C)].*?([d.]
+) (bits|Mbits|Gbits)/sec", line_str)
• Get the result:
if match:
date_str = match.group(1)
rx_tx = match.group(2)
transfer_str = match.group(3)
unit = match.group(4)](https://image.slidesharecdn.com/iperf3logparser-250627092700-449fae04/85/Automatic_Iperf_Log_Result_Excel_visual_v2-pptx-18-320.jpg)

![Convert the Unit type to gbit
• Solution is to covert to same unit, since gbit contain the most of it. If match
mbit or gbit then divide by 1000 which will convert to gbit unit type.
• Code:
if unit == "Mbits":
transfer_value /= 1000.0
elif unit == "bits":
transfer_value /= 1000000000.0
if rx_tx == "RX-C":
rx_data.append([formatted_date, transfer_value, "gbps"])
else:
tx_data.append([formatted_date, transfer_value, "gbps"])](https://image.slidesharecdn.com/iperf3logparser-250627092700-449fae04/85/Automatic_Iperf_Log_Result_Excel_visual_v2-pptx-20-320.jpg)

![Case4: Parse Log working
directory
Parse iperf log both [SUM] or [SUM][TX-C] [RX-C]
Source code:
https://github.com/chenchih/5G_automationLinux/tree/main/Iperflog_
parser/4.parse_log_workingdir](https://image.slidesharecdn.com/iperf3logparser-250627092700-449fae04/85/Automatic_Iperf_Log_Result_Excel_visual_v2-pptx-22-320.jpg)


![Step of code
• Step1: check current directory file with .txt or .log file and read it
• Step2: read each file and search for related string
• [SUM]:UL or DL Tput
• [SUM][RX-X] and [SUM][TX-X]: bidirectional Tput
• Step3: analysis the log
• Convert data unit
• save each file into excel sheet rename as log file name
• Save excel
• Calculate duration time (only with log contain [SUM][TX-X] or [RX-C]; bidirectional log)
• Step4: plot date into line graph
• Step5 create a folder and move all your result into folder](https://image.slidesharecdn.com/iperf3logparser-250627092700-449fae04/85/Automatic_Iperf_Log_Result_Excel_visual_v2-pptx-25-320.jpg)


![Read your log file and capture datetime
with open(input_file, 'r', encoding='utf-8', errors='ignore') as
infile:
for line in infile:
if "[SUM]" in line:
match = re.match(r"(w{3} w{3}s+d{1,2} d{2}:
d{2}:d{2} d{4}) [SUM][(RX-C|TX-C)].*?([d.]+) (bits|Mbits|
Gbits)/sec", line)
if match:
print(match.group(1))
else:
print(f"No match found in line: {line.strip()}")
Capture log datetime, and print date time](https://image.slidesharecdn.com/iperf3logparser-250627092700-449fae04/85/Automatic_Iperf_Log_Result_Excel_visual_v2-pptx-44-320.jpg)


Automatic_Iperf_Log_Result_Excel_visual_v2.pptx
- 1. IPerf3 Log Parser How to analysis iperf log tput value By ChenChih, 20250627
- 2. Content • Case1: parse max throughput, filter [Sum] string • Case3: parse bidirectional, filter [SUM][RX-C] and [SUM][TX-C] • Case4: parse both case1 and case2 (more convenient) • Case7: split large bidirectional logfile into small part by • Debug: some debug setting Link:https://github.com/chenchih/5G_automationLinux/tree/main/ Iperflog_parser
- 3. What will you gain or learn • Read and write file using python • Regular expression to capture or filter log • Convert txt file into excel, create sheet in excel • Plot graph base on excel file • Using progress bar to show running status • File management, move result into new folder
- 4. Understand the log file • Case1 (Max Throughput) filter [SUM] • Case4: Bidirectional filter • [SUM][TX –C] • [SUM][RX –C] Filter Tput value Filter date and time Will look like this after filter Filter Tput value RX TX
- 5. Case1: Unidirectional Run one directional either UL or DL Source: https://github.com/chenchih/5G_automationLinux/tree/main/Iperflog_ parser/1.parse_mbit_to_gb_excel
- 6. Description • Need to provide Iperf log file to analysis, and extract the throughput result • Will generate excel file for extract the datetime, and tput value • Will not draw graph, user have to manual draw graph
- 7. Step of code • Step1:Put your elog file example • Step2: Enter your logname (ex: DL_dailyTpt_SFP.log) • Step3: will start to read and analysis your log and save result into excel file.
- 8. Output • Run command: py parse_mbit_to_gb_excel_v3.1.py Enter your log filename Enter for default filename, or enter save file name
- 9. Iperf Log Structure • Iperf command • iperf3 -c 192.168.1.150 -i 1 -P 48 -t 600 --timestamp --logfile UL_dailyTpt.log • Filter str: [SUM] • Log output: will display Gbit
- 10. Analysis Log file • Filter these string: • Date time: datetime • Filter String: • [SUM]: UL or DL information • Throughput Value: Get the throughput value
- 11. Filter and matching string • Match [SUM] • re.match(r"(w{3} w{3}s+d{1,2} d{2}:d{2}:d{2} d{4}) [SUM].*?([d.]+) (bits|Mbits|Gbits)/sec",line) • Get the result: if match: date_str = match.group(1) transfer_str = match.group(2) unit = match.group(3) Gbit/mbit/bit Single date
- 12. Convert the Unit type to gbit • Solution is to covert to same unit, since gbit contain the most of it. If match mbit or gbit then divide by 1000 which will convert to gbit unit type. • Code: if unit == "Mbits": transfer_value /= 1000.0 elif unit == "bits": transfer_value /= 1000000000.0
- 13. Case3:Bidirectional Run Uplink and downlink, and get the result of both value Source code: https://github.com/chenchih/5G_automationLinux/tree/main/Iperflog_ parser/3.parse_bidirectional
- 14. Step of code • Step1:Put your elog file in the same working directory • Step2: Enter your logname (ex: iperf3_bidirectional.log) • Step3: will start to read and analysis your log and save result into excel file. • Step4: create folder and move your result into folder • Step5: calculate the datetime of your logfile for test duration
- 15. Output: capture the iperf log tput and save excel • bidirectional_v3.py Type your iperf bidirectional log
- 16. Iperf Command with iperf log file • Iperf client command: • iperf3 -c 192.168.1.150 -P 32 -t 2400 --bidir -b 36M --timestamp --logfile iperf3_bidirectional.log • Filter str: [SUM] • Log --timestamp --logfile: will generate log file --bidir: bidirectional
- 17. Analysis Log file • Filter these string: • Date time: datetime • Filter String: • [SUM][TX-C]: UL information • [SUM][RX-C]: DL information • Throughput Value: Get the throughput value
- 18. Filter and matching string • Match [SUM][RX-C] or [SUM][TX-C] • re.match(r"(w{3} w{3}s+d{1,2} d{2}:d{2}:d{2} d{4}) [SUM][(RX-C|TX-C)].*?([d.] +) (bits|Mbits|Gbits)/sec", line_str) • Get the result: if match: date_str = match.group(1) rx_tx = match.group(2) transfer_str = match.group(3) unit = match.group(4)
- 19. Convert the Unit type to gbit • If you notice iperf log, some throughput will occur gbit, mbit, or even bit. If you plot graph, the unit is inconsistency will make the graph look incorrect.
- 20. Convert the Unit type to gbit • Solution is to covert to same unit, since gbit contain the most of it. If match mbit or gbit then divide by 1000 which will convert to gbit unit type. • Code: if unit == "Mbits": transfer_value /= 1000.0 elif unit == "bits": transfer_value /= 1000000000.0 if rx_tx == "RX-C": rx_data.append([formatted_date, transfer_value, "gbps"]) else: tx_data.append([formatted_date, transfer_value, "gbps"])
- 21. Extend Feature: plot data from excel # --- Create Plot --- fig, ax = plt.subplots(figsize=(18, 8)) # Use subplots for more control, slightly wider figsize # Plot data ax.plot(times, tput, label=f'{direction_label} Throughput (gbps)', marker='', linestyle='-', markersize=5) # Set Title and Labels with increased font size ax.set_title(f'{direction_label} Throughput', fontsize=16) ax.set_xlabel("Time", fontsize=14) ax.set_ylabel("Throughput (gbps)", fontsize=14) # --- Y-axis Limits --- ax.set_ylim(bottom=0) # Set the lower limit of the y-axis to 0 ax.xaxis.set_major_locator(mdates.MinuteLocator(interval=30)) # Minute Intervals, ax.xaxis.set_major_formatter(mdates.DateFormatter('%Y%m%d_%H:%M:%S')) # Multi-line format # Increase tick label size and rotate plt.setp(ax.get_xticklabels(), rotation=90, ha='right', fontsize=12) plt.setp(ax.get_yticklabels(), fontsize=12) # Adjust layout to prevent labels overlapping fig.tight_layout() plt.savefig(output_image_file, dpi=300) # Save the plot (dpi for resolution)
- 22. Case4: Parse Log working directory Parse iperf log both [SUM] or [SUM][TX-C] [RX-C] Source code: https://github.com/chenchih/5G_automationLinux/tree/main/Iperflog_ parser/4.parse_log_workingdir
- 23. Description • This script will help you parse both bidirectional or unidirectional iperf log file. Essential as long as you put .log or .txt it will help you filter the tput value • No need to type your logfile • It will also help you plot graph • This is all in one script help you do everything. Unlike previous two example will analysis individual • Note: Excel sheet will use your iperf log file name
- 24. Feature • Allow to check all iperf log either max tput or bidirectional (verson1) • Iperf log file name will be your excel sheet name • Allow user to add y axis in case future you performance is more than 5 Gb you can adjust your graph axis (version2) • Implement average of throughput( version3.1) • Improvement average throughput- add threshold to compare. Iperf log name will determine which test item you test and able to compare average threshold and display pass fail criteria (version 3.2)
- 25. Step of code • Step1: check current directory file with .txt or .log file and read it • Step2: read each file and search for related string • [SUM]:UL or DL Tput • [SUM][RX-X] and [SUM][TX-X]: bidirectional Tput • Step3: analysis the log • Convert data unit • save each file into excel sheet rename as log file name • Save excel • Calculate duration time (only with log contain [SUM][TX-X] or [RX-C]; bidirectional log) • Step4: plot date into line graph • Step5 create a folder and move all your result into folder
- 26. V3.2 display_average_using_input • Feature: • Implement user add threshold average to compare base on different condition base on iperflog file. Log file name must contain: • Bidirectional tput: log file name must contain these string • SFP or POE (max TPT) Iperf log Filename threshold bidirectional-poe or bi-poe >= 1.1 PASS bidirectional-sfp or bi-sfp >= 1.7 PASS bidirectional >= 1.1 PASS Iperf log Filename threshold poe >= 2.5 PASS sfp >= 3.5 PASS IPERF log file will check the threshold
- 27. The throughput manual test value • SFP max throughput (unidirectional) will reach about 3.5~4GB • POE max throughput (unidirectional) will reach about 2.5Gb • POE Bidirectional: will reach about 1.1 GB • SFP Bidirectional: will reach about 1.7 GB • In this script which allow to put max throughput log, and bidirectional log file. But if you want to compare the pass fail criterial then you need to compare your test item with the value. So in this case I use the log file as my test item to compare the average • POE or SFP : these keyword will be Max TPT • Bidirectional keyword: • bidirectional or bi-poe or bidirectional-poe: either of keyword mean bidirectional poe • bidirectional-sfp or bi-sfp: either of keyword mean bidirectional sfp
- 28. V3.2: output Compare with log file name Example: • file contain bidirectional-poe or bidirectional or bi-poe: average threshold will be 1.1. if less than it Fail • file contain poe: average will be 2.5 less than it fail • file contain sfp: average will be 3.5 less than it fail
- 29. V3.2: Code condition compare threshold
- 30. V3.1 average implement average tput • Implement average line to check the average performance, below the red line is the average
- 31. V3.1 flexibility of y axis and x axis tick • Allow user to adjust flexible y axis. This will be useful in future if your performance can reach more than 4gb and can adjust gap of graph. Y axis , support axis range Enter to use the default value User enter range of y axis control TPT axis. You cam leave empty to use default 0 as min, 5 as max
- 32. V3.1 flexible y axis • Original • Change: adjust user enter y axis for max and min
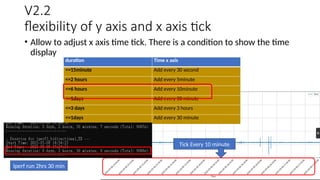
- 33. V2.2 flexibility of y axis and x axis tick • Allow to adjust x axis time tick. There is a condition to show the time display duration Time x axis <=15minute Add every 30 second <=2 hours Add every 5minute <=6 hours Add every 10minute <=1days Add every 30 minute <=3 days Add every 3 hours <=1days Add every 30 minute Tick Every 10 minute Iperf run 2hrs 30 min
- 34. V2.2 • I have set some setting with the x axis datetime with this condition: • duration <=5 minute: set interval as 5 second • duration <=15 minute: set interval as 30 second • duration <=30 minute: set interval as 1 minute • duration <=2 hours: set interval as 5 minute • duration <=6 hours: set interval as 10 minute • duration <=1 day: set interval as 30 minute Duration 15 minute, Interval as 15 second
- 35. V2.2 flexibility of y axis and x axis tick • Code for condition y axis tick
- 36. Calculate time duration only bidirectional log
- 37. Logfile and excel sheet output • Run command: py parse_alllog_excelSheet_plot_v3.py All result put in this directory each sheet place each result Output result
- 38. Case7 Split_LargeFile_smallFile Split large logfile to multiple file for reading Source: https://github.com/chenchih/5G_automationLinux/tree/main/Iperflog_ parser/7.Split_LargeFile_smallFile
- 39. Description • This feature is only if you want to split a large file into smaller. For example if you run bidirectional for over weekend about 3-4 days then the log file will be about more than 2 gb. Text edior might not be able to open( notepad++ only support 2~3gb) then you need to use my script. • I will split into N line, into smaller file, then you can open by text edior
- 40. Split line Enter split line, Default 4000000 Write line into txt file
- 42. Debug tool Some tool for debug while using manual parsing
- 43. Covert date and time to specific format • Script Name: convertdateFormat.py • Datedata.txt: copy your datetime into this file like below Datedata.txt Ouput.txt
- 44. Read your log file and capture datetime with open(input_file, 'r', encoding='utf-8', errors='ignore') as infile: for line in infile: if "[SUM]" in line: match = re.match(r"(w{3} w{3}s+d{1,2} d{2}: d{2}:d{2} d{4}) [SUM][(RX-C|TX-C)].*?([d.]+) (bits|Mbits| Gbits)/sec", line) if match: print(match.group(1)) else: print(f"No match found in line: {line.strip()}") Capture log datetime, and print date time
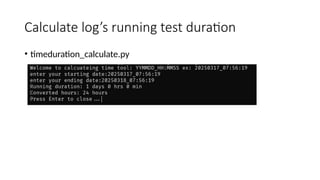
- 45. Calculate log’s running test duration • timeduration_calculate.py
- 47. Additional Note • Build python to executable • window • pyinstaller --onefile --icon=sheet.ico .parse_alllog_excelSheet_plot_v3.1.py • Linux : • pyinstaller --onefile parse_alllog_excelSheet_plot_v3.1.py • Icon download(window): • https://www.flaticon.com/free-icon
- 48. Thank you !!!