SlideShare a Scribd company logo
Guy Lansley
Department of Geography, UCL
g.lansley@ucl.ac.uk
@GuyLansley
GIS for Social Data and Crisis Mapping
University of Kent, Canterbury
9th September 2016
Using R to Visualize Spatial Data:
R as a GIS
What is a Geographic Information System?
• Geographic – relates to a specific place on or in
relation to the Earth’s surface
• Information – is data to which some value or
interpretation has been added. In GI, the
information relates to measurements, maps,
images, sounds etc. of the Earth’s surface
• System – a system designed to perform a wide
range of functions on and with GI
• Although GISystems have developed greatly over
the past fifty years, their underlying principles
have remained the same
GIS
How do we visualise spatial data?
• Layers in a GIS
Top
Bottom
How do we visualise spatial data?
• Layers
Top
Bottom
How do we visualise spatial data?
• E.g.
Top
Bottom
Maps are models of reality
• Models are
generalisations of reality
• Visualisations will
determine what is
represented
• It is therefore easy to
misrepresent
Monmonier (1996) How to lie with maps
Popular Open Software
• For analysing data
– R - www.r-project.org and RStudio - www.rstudio.com
– Python www.python.org and Jupyter - www.jupyter.org
• Databases
– PostgreSQL - www.postgresql.org & PostGIS -
www.postgis.net
• Geographic information systems
– QGIS - www.qgis.org
QGIS
• A fully functional open
source GIS
• Fantastical visualization
capacities
• An excellent alternative to
ArcMap
R and Rstudio
Advantages
• It is fast
• It is open source
• It is a well developed, simple and effective
programming language
• Lots of people use it- New York Times, Google,
Facebook, Ebay, University Researchers, etc….
• It can do anything you want it to (almost)
• It interfaces to other software very easily
• Can also call functions from other programming
languages (including SQL, Python, Java and many
more)
• It now has a large user community with lots of support
and documentation
www.rstudio.com
www.r-project.org
Features of R
• Command line interface.
• Object oriented.
– You create things with names
using the “<-” symbol.
• Ten <- 5*2
• Two <- Ten/5
• Write a script of functions.
• The standard installation has
relatively few functions but more
have been made available via
open source downloadable
packages
R Scripts Workspace
Console
Multi-tab
(includes plots)
• Can also be run through
Rstudio which provides a
more user friendly GUI
Visualisations in R
AverageHousePrice
Distance from London
% change in the last
12 months
Data: www.hometrack.com/uk/insight/uk-cities-house-price-index & Google Maps
• There are lots of options to improve
the visualisation of data on a plot,
such as proportional symbols,
colouring, 3D plotting, trend lines.
Size = Population (2011
Census)
+
-
Why should we make maps with code?
It’s Easy
GIS packages make coding
maps easier than ever
before
Importing Data in R
• Load a CSV of data
• Load shapefile
• Merge shapefile and CSV data, set projection
Loading in spatial data is straight forward
Mapping in R
• There are several different packages which
provide good functionality for visualising spatial
data in R
• E.g.
– ggplot2 – Graphing package implemented on top of the R
statistical package.
– tmap – This package offers a flexible, layer-based, and easy to
use approach to create thematic maps, such as choropleths and
bubble maps.
– And many more…
The ggplot2 package
• ggplot2 is a plotting system for R, based on the
grammar of graphics, which uses base and lattice
graphics.
• Excellent for plots but also includes functionality for
mapping
Based on: Wilkinson, L., 2006. The grammar of graphics. Springer Science & Business Media.
The tmap package
• A package which allows you to create and
customise thematic maps quickly and clearly
• The API broadly resembles that of ggplot2 but is a
bit less fiddly.
Based on: Wickham, H., 2010. A layered grammar of graphics. Journal of Computational and Graphical
Statistics, 19(1), pp.3-28.
The tmap package
Shapefile Variable
The tmap package
Colour ramp
The tmap package
Intervals
The tmap package
Legend title
The tmap package
Shapefile borders
The tmap package
Compass
The tmap package
Layout options
Lots of packages for mapping
• Maptools - Set of tools for manipulating and reading geographic data, in particular ESRI
shapefiles
• Maps - Display of maps. Projection code and larger maps are in separate packages
• Sp - Classes and methods for spatial data; the classes document where the spatial location
information resides, for 2D or 3D data.
• Rgdal - Provides bindings to Frank Warmerdam's Geospatial Data Abstraction Library (GDAL)
and access to projection/transformation operations from the PROJ.4 library
R and Mapping
Created by James Cheshire
Functionality
Many packages in R allow
you to utilise the spatial
analysis functions of a
standard GIS. It is also
possible to apply several
customisations to some
functions
Functions
• There are a range of specialised packages which
provide spatial analysis functions in R
• These include…
Using geometries
• rgeos – opens up a range of functions which use
geometries
– including buffers, unions and distance calculation
Spatial Dependence
• Spdep – functions to create spatial weights matrix
objects and therefore a range of packages for
measuring spatial clustering
– including global Moran’s I and Getis-Ord
Spatial Interpolation
• Inverse Distance Weighting
– gstat package - Spatial and Spatio-Temporal
Geostatistical Modelling, Prediction and Simulation
Data: People of the British Isles Project
Courtesy Jens Kandt, UCL
isonymy
Data: People of the British Isles Project
Courtesy Jens Kandt, UCL
3D visualisaton
• This example is interactive too!
Big Data
Data is getting larger and
more complex. Coding
methods can take
advantages of new
database techniques
Big Datasets in R
There are various techniques in R which can be
used to handle very large data. Such as:
• The ability to split and loop data and functions
• Parallel processing
• The ability to work via remote servers
• Integration with higher performing programming
languages or languages purposed for database
management (i.e. SQL)
Mapping Flows in R
Data from spatial.ly/2015/03/mapping-flows/
Complex data
Chord Diagram, created
using the circlize
package
Consistency
It is easy to replicate your
styles, frames and
projections once they have
been developed the first
time. This can save you
hours of work in the long
run and make the
presentation of figures
consistent.
Data source: Greater London Authority
Facetted Maps in ggplot2
– Ggplot2 package - An
implementation of the
grammar of graphics in
R
Reusing code
You can reuse your saved
map code if you are happy
with the outputs
You can run it again with
any new data
Automation
It is also possible to reduce
man-hours spent making
duplicate maps by
automating code
2011 Open Atlas Project
• A manual map might
typically take 5 minutes
to create - thus:
– 5 minutes X 134,567
maps = 672,835 minutes
– Or 467.2 days (no
breaks!)
www.alex-singleton.com
• Produced by Prof. Alex Singleton (CDRC, University of
Liverpool)
• R was used to automate the production of 134,567 into a
collection of PDF atlases
• This included downloading and formatting the data from the
ONS websites
2011 Open Atlas Project
• Code available here:
rpubs.com/alexsingleton/openatlas
• E.g. Step 1: Download the data
E.g. archive =
http://www.nomisweb.co.uk/output/census/2011/ks101ew_2011_oa.zip
The Transport Map Book
• Another automated output from Alex Singleton
• Includes data on transport such as travel flows to
work, accessibility to services, CO2 emissions, etc…
• Stages
• Data Import
• Data Prep
• Create Maps
• Flow Maps
• WZ Maps
• OA Maps
• LSOA Maps
• LSOA CO2 Maps
• Latex – output document
• Code available from:
github.com/alexsingleton/Transport-Map-Book
Interactive outputs
Make sharing information
easier through the creation
of interactive widgets
Creating Webmaps with googleVis
• Using UN data on child Labour
http://data.un.org/Data.aspx?d=S
OWC&f=inID%3A86
• A couple of short lines of code will
create an interactive map in your
internet browser
Shiny in R
• Shiny combines the computational power of R with the interactivity of
the modern web
• Build useful web applications with only a few lines of code—no
JavaScript required
• Shiny user interfaces can be built entirely using R, or can be written
directly in HTML, CSS, and JavaScript for more flexibility.
• Attractive default UI theme based on Twitter Bootstrap -
twitter.github.com/bootstrap
• Tutorial available here: http://rstudio.github.io/shiny/tutorial/
blog.snap.uaf.edu
• For more examples visit:
shiny.rstudio.com/gallery
shiny.rstudio.com
A Basic Shiny App
ui.R server.R
A Basic Shiny Map
ui.R server.R
Population density (2011 Census)
The Power of Shiny
• Why Shiny?
– All the power of R in the browser
– Rapid development of applications
– Limited requirement for new skills
– With a bit of knowledge of HTML, widgets can be very
easily embedded on websites
There is also the leaflet package for creating
interactive “slippy” web-maps.
github.com/majerus/globe
Summary
• Although it may entail a steep learning curve, there are
some obvious advantages of handling spatial data in R
• These include:
– R’s advanced functionality, particularly due to the large
range of bespoke packages which are now available
– The relative simplicity of some functions with lots of
customisations options
– The ability to handle large volumes of data of many
different formats
– The possibility of using code to automate analysis and
visualizations
– The functionality to produce interactive outputs
Guy Lansley
Department of Geography, UCL
g.lansley@ucl.ac.uk
@GuyLansley
Ad

Recommended

PPTX
WEB GIS AND WEB MAP.pptx
Asim Pt
 
PPT
History of GIS
Walter Simonazzi
 
PPTX
Introduction to ArcGIS
Kate Dougherty
 
PPTX
History of gis
Ehtisham Wajid
 
PDF
Introduction to GIS
Joey Li
 
PDF
Four data models in GIS
Prof. A.Balasubramanian
 
PDF
Arc gis introduction-ppt
Ashok Peddi
 
PPTX
Map algebra
Ehsan Hamzei
 
PDF
Spatial Data Science with R
amsantac
 
PPTX
Gis powerpoint
kaushdave
 
PPT
Gis (geographic information system)
Saad Bare
 
PDF
What is web gis
olivier bissemb
 
PPTX
GIS User to Web-GIS Developer Journey
Tek Kshetri
 
PPTX
Remote Sensing: Principal Component Analysis
Kamlesh Kumar
 
PDF
Introduction to Open Source GIS
SANGHEE SHIN
 
PPT
Open Source GIS
Joe Larson
 
PPTX
Geographical information system
Bipin Karki
 
PPTX
Spatial analysis & interpolation in ARC GIS
KU Leuven
 
PPT
Digital Cartography
Patrick Woessner
 
PPT
Basics to gis concepts unit i
H.M College of science and technology, Manjeri
 
PPT
Geodatabases
John Reiser
 
PPTX
DATA in GIS and DATA Query
KU Leuven
 
PPTX
Land use cover pptx.
PratikRamteke4
 
PPTX
Remote Sensing - Fundamentals
Ajay Singh Lodhi
 
PPT
gis
yaesh
 
PDF
Spatial Data Model
Kaium Chowdhury
 
PPT
GIS presentation
arniontech
 
PDF
Digital Soil Mapping steps
FAO
 
PPT
R Spatial Analysis using SP
tjagger
 
PDF
Maps with leafletR
Michele Tobias
 

More Related Content

What's hot (20)

PDF
Spatial Data Science with R
amsantac
 
PPTX
Gis powerpoint
kaushdave
 
PPT
Gis (geographic information system)
Saad Bare
 
PDF
What is web gis
olivier bissemb
 
PPTX
GIS User to Web-GIS Developer Journey
Tek Kshetri
 
PPTX
Remote Sensing: Principal Component Analysis
Kamlesh Kumar
 
PDF
Introduction to Open Source GIS
SANGHEE SHIN
 
PPT
Open Source GIS
Joe Larson
 
PPTX
Geographical information system
Bipin Karki
 
PPTX
Spatial analysis & interpolation in ARC GIS
KU Leuven
 
PPT
Digital Cartography
Patrick Woessner
 
PPT
Basics to gis concepts unit i
H.M College of science and technology, Manjeri
 
PPT
Geodatabases
John Reiser
 
PPTX
DATA in GIS and DATA Query
KU Leuven
 
PPTX
Land use cover pptx.
PratikRamteke4
 
PPTX
Remote Sensing - Fundamentals
Ajay Singh Lodhi
 
PPT
gis
yaesh
 
PDF
Spatial Data Model
Kaium Chowdhury
 
PPT
GIS presentation
arniontech
 
PDF
Digital Soil Mapping steps
FAO
 
Spatial Data Science with R
amsantac
 
Gis powerpoint
kaushdave
 
Gis (geographic information system)
Saad Bare
 
What is web gis
olivier bissemb
 
GIS User to Web-GIS Developer Journey
Tek Kshetri
 
Remote Sensing: Principal Component Analysis
Kamlesh Kumar
 
Introduction to Open Source GIS
SANGHEE SHIN
 
Open Source GIS
Joe Larson
 
Geographical information system
Bipin Karki
 
Spatial analysis & interpolation in ARC GIS
KU Leuven
 
Digital Cartography
Patrick Woessner
 
Basics to gis concepts unit i
H.M College of science and technology, Manjeri
 
Geodatabases
John Reiser
 
DATA in GIS and DATA Query
KU Leuven
 
Land use cover pptx.
PratikRamteke4
 
Remote Sensing - Fundamentals
Ajay Singh Lodhi
 
gis
yaesh
 
Spatial Data Model
Kaium Chowdhury
 
GIS presentation
arniontech
 
Digital Soil Mapping steps
FAO
 

Viewers also liked (20)

PPT
R Spatial Analysis using SP
tjagger
 
PDF
Maps with leafletR
Michele Tobias
 
ODP
Geospatial Data in R
Barry Rowlingson
 
PDF
Spatial Analysis with R - the Good, the Bad, and the Pretty
Noam Ross
 
PPTX
R programming language in spatial analysis
Abhiram Kanigolla
 
PPTX
New analytical methods for geocomputation - Guy Lansley, UCL
Guy Lansley
 
PPTX
Linking Socio-economic and Demographic Characteristics to Twitter Topics - Gu...
Guy Lansley
 
PPTX
The CDRC Masters Research Dissertation Programme
Guy Lansley
 
PPTX
The geography of topics from geo-referenced social media data in London - Guy...
Guy Lansley
 
PPTX
The CDRC Masters Research Dissertation Programme - Call for Sponsors
Guy Lansley
 
PDF
QGIS & Inkscape: Carographic Tools for Attractive Maps
Michele Tobias
 
PPTX
Creating an Output Area Classification of Cultural and Ethnic Heritage
Guy Lansley
 
PDF
Exploring the geography of the registered addresses of car models through a b...
Guy Lansley
 
PDF
Modeling Count-based Raster Data with ArcGIS and R
Azavea
 
PPTX
Data Visualization Tips & Tricks
KoenVerbeeck
 
PDF
Using R for Climate Raster Data Extraction
Michele Tobias
 
PPTX
Text and Data Visualization Introduction 2012
Treparel
 
PDF
Inkscape cartography
Michele Tobias
 
PPTX
Dr Richard Fry - Using R as a GIS
Shaun Lewis
 
PPTX
How to use Frequency Ratio with ArcMap and Excel for prediction
Omar F. Althuwaynee
 
R Spatial Analysis using SP
tjagger
 
Maps with leafletR
Michele Tobias
 
Geospatial Data in R
Barry Rowlingson
 
Spatial Analysis with R - the Good, the Bad, and the Pretty
Noam Ross
 
R programming language in spatial analysis
Abhiram Kanigolla
 
New analytical methods for geocomputation - Guy Lansley, UCL
Guy Lansley
 
Linking Socio-economic and Demographic Characteristics to Twitter Topics - Gu...
Guy Lansley
 
The CDRC Masters Research Dissertation Programme
Guy Lansley
 
The geography of topics from geo-referenced social media data in London - Guy...
Guy Lansley
 
The CDRC Masters Research Dissertation Programme - Call for Sponsors
Guy Lansley
 
QGIS & Inkscape: Carographic Tools for Attractive Maps
Michele Tobias
 
Creating an Output Area Classification of Cultural and Ethnic Heritage
Guy Lansley
 
Exploring the geography of the registered addresses of car models through a b...
Guy Lansley
 
Modeling Count-based Raster Data with ArcGIS and R
Azavea
 
Data Visualization Tips & Tricks
KoenVerbeeck
 
Using R for Climate Raster Data Extraction
Michele Tobias
 
Text and Data Visualization Introduction 2012
Treparel
 
Inkscape cartography
Michele Tobias
 
Dr Richard Fry - Using R as a GIS
Shaun Lewis
 
How to use Frequency Ratio with ArcMap and Excel for prediction
Omar F. Althuwaynee
 
Ad

Similar to Using R to Visualize Spatial Data: R as GIS - Guy Lansley (20)

PDF
Be Location Intelligent with MapInfo Pro v2019
Peter Horsbøll Møller
 
PDF
Agi08 Jeremy Morley
Jeremy Morley
 
PPTX
Mapinfo 2014
GeoMedeelel
 
PDF
An R primer for SQL folks
Thomas Hütter
 
PDF
Open Source GIS Workshop
Jason Dalton
 
PDF
1 mapreduce-fest
Genoveva Vargas-Solar
 
PPT
Map reducecloudtech
Jakir Hossain
 
PPTX
Intro GIS.pptx
SamiDan2
 
PDF
Essentials of R
ExternalEvents
 
PDF
Web Mapping with Drupal
Ranel Padon
 
PDF
GIS Orientation 2015
DUSPviz
 
PDF
Mapping
David Trengove
 
PPTX
c,c++,java and python in gis development
Sakthivel R
 
PPTX
Q GIS Training Presentation
Shahid Imran Khan
 
PPTX
MapInfo Professional 12.5 and Discover3D 2014 - A brief overview
Prakher Hajela Saxena
 
PDF
The recovery of netherlands geographic information system (nlgis 2)
vty
 
PPTX
design_doc
Aman Gill
 
PPTX
Tb geo dev_presentation_nov_5
Todd Barr
 
PPTX
Geological information system updated.pptx
karmveerthakur100
 
PPTX
Getting your Data Out There: An Introduction to Distributed GIS
John Reiser
 
Be Location Intelligent with MapInfo Pro v2019
Peter Horsbøll Møller
 
Agi08 Jeremy Morley
Jeremy Morley
 
Mapinfo 2014
GeoMedeelel
 
An R primer for SQL folks
Thomas Hütter
 
Open Source GIS Workshop
Jason Dalton
 
1 mapreduce-fest
Genoveva Vargas-Solar
 
Map reducecloudtech
Jakir Hossain
 
Intro GIS.pptx
SamiDan2
 
Essentials of R
ExternalEvents
 
Web Mapping with Drupal
Ranel Padon
 
GIS Orientation 2015
DUSPviz
 
c,c++,java and python in gis development
Sakthivel R
 
Q GIS Training Presentation
Shahid Imran Khan
 
MapInfo Professional 12.5 and Discover3D 2014 - A brief overview
Prakher Hajela Saxena
 
The recovery of netherlands geographic information system (nlgis 2)
vty
 
design_doc
Aman Gill
 
Tb geo dev_presentation_nov_5
Todd Barr
 
Geological information system updated.pptx
karmveerthakur100
 
Getting your Data Out There: An Introduction to Distributed GIS
John Reiser
 
Ad

Recently uploaded (20)

PPTX
NASA ESE Study Results v4 05.29.2020.pptx
CiroAlejandroCamacho
 
PPTX
Flextronics Employee Safety Data-Project-2.pptx
kilarihemadri
 
PDF
Informatics Market Insights AI Workforce.pdf
karizaroxx
 
PPTX
PPT2 W1L2.pptx.........................................
palicteronalyn26
 
PPTX
Communication_Skills_Class10_Visual.pptx
namanrastogi70555
 
PPTX
UPS and Big Data intro to Business Analytics.pptx
sanjum5582
 
PDF
Predicting Titanic Survival Presentation
praxyfarhana
 
PDF
presentation4.pdf Intro to mcmc methodss
SergeyTsygankov6
 
PPTX
最新版美国约翰霍普金斯大学毕业证(JHU毕业证书)原版定制
Taqyea
 
PPT
Camuflaje Tipos Características Militar 2025.ppt
e58650738
 
PPT
Reliability Monitoring of Aircrfat commerce
Rizk2
 
PPSX
PPT1_CB_VII_CS_Ch3_FunctionsandChartsinCalc.ppsx
animaroy81
 
PPTX
英国毕业证范本利物浦约翰摩尔斯大学成绩单底纹防伪LJMU学生证办理学历认证
taqyed
 
PPTX
最新版美国佐治亚大学毕业证(UGA毕业证书)原版定制
Taqyea
 
PPTX
定制OCAD学生卡加拿大安大略艺术与设计大学成绩单范本,OCAD成绩单复刻
taqyed
 
PDF
Shifting Focus on AI: How it Can Make a Positive Difference
1508 A/S
 
PPTX
Crafting-Research-Recommendations Grade 12.pptx
DaryllWhere
 
PPTX
RESEARCH-FINAL-GROUP-3, about the final .pptx
gwapokoha1
 
PPTX
最新版意大利米兰大学毕业证(UNIMI毕业证书)原版定制
taqyea
 
PPTX
Presentation by Tariq & Mohammed (1).pptx
AbooddSandoqaa
 
NASA ESE Study Results v4 05.29.2020.pptx
CiroAlejandroCamacho
 
Flextronics Employee Safety Data-Project-2.pptx
kilarihemadri
 
Informatics Market Insights AI Workforce.pdf
karizaroxx
 
PPT2 W1L2.pptx.........................................
palicteronalyn26
 
Communication_Skills_Class10_Visual.pptx
namanrastogi70555
 
UPS and Big Data intro to Business Analytics.pptx
sanjum5582
 
Predicting Titanic Survival Presentation
praxyfarhana
 
presentation4.pdf Intro to mcmc methodss
SergeyTsygankov6
 
最新版美国约翰霍普金斯大学毕业证(JHU毕业证书)原版定制
Taqyea
 
Camuflaje Tipos Características Militar 2025.ppt
e58650738
 
Reliability Monitoring of Aircrfat commerce
Rizk2
 
PPT1_CB_VII_CS_Ch3_FunctionsandChartsinCalc.ppsx
animaroy81
 
英国毕业证范本利物浦约翰摩尔斯大学成绩单底纹防伪LJMU学生证办理学历认证
taqyed
 
最新版美国佐治亚大学毕业证(UGA毕业证书)原版定制
Taqyea
 
定制OCAD学生卡加拿大安大略艺术与设计大学成绩单范本,OCAD成绩单复刻
taqyed
 
Shifting Focus on AI: How it Can Make a Positive Difference
1508 A/S
 
Crafting-Research-Recommendations Grade 12.pptx
DaryllWhere
 
RESEARCH-FINAL-GROUP-3, about the final .pptx
gwapokoha1
 
最新版意大利米兰大学毕业证(UNIMI毕业证书)原版定制
taqyea
 
Presentation by Tariq & Mohammed (1).pptx
AbooddSandoqaa
 

Using R to Visualize Spatial Data: R as GIS - Guy Lansley

  • 1. Guy Lansley Department of Geography, UCL [email protected] @GuyLansley GIS for Social Data and Crisis Mapping University of Kent, Canterbury 9th September 2016 Using R to Visualize Spatial Data: R as a GIS
  • 2. What is a Geographic Information System? • Geographic – relates to a specific place on or in relation to the Earth’s surface • Information – is data to which some value or interpretation has been added. In GI, the information relates to measurements, maps, images, sounds etc. of the Earth’s surface • System – a system designed to perform a wide range of functions on and with GI • Although GISystems have developed greatly over the past fifty years, their underlying principles have remained the same GIS
  • 3. How do we visualise spatial data? • Layers in a GIS Top Bottom
  • 4. How do we visualise spatial data? • Layers Top Bottom
  • 5. How do we visualise spatial data? • E.g. Top Bottom
  • 6. Maps are models of reality • Models are generalisations of reality • Visualisations will determine what is represented • It is therefore easy to misrepresent Monmonier (1996) How to lie with maps
  • 7. Popular Open Software • For analysing data – R - www.r-project.org and RStudio - www.rstudio.com – Python www.python.org and Jupyter - www.jupyter.org • Databases – PostgreSQL - www.postgresql.org & PostGIS - www.postgis.net • Geographic information systems – QGIS - www.qgis.org
  • 8. QGIS • A fully functional open source GIS • Fantastical visualization capacities • An excellent alternative to ArcMap
  • 9. R and Rstudio Advantages • It is fast • It is open source • It is a well developed, simple and effective programming language • Lots of people use it- New York Times, Google, Facebook, Ebay, University Researchers, etc…. • It can do anything you want it to (almost) • It interfaces to other software very easily • Can also call functions from other programming languages (including SQL, Python, Java and many more) • It now has a large user community with lots of support and documentation www.rstudio.com www.r-project.org
  • 10. Features of R • Command line interface. • Object oriented. – You create things with names using the “<-” symbol. • Ten <- 5*2 • Two <- Ten/5 • Write a script of functions. • The standard installation has relatively few functions but more have been made available via open source downloadable packages R Scripts Workspace Console Multi-tab (includes plots) • Can also be run through Rstudio which provides a more user friendly GUI
  • 11. Visualisations in R AverageHousePrice Distance from London % change in the last 12 months Data: www.hometrack.com/uk/insight/uk-cities-house-price-index & Google Maps • There are lots of options to improve the visualisation of data on a plot, such as proportional symbols, colouring, 3D plotting, trend lines. Size = Population (2011 Census) + -
  • 12. Why should we make maps with code?
  • 13. It’s Easy GIS packages make coding maps easier than ever before
  • 14. Importing Data in R • Load a CSV of data • Load shapefile • Merge shapefile and CSV data, set projection Loading in spatial data is straight forward
  • 15. Mapping in R • There are several different packages which provide good functionality for visualising spatial data in R • E.g. – ggplot2 – Graphing package implemented on top of the R statistical package. – tmap – This package offers a flexible, layer-based, and easy to use approach to create thematic maps, such as choropleths and bubble maps. – And many more…
  • 16. The ggplot2 package • ggplot2 is a plotting system for R, based on the grammar of graphics, which uses base and lattice graphics. • Excellent for plots but also includes functionality for mapping Based on: Wilkinson, L., 2006. The grammar of graphics. Springer Science & Business Media.
  • 17. The tmap package • A package which allows you to create and customise thematic maps quickly and clearly • The API broadly resembles that of ggplot2 but is a bit less fiddly. Based on: Wickham, H., 2010. A layered grammar of graphics. Journal of Computational and Graphical Statistics, 19(1), pp.3-28.
  • 25. Lots of packages for mapping • Maptools - Set of tools for manipulating and reading geographic data, in particular ESRI shapefiles • Maps - Display of maps. Projection code and larger maps are in separate packages • Sp - Classes and methods for spatial data; the classes document where the spatial location information resides, for 2D or 3D data. • Rgdal - Provides bindings to Frank Warmerdam's Geospatial Data Abstraction Library (GDAL) and access to projection/transformation operations from the PROJ.4 library R and Mapping Created by James Cheshire
  • 26. Functionality Many packages in R allow you to utilise the spatial analysis functions of a standard GIS. It is also possible to apply several customisations to some functions
  • 27. Functions • There are a range of specialised packages which provide spatial analysis functions in R • These include…
  • 28. Using geometries • rgeos – opens up a range of functions which use geometries – including buffers, unions and distance calculation
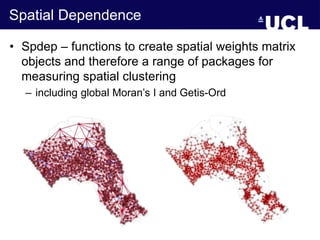
  • 29. Spatial Dependence • Spdep – functions to create spatial weights matrix objects and therefore a range of packages for measuring spatial clustering – including global Moran’s I and Getis-Ord
  • 30. Spatial Interpolation • Inverse Distance Weighting – gstat package - Spatial and Spatio-Temporal Geostatistical Modelling, Prediction and Simulation Data: People of the British Isles Project Courtesy Jens Kandt, UCL isonymy Data: People of the British Isles Project Courtesy Jens Kandt, UCL
  • 31. 3D visualisaton • This example is interactive too!
  • 32. Big Data Data is getting larger and more complex. Coding methods can take advantages of new database techniques
  • 33. Big Datasets in R There are various techniques in R which can be used to handle very large data. Such as: • The ability to split and loop data and functions • Parallel processing • The ability to work via remote servers • Integration with higher performing programming languages or languages purposed for database management (i.e. SQL)
  • 34. Mapping Flows in R Data from spatial.ly/2015/03/mapping-flows/
  • 35. Complex data Chord Diagram, created using the circlize package
  • 36. Consistency It is easy to replicate your styles, frames and projections once they have been developed the first time. This can save you hours of work in the long run and make the presentation of figures consistent.
  • 37. Data source: Greater London Authority Facetted Maps in ggplot2 – Ggplot2 package - An implementation of the grammar of graphics in R
  • 38. Reusing code You can reuse your saved map code if you are happy with the outputs You can run it again with any new data
  • 39. Automation It is also possible to reduce man-hours spent making duplicate maps by automating code
  • 40. 2011 Open Atlas Project • A manual map might typically take 5 minutes to create - thus: – 5 minutes X 134,567 maps = 672,835 minutes – Or 467.2 days (no breaks!) www.alex-singleton.com • Produced by Prof. Alex Singleton (CDRC, University of Liverpool) • R was used to automate the production of 134,567 into a collection of PDF atlases • This included downloading and formatting the data from the ONS websites
  • 41. 2011 Open Atlas Project • Code available here: rpubs.com/alexsingleton/openatlas • E.g. Step 1: Download the data E.g. archive = http://www.nomisweb.co.uk/output/census/2011/ks101ew_2011_oa.zip
  • 42. The Transport Map Book • Another automated output from Alex Singleton • Includes data on transport such as travel flows to work, accessibility to services, CO2 emissions, etc… • Stages • Data Import • Data Prep • Create Maps • Flow Maps • WZ Maps • OA Maps • LSOA Maps • LSOA CO2 Maps • Latex – output document • Code available from: github.com/alexsingleton/Transport-Map-Book
  • 43. Interactive outputs Make sharing information easier through the creation of interactive widgets
  • 44. Creating Webmaps with googleVis • Using UN data on child Labour http://data.un.org/Data.aspx?d=S OWC&f=inID%3A86 • A couple of short lines of code will create an interactive map in your internet browser
  • 45. Shiny in R • Shiny combines the computational power of R with the interactivity of the modern web • Build useful web applications with only a few lines of code—no JavaScript required • Shiny user interfaces can be built entirely using R, or can be written directly in HTML, CSS, and JavaScript for more flexibility. • Attractive default UI theme based on Twitter Bootstrap - twitter.github.com/bootstrap • Tutorial available here: http://rstudio.github.io/shiny/tutorial/ blog.snap.uaf.edu • For more examples visit: shiny.rstudio.com/gallery shiny.rstudio.com
  • 46. A Basic Shiny App ui.R server.R
  • 47. A Basic Shiny Map ui.R server.R Population density (2011 Census)
  • 48. The Power of Shiny • Why Shiny? – All the power of R in the browser – Rapid development of applications – Limited requirement for new skills – With a bit of knowledge of HTML, widgets can be very easily embedded on websites There is also the leaflet package for creating interactive “slippy” web-maps. github.com/majerus/globe
  • 49. Summary • Although it may entail a steep learning curve, there are some obvious advantages of handling spatial data in R • These include: – R’s advanced functionality, particularly due to the large range of bespoke packages which are now available – The relative simplicity of some functions with lots of customisations options – The ability to handle large volumes of data of many different formats – The possibility of using code to automate analysis and visualizations – The functionality to produce interactive outputs
  • 50. Guy Lansley Department of Geography, UCL [email protected] @GuyLansley