
 Data Structure
 Networking
 RDBMS
RDBMS Operating System
 Java
Java MS Excel
 iOS
iOS HTML
HTML CSS
CSS Android
 Python
 C Programming
 C++
C++ C#
C# MongoDB
 MySQL
MySQL Javascript
 PHP
PHP
- Selected Reading
- UPSC IAS Exams Notes
- Developer's Best Practices
- Questions and Answers
- Effective Resume Writing
- HR Interview Questions
- Computer Glossary
- Who is Who
Plotting Geospatial Data using GeoPandas
GeoPandas, a widely used Python library build on top of the Pandas library to include the support of geospatial data. Here, geospatial data or geodata describes the information related to the various locations on Earth's surface. These datasets have many use cases including visualization of maps, urban planning, analysis of trade locations, network planning and so forth. In this article, we are going to explore how the GeoPandas library works and also, how to plot geospatial data using GeoPandas.
Plotting Geospatial data using GeoPandas in Python
Since GeoPandas extends the features of the Pandas library, we need to understand the basics of Pandas first.
Pandas
It is an open-source Python library that is mainly used for data analysis and manipulation. It can handle both relational and labeled data by performing various operations on specified data, such as cleaning, filtering, grouping, aggregating and merging. We can perform these operations on geospatial data or geodata using GeoPandas.
How to plot geospatial data using GeoPandas?
Installing required packages
Our first step is to install the GeoPandas library with the help of following command:
pip install geopandas
The GeoPandas library of Python provides some built-in datasets to get started with. It includes 'naturalearth_cities', 'naturalearth_lowres', and 'nybb'. We are going to use the 'nybb' dataset for our article.
We first need to install the datasets using the following command:
pip install geodatasets
Working with the GeoPandas library
Let's see a Python program to show the details of 'nybb' dataset.
Approach
First, import the 'geopandas' with the reference name 'geopd'.
Then, import the 'get_path' to access the 'nybb' dataset.
Now, read the information of dataset using the 'read_file()' method and store it in a variable named 'maps'.
Call this variable to show the result.
# importing the required packages
import geopandas as geopd
from geodatasets import get_path
# getting the path of file
path_of_file = get_path('nybb')
# reading the data of file
maps = geopd.read_file(path_of_file)
# display the data
maps
Output

The dataset has 5 rows and 5 columns that show the geometry, area, length, name of the city and their borocode.
To visually represent the details:
We will use the built-in method 'plot()' to show the details visually.
Example
maps.plot()
Output

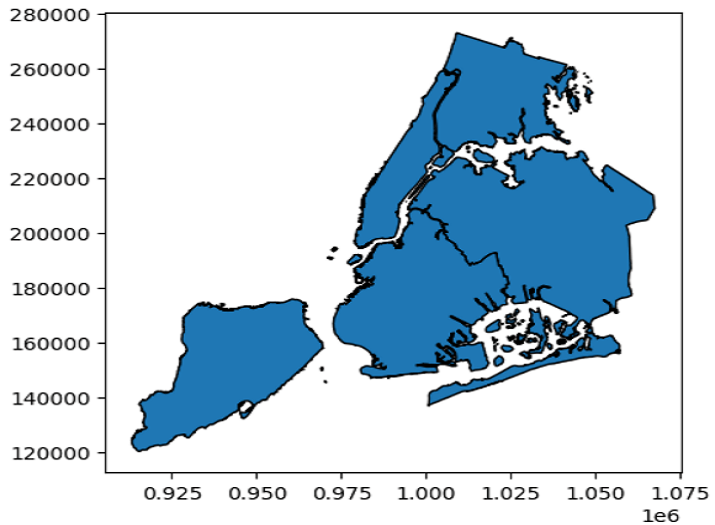
To show the clear distinction between cities, we can plot the given dataset with edgecolor.
Example
maps.plot(edgecolor = 'black')
Output
We can plot a single column of the dataset by specifying an attribute named 'column' inside the plot method.
Example
maps.plot(column = 'BoroName')
Output

Here, we will plot another column along with edgecolor.
Example
maps.plot(column = 'Shape_Leng', edgecolor = 'red')
Output

Now, we are going to plot the map of Manhattan city.
Example
maps = geopd.read_file(path_of_file)
# filtering the Manhattan from the dataset
newMap = maps[maps.BoroName == 'Manhattan']
newMap.plot(column = 'BoroName', edgecolor = 'red')
Output

With the help of 'subplots()' method, we can create two subplots of Manhattan and Brooklyn city within a single figure.
Example
# importing the required packages
import geopandas as geopd
from geodatasets import get_path
import matplotlib.pyplot as plt
path_of_file = get_path('nybb')
maps = geopd.read_file(path_of_file)
# Creating subplots of two columns
fig, (axs1, axs2) = plt.subplots(ncols = 2, figsize = (6, 4))
# filtering required cities from the dataset
newMap1 = maps[maps.BoroName == 'Manhattan']
newMap2 = maps[maps.BoroName == 'Brooklyn']
# to plot the cities
newMap1.plot(ax = axs1, column = 'BoroName', edgecolor = 'yellow')
newMap2.plot(ax = axs2, column = 'BoroName', edgecolor = 'yellow')
Output

Conclusion
In this article, we have learned how to use the GeoPandas library in plotting geospatial data. We started by defining and explaining its use case and then, we have seen how to install this library for our use. We have plotted the built-in dataset named 'nybb' using the GeoPandas library.

414 Views
