Python Matplotlib Tutorial | Matplotlib Tutorial | Python Tutorial | Python Training | Edureka
- 1. www.edureka.co/pythonEDUREKA PYTHON CERTIFICATION TRAINING Python Matplotlib
- 2. www.edureka.co/pythonEDUREKA PYTHON CERTIFICATION TRAINING Agenda ➢ Why Data Visualization? ➢ What Is Data Visualization? ➢ What Is Matplotlib? ➢ Types Of Plots ➢ Getting Started
- 3. www.edureka.co/pythonEDUREKA PYTHON CERTIFICATION TRAINING Why Data Visualization?
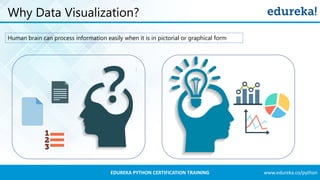
- 4. www.edureka.co/pythonEDUREKA PYTHON CERTIFICATION TRAINING Why Data Visualization? Human brain can process information easily when it is in pictorial or graphical form
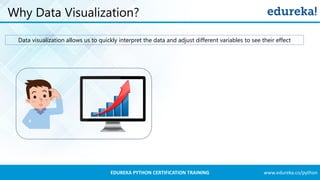
- 5. www.edureka.co/pythonEDUREKA PYTHON CERTIFICATION TRAINING Why Data Visualization? Data visualization allows us to quickly interpret the data and adjust different variables to see their effect
- 6. www.edureka.co/pythonEDUREKA PYTHON CERTIFICATION TRAINING What Is Data Visualization?
- 7. www.edureka.co/pythonEDUREKA PYTHON CERTIFICATION TRAINING What Is Data Visualization? Data visualization is the presentation of data in a pictorial or graphical format. Visualize Analyse Document Insight Transform Data set Finding Insights In Data
- 8. www.edureka.co/pythonEDUREKA PYTHON CERTIFICATION TRAINING What Is Matplotlib?
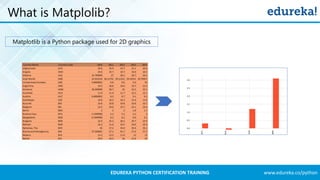
- 9. www.edureka.co/pythonEDUREKA PYTHON CERTIFICATION TRAINING What is Matplolib? Matplotlib is a Python package used for 2D graphics
- 10. www.edureka.co/pythonEDUREKA PYTHON CERTIFICATION TRAINING Types Of Plots
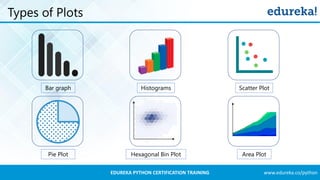
- 11. www.edureka.co/pythonEDUREKA PYTHON CERTIFICATION TRAINING Types of Plots Bar graph Histograms Scatter Plot Pie Plot Hexagonal Bin Plot Area Plot
- 12. www.edureka.co/pythonEDUREKA PYTHON CERTIFICATION TRAINING Getting Started
- 13. www.edureka.co/pythonEDUREKA PYTHON CERTIFICATION TRAINING Getting Started Here's some basic code to generate one of the most simple graph. from matplotlib import pyplot as plt #Plotting to our canvas plt.plot([1,2,3],[4,5,1]) #Showing what we plotted plt.show()
- 14. www.edureka.co/pythonEDUREKA PYTHON CERTIFICATION TRAINING Getting Started Lets add title and labels to our graph from matplotlib import pyplot as plt x = [5,8,10] y = [12,16,6] plt.plot(x,y) plt.title('Info') plt.ylabel('Y axis') plt.xlabel('X axis') plt.show() Title Labels
- 15. www.edureka.co/pythonEDUREKA PYTHON CERTIFICATION TRAINING Adding Style To Our Graph from matplotlib import pyplot as plt from matplotlib import style style.use('ggplot') x = [5,8,10] y = [12,16,6] x2 = [6,9,11] y2 = [6,15,7] plt.plot(x,y,'g',label='line one', linewidth=5) plt.plot(x2,y2,'c',label='line two',linewidth=5) plt.title('Epic Info') plt.ylabel('Y axis') plt.xlabel('X axis') plt.legend() plt.grid(True,color='k') plt.show()
- 16. www.edureka.co/pythonEDUREKA PYTHON CERTIFICATION TRAINING Bar Graph import matplotlib.pyplot as plt plt.bar([1,3,5,7,9],[5,2,7,8,2], label="Example one") plt.bar([2,4,6,8,10],[8,6,2,5,6], label="Example two", color='g') plt.legend() plt.xlabel('bar number') plt.ylabel('bar height') plt.title('Info') plt.show()
- 17. www.edureka.co/pythonEDUREKA PYTHON CERTIFICATION TRAINING Histogram import matplotlib.pyplot as plt population_ages = [22,55,62,45,21,22,34,42,42,4,99,102,110,120,121,122,130,111,115,112,80,75,6 5,54,44,43,42,48] bins = [0,10,20,30,40,50,60,70,80,90,100,110,120,130] plt.hist(population_ages, bins, histtype='bar', rwidth=0.8) plt.xlabel('x') plt.ylabel('y') plt.title('Histogram') plt.legend() plt.show()
- 18. www.edureka.co/pythonEDUREKA PYTHON CERTIFICATION TRAINING Scatter Plot import matplotlib.pyplot as plt x = [1,2,3,4,5,6,7,8] y = [5,2,4,2,1,4,5,2] plt.scatter(x,y, label='skitscat', color='k) plt.xlabel('x') plt.ylabel('y') plt.title('Scatter Plot') plt.legend() plt.show()
- 19. www.edureka.co/pythonEDUREKA PYTHON CERTIFICATION TRAINING Stack Plot import matplotlib.pyplot as plt days = [1,2,3,4,5] sleeping = [7,8,6,11,7] eating = [2,3,4,3,2] working = [7,8,7,2,2] playing = [8,5,7,8,13] plt.plot([],[],color='m', label='Sleeping', linewidth=5) plt.plot([],[],color='c', label='Eating', linewidth=5) plt.plot([],[],color='r', label='Working', linewidth=5) plt.plot([],[],color='k', label='Playing', linewidth=5) plt.stackplot(days, sleeping,eating,working,playing, colors=['m','c','r','k']) plt.xlabel('x') plt.ylabel('y') plt.title('Stck Plot') plt.legend() plt.show()
- 20. www.edureka.co/pythonEDUREKA PYTHON CERTIFICATION TRAINING Pie Chart import matplotlib.pyplot as plt slices = [7,2,2,13] activities = ['sleeping','eating','working','playing'] cols = ['c','m','r','b'] plt.pie(slices, labels=activities, colors=cols, startangle=90, shadow= True, explode=(0,0.1,0,0), autopct='%1.1f%%') plt.title('Pie Plot') plt.show()
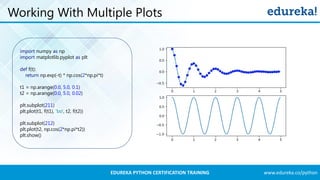
- 21. www.edureka.co/pythonEDUREKA PYTHON CERTIFICATION TRAINING Working With Multiple Plots import numpy as np import matplotlib.pyplot as plt def f(t): return np.exp(-t) * np.cos(2*np.pi*t) t1 = np.arange(0.0, 5.0, 0.1) t2 = np.arange(0.0, 5.0, 0.02) plt.subplot(211) plt.plot(t1, f(t1), 'bo', t2, f(t2)) plt.subplot(212) plt.plot(t2, np.cos(2*np.pi*t2)) plt.show()
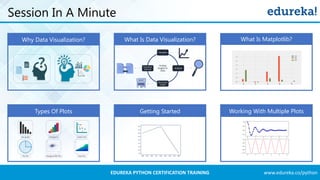
- 22. www.edureka.co/pythonEDUREKA PYTHON CERTIFICATION TRAINING Session In A Minute Why Data Visualization? What Is Data Visualization? Types Of Plots Getting Started What Is Matplotlib? Working With Multiple Plots
- 23. www.edureka.co/pythonEDUREKA PYTHON CERTIFICATION TRAINING Thank You … Questions/Queries/Feedback




![www.edureka.co/pythonEDUREKA PYTHON CERTIFICATION TRAINING
Getting Started
Here's some basic code to generate one of the most simple graph.
from matplotlib import pyplot as plt
#Plotting to our canvas
plt.plot([1,2,3],[4,5,1])
#Showing what we plotted
plt.show()](https://image.slidesharecdn.com/pythonmatplotlib-edureka-170719052138/85/Python-Matplotlib-Tutorial-Matplotlib-Tutorial-Python-Tutorial-Python-Training-Edureka-13-320.jpg)
![www.edureka.co/pythonEDUREKA PYTHON CERTIFICATION TRAINING
Getting Started
Lets add title and labels to our graph
from matplotlib import pyplot as plt
x = [5,8,10]
y = [12,16,6]
plt.plot(x,y)
plt.title('Info')
plt.ylabel('Y axis')
plt.xlabel('X axis')
plt.show()
Title
Labels](https://image.slidesharecdn.com/pythonmatplotlib-edureka-170719052138/85/Python-Matplotlib-Tutorial-Matplotlib-Tutorial-Python-Tutorial-Python-Training-Edureka-14-320.jpg)
![www.edureka.co/pythonEDUREKA PYTHON CERTIFICATION TRAINING
Adding Style To Our Graph
from matplotlib import pyplot as plt
from matplotlib import style
style.use('ggplot')
x = [5,8,10]
y = [12,16,6]
x2 = [6,9,11]
y2 = [6,15,7]
plt.plot(x,y,'g',label='line one', linewidth=5)
plt.plot(x2,y2,'c',label='line two',linewidth=5)
plt.title('Epic Info')
plt.ylabel('Y axis')
plt.xlabel('X axis')
plt.legend()
plt.grid(True,color='k')
plt.show()](https://image.slidesharecdn.com/pythonmatplotlib-edureka-170719052138/85/Python-Matplotlib-Tutorial-Matplotlib-Tutorial-Python-Tutorial-Python-Training-Edureka-15-320.jpg)
![www.edureka.co/pythonEDUREKA PYTHON CERTIFICATION TRAINING
Bar Graph
import matplotlib.pyplot as plt
plt.bar([1,3,5,7,9],[5,2,7,8,2], label="Example one")
plt.bar([2,4,6,8,10],[8,6,2,5,6], label="Example two", color='g')
plt.legend()
plt.xlabel('bar number')
plt.ylabel('bar height')
plt.title('Info')
plt.show()](https://image.slidesharecdn.com/pythonmatplotlib-edureka-170719052138/85/Python-Matplotlib-Tutorial-Matplotlib-Tutorial-Python-Tutorial-Python-Training-Edureka-16-320.jpg)
![www.edureka.co/pythonEDUREKA PYTHON CERTIFICATION TRAINING
Histogram
import matplotlib.pyplot as plt
population_ages =
[22,55,62,45,21,22,34,42,42,4,99,102,110,120,121,122,130,111,115,112,80,75,6
5,54,44,43,42,48]
bins = [0,10,20,30,40,50,60,70,80,90,100,110,120,130]
plt.hist(population_ages, bins, histtype='bar', rwidth=0.8)
plt.xlabel('x')
plt.ylabel('y')
plt.title('Histogram')
plt.legend()
plt.show()](https://image.slidesharecdn.com/pythonmatplotlib-edureka-170719052138/85/Python-Matplotlib-Tutorial-Matplotlib-Tutorial-Python-Tutorial-Python-Training-Edureka-17-320.jpg)
![www.edureka.co/pythonEDUREKA PYTHON CERTIFICATION TRAINING
Scatter Plot
import matplotlib.pyplot as plt
x = [1,2,3,4,5,6,7,8]
y = [5,2,4,2,1,4,5,2]
plt.scatter(x,y, label='skitscat', color='k)
plt.xlabel('x')
plt.ylabel('y')
plt.title('Scatter Plot')
plt.legend()
plt.show()](https://image.slidesharecdn.com/pythonmatplotlib-edureka-170719052138/85/Python-Matplotlib-Tutorial-Matplotlib-Tutorial-Python-Tutorial-Python-Training-Edureka-18-320.jpg)
![www.edureka.co/pythonEDUREKA PYTHON CERTIFICATION TRAINING
Stack Plot
import matplotlib.pyplot as plt
days = [1,2,3,4,5]
sleeping = [7,8,6,11,7]
eating = [2,3,4,3,2]
working = [7,8,7,2,2]
playing = [8,5,7,8,13]
plt.plot([],[],color='m', label='Sleeping', linewidth=5)
plt.plot([],[],color='c', label='Eating', linewidth=5)
plt.plot([],[],color='r', label='Working', linewidth=5)
plt.plot([],[],color='k', label='Playing', linewidth=5)
plt.stackplot(days, sleeping,eating,working,playing, colors=['m','c','r','k'])
plt.xlabel('x')
plt.ylabel('y')
plt.title('Stck Plot')
plt.legend()
plt.show()](https://image.slidesharecdn.com/pythonmatplotlib-edureka-170719052138/85/Python-Matplotlib-Tutorial-Matplotlib-Tutorial-Python-Tutorial-Python-Training-Edureka-19-320.jpg)
![www.edureka.co/pythonEDUREKA PYTHON CERTIFICATION TRAINING
Pie Chart
import matplotlib.pyplot as plt
slices = [7,2,2,13]
activities = ['sleeping','eating','working','playing']
cols = ['c','m','r','b']
plt.pie(slices,
labels=activities,
colors=cols,
startangle=90,
shadow= True,
explode=(0,0.1,0,0),
autopct='%1.1f%%')
plt.title('Pie Plot')
plt.show()](https://image.slidesharecdn.com/pythonmatplotlib-edureka-170719052138/85/Python-Matplotlib-Tutorial-Matplotlib-Tutorial-Python-Tutorial-Python-Training-Edureka-20-320.jpg)
